Unlock a world of possibilities! Login now and discover the exclusive benefits awaiting you.
Product Innovation
By reading the Product Innovation blog, you will learn about what's new across all of the products in our growing Qlik product portfolio.
Support Updates
The Support Updates blog delivers important and useful Qlik Support information about end-of-product support, new service releases, and general support topics.
Qlik Academic Program
This blog was created for professors and students using Qlik within academia.
Community News
Hear it from your Community Managers! The Community News blog provides updates about the Qlik Community Platform and other news and important announcements.
Qlik Digest
The Qlik Digest is your essential monthly low-down of the need-to-know product updates, events, and resources from Qlik.
Qlik Learning
The Qlik Learning blog offers information about the latest updates to our courses and programs, as well as insights from the Qlik Learning team.
Recent Blog Posts
-
Creating a Collapsible Filter Panel
This video will show you how easy it is to create a collapsible filter panel that is both functional and inclusive to your dashboard objects.
-
How to Calculate Duration when you have only one date time column
Learn how to simply calculate duration when you have only one date / time column.
-
Qlik Connect 2024 に参加してきました!
本年 6月 3日から 5日にかけて米国オーランドにてQlik Connectが開催されました。日本からは 40名近いお客様・パートナー様が参加されました。その模様をお送りします。 -
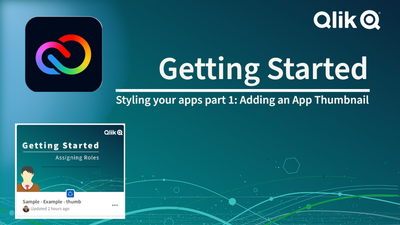
Creating a Qlik Sense App Thumbnail with Adobe Express Web
Give your Qlik Sense Apps some style. Make them stand out in the Qlik Cloud Hub with eye catching and visually pleasing thumbnails. See how I use Adobe Express to quickly and easily give my Qlik Sense Apps some polish.Full Video:https://youtu.be/n8y0GINxDu0Full Playlist:https://www.youtube.com/playlist?list=PLW1uf5CQ_gSqF5bcmbBrk1q7Q4-h899V1
-
Qlik Introduces a New Era of Visualization
"A picture is worth a thousand words, but a visualization can tell a million stories." -
Looping through cloud-based file data using a metadata connector (video)
In today's blog....as promised, Qlik Solution Architect Tomilayo Komolafe (Tomi) is back providing real in-the-trenches solutions to real customer problems. ( If you missed Tomi's introduction to the Qlik Design Blog and our last post / video, you can visit this link - Contact Tracing with Qlik Sense SaaS - and Active Intelligence Solution.)When working with a Qlik customer, Tomi stumbled upon a particular problem of not being able to iterate ov... Show MoreIn today's blog....as promised, Qlik Solution Architect Tomilayo Komolafe (Tomi) is back providing real in-the-trenches solutions to real customer problems. ( If you missed Tomi's introduction to the Qlik Design Blog and our last post / video, you can visit this link - Contact Tracing with Qlik Sense SaaS - and Active Intelligence Solution.)
When working with a Qlik customer, Tomi stumbled upon a particular problem of not being able to iterate over, or loop through, file data stored in a cloud-based platform. Tomi recorded a video of the particular solution, which I embedded below along with some sample data and a sample Qlik Sense App.(attached below) - I would like to mention that Tomi borrowed some Qlik script for this solution from Qlik MVP and Luminary @stevedark of Quick Intelligence fame. I would like to also thank Steve for his valuable contributions, not only to help make this solution easy and possible but also for all the help he provides to our Qlik Community members (reference material links below). 👍 - Thanks Steve and Tomi for demonstrating teamwork for results a Qlik core value to help our customers.Before we get started - a word from our sponsor 😁
- Don't forget to sign up for our next Do More with Qlik - next week 4/8 @ 2PM - where Jeff Goldberg and I will cover Qlik Sense SaaS and our new Webhooks integration.
Register here:
The Problem
The problem was observed when recently working with a customer who needed to bring in 800+ csv files stored in his company’s OneDrive shared folder location into Qlik. If the files were stored in his local directory, he could use Qlik’s wildcard character to ingest many of these files. Something as simple as “*.csv” for example would have returned all files that are CSVs in his lib file path. Unfortunately, many of these cloud vendor options such as Google Drive, OneDrive, Dropbox, etc, don’t allow for use of special characters in their environment. Obviously, he would’ve needed to load all 800 CSV files individually right? 😉
Luckily, there’s a solution that automates this process in Qlik and still provides enough flexibility for the end user. Watch this video to learn how and note the links and reference materials below - including sample solution and data attached.
Can't see the video? YouTube blocked by your region or organization? Download LoopFiles.zip for a copy of the .mp4 file that you can download and watch on your computer or mobile device.
Reference: (Steve Dark solutions)
Files:
- sample_data_and_app.zip
- Extract .xls files to cloud-based storage location of your choice (OneDrive in this example)
- Import .QVF file
- Add / Edit Metadata / cloud data source connections appropriately
Qlik Help:
- Don't forget to sign up for our next Do More with Qlik - next week 4/8 @ 2PM - where Jeff Goldberg and I will cover Qlik Sense SaaS and our new Webhooks integration.
-
Managing your Analytics lifecycle in Qlik Cloud Analytics - UPDATE!
Our Leigh Kennedy, Distinguished Principal Enterprise Architect, is back with an updated look on applying software development life cycle (SDLC) concepts to your Qlik Cloud Analytics tenants. Take it away Leigh!
-
Techspert Talks - Migrating QS Client-Managed to Qlik Cloud
Hi everyone, Want to stay a step ahead of important Qlik support issues? Then sign up for our monthly webinar series where you can get first-hand insights from Qlik experts.The Techspert Talks session from June looked at Migrating Qlik Sense Clien-Managed to Qlik Cloud. But wait, what is it exactly?Techspert Talks is a free webinar held on a monthly basis, where you can hear directly from Qlik Techsperts on topics that are relevant to Customers a... Show MoreHi everyone,
Want to stay a step ahead of important Qlik support issues? Then sign up for our monthly webinar series where you can get first-hand insights from Qlik experts.
The Techspert Talks session from June looked at Migrating Qlik Sense Clien-Managed to Qlik Cloud.But wait, what is it exactly?
Techspert Talks is a free webinar held on a monthly basis, where you can hear directly from Qlik Techsperts on topics that are relevant to Customers and Partners today.In this session, we will cover:
- What to plan for
- Migration Pathways
- Cloud Best Practices

-
Qlik now supports HIPAA requirements for US Healthcare
As healthcare organizations become digitally mature and data-driven, adopting a “platform mentality” becomes critical in delivering the full potential of analytics. Our platform can empower healthcare professionals and patients, creating a human-data synergy across the care continuum. -

-
P&L Pivot Chart Extension
Several years ago, I blogged about how I used IntervalMatch to create a profit and loss statement. Now that Qlik Sense has the P&L Pivot chart extension in the visualization bundle, I decided to test out the extension to see how it may help create a P&L report in Qlik Sense. This blog will review some of my findings and what was involved to create the P&L Pivot chart shown below. The P&L Pivot chart extension provides a lot of properties that al... Show MoreSeveral years ago, I blogged about how I used IntervalMatch to create a profit and loss statement. Now that Qlik Sense has the P&L Pivot chart extension in the visualization bundle, I decided to test out the extension to see how it may help create a P&L report in Qlik Sense. This blog will review some of my findings and what was involved to create the P&L Pivot chart shown below.
The P&L Pivot chart extension provides a lot of properties that allow you to change the style and coloring in the chart. You can find a complete list of the properties here in Qlik Help. The chart above uses one dimension and 6 measures but I could have used up to 9 measures with my single dimension or used 2 dimensions and up to 8 measures. After loading the data into Qlik Sense, my next step was to create a style template that I could use to handle the formatting of the chart. Here is a snapshot of the template in Excel:
I added a header row so that I could easily see what options I could set but it is not required and can be omitted. In the styling template, Column A should include the data that is in the first dimension of the chart you will be applying the template to. Note that this data is case sensitive. The other columns have the various styles that can be modified via the template.
Here is an example of the same template in a CSV file.
If a template is used, it needs to be loaded via the script. Here is how you can load the Excel and CSV versions of the templates:
Excel:
CSV:
The key in both scripts is that the entire template needs to be loaded into one field which can later be selected from the Style template field drop down in the Properties window of the P&L Pivot chart. In the Excel script, the styles are concatenated into one field separated by semi-colons. In the CSV file, the file format is set to Fixed record to load all the data into one field. Note that the name that you give the field in the script will be the template name you select from the Style template field drop down.
Each row of the template should have this format:
DimensionValue;Bold;Background;FontStyle;TextColor;Align;FontSize;Comment
- DimensionValue is the data value of the dimension in the row that you would like the change
- Bold is used to bold the text in a row
- Background is used to set the background color of a row
- FontStyle is used to change the font style of a row to italic or oblique
- TextColor is used to change the default black font color of a row to white
- Align is used to set the alignment to center
- FontSize is used to change the font size of a row
- Comment is used to replace all zeros with a space
Check Qlik Help to see the default and styling options that are available in the styling template.
There are many additional properties that can be set in the properties window of the P&L Pivot chart extension. I kept many of the defaults but here are some that I changed. In the Table Format section of the Properties, I checked Indent to indent the P&L Heading. The columns can be narrow so I moved the Column width slider all the way to the right, (for max width), and changed the Font family so that I could see as much of the numeric values in the chart as possible. I tweaked the header coloring in the Header format section. I opted not to color variances below 0% red because then I would lose some of my styling template changes. While I used a styling template in my example, you do not have to. The P&L Pivot chart extension can be styled via the Properties window without using a template.
The P&L Pivot chart extension provides a ton of styling options that can be used to easily make your profit and loss statement looks exactly the way you want. It is worth checking out or you can watch this video to learn more.
Thanks,
Jennell
-
Connector Factory - May and June 2024 releases
For May & June 2024, Connector Factory has released more connectors and new capabilities for data integration, data analytics and application automation. -
【7/10(水)14:00 開催】SAP データ活用の課題解決 Web セミナー
生成 AI の業務への組み込みは、DX のさらなる推進という従来からの取り組みと共に、多くの企業での喫緊の課題となっています。そしてその根幹にあるのはデータ活用であることは言うまでもありません。 その中でも生産・流通・財務・人事など主要業務システムの根幹でもある SAP データの活用は多くの企業が望んでいます。Qlik は、これまでに数多くの SAP ユーザー様との対話を重ね、SAP データ活用の課題の理解に努め、さまざまな解決策をご提案してまいりました。 本 Web セミナーではこれらを集大成し、SAP ユーザーの皆さまが抱える課題を整理し、最適なソリューションと顧客事例をご紹介します。SAP の運用に関わる方だけでなく、SAP データをさらに活用したいビジネスユーザーの方、SAP の投資効果を高めたい経営部門のご参加をお待ちしています。 ※参加費無料。パソコン・タブレット・スマートフォンで、どこからでもご参加いただけます。今すぐ申し込む【開催概要】日時:2024年 7月 10日(水)... Show More生成 AI の業務への組み込みは、DX のさらなる推進という従来からの取り組みと共に、多くの企業での喫緊の課題となっています。そしてその根幹にあるのはデータ活用であることは言うまでもありません。
その中でも生産・流通・財務・人事など主要業務システムの根幹でもある SAP データの活用は多くの企業が望んでいます。Qlik は、これまでに数多くの SAP ユーザー様との対話を重ね、SAP データ活用の課題の理解に努め、さまざまな解決策をご提案してまいりました。
本 Web セミナーではこれらを集大成し、SAP ユーザーの皆さまが抱える課題を整理し、最適なソリューションと顧客事例をご紹介します。SAP の運用に関わる方だけでなく、SAP データをさらに活用したいビジネスユーザーの方、SAP の投資効果を高めたい経営部門のご参加をお待ちしています。
※参加費無料。パソコン・タブレット・スマートフォンで、どこからでもご参加いただけます。
今すぐ申し込む
【開催概要】
日時:2024年 7月 10日(水)14:00 - 15:00
会場:オンライン
参加費:無料 -
Welcome Talend Members!
Welcome Talend Community members to the Qlik Community! We are so DELIGHTED to have you be a part of the Qlik family and Qlik Community! Our Community is a place to ask questions, find solutions, engage with other members and employees, and so much more. We would like to take this time to show you around and help you acclimate to your new surroundings. Before we start showing you the ropes, a very important note: YOUR ACTION IS REQUIRED! Please r... Show MoreWelcome Talend Community members to the Qlik Community!
We are so DELIGHTED to have you be a part of the Qlik family and Qlik Community! Our Community is a place to ask questions, find solutions, engage with other members and employees, and so much more. We would like to take this time to show you around and help you acclimate to your new surroundings.
Before we start showing you the ropes, a very important note:
YOUR ACTION IS REQUIRED!
Please register (click 'Sign Up' underneath the login form) for the Qlik Community by creating a Qlik Account. You MUST use the same email address used to register on the Talend Community. This will ensure your activity from the Talend Community persists within the Qlik Community.
If you do not remember the email address you signed up with or do not see your previous activity, please reach out to qlikcommunityadmins@qlik.com.
If you are a member of both Communities, your accounts should merge into one. If this is not what you experienced, please reach out to qlikcommunityadmins@qlik.com.
Participating in the Discussions
The Talend forums can be found by going to Forums > Data Integration. Here you will find a section called, ‘Formerly Talend’. The board names have remained the same to ensure a seamless experience. All posts have been brought over, as well as any attachments, embedded links, and likes (kudos).
Searching the Knowledgebase
Members of the Support and Digital Experience team have been hard at work, combing through the Talend articles checking validity and updating the content to ensure the latest and greatest information is at your fingertips. About 900 articles are available in the Community, with more on the way!
The articles can be found under Support > Knowledge > Official Support Articles.
Use the search bar to find articles using key terms, phrases, error messages, etc.
Filter the results using the facets on the left of the search results. Filter by 'Product' or 'Labels by Topic' to find what you are looking for.
The remaining articles will be added within the next couple of weeks. If there is anything you need and do not see, please let us know. Also in the coming weeks, redirects will be added to accommodate any saved bookmarks.
Creating Support Cases
Combining the two Communities is one amazing step towards integrating the two companies. The Support Portals will remain separate for the time being, which requires Authorized Support Contacts to continue to use the Talend Support portal to create cases.
Existing articles can still be found in the Support portal; however, they will only be maintained in the Qlik Community.
Viewing My Profile
All members that have logged in since January of 2019, were brought into the Qlik Community. Please note: if you registered for the Talend Community on or after January 11, 2024, your user will not be in the Qlik Community.
To get to your profile, click on the avatar in the top right corner and click “My Profile”.
The profile will display any recent conversations you participated in and show your current rank plus any badges earned. It will also display stats such as the number of posts, solutions accepted, likes given and likes received.
Your rank will replace the points you earned in the Talend Community. The more active you are, the higher the rank you will achieve. Learn more about ranks in the Qlik Community here.
Badges earned have been replaced with the Qlik Community badges. The two systems were very similar with badging, so you should mostly see the same badges.
Please note: badges will not appear on your profile until you log into the Qlik Community.
Learn more about Qlik Community
Here are some helpful resources to learn more about Qlik Community:
- Do’s and Don’ts for all Community members
- How to view and update your profile
- How to update your notification settings plus
- Subscribing in the Qlik Community
For more useful content about Qlik Community, see Get Started and Suzy’s Tips.
Where to ask questions about Qlik Community
We know this is a big change, but we hope an exciting one! If you should have any questions about Qlik Community, please do not hesitate to reach out to us. You can find us at the Water Cooler.
This is a lot of information all at once so please let us know in the comments below or in the Water Cooler what questions you have. We are here to help you through this transition.
Welcome again, we are thrilled to have you here!
Your Qlik Community Admins,
Melissa, Sue, Jamie, and Nicole
@Melissa_Potvin @Sue_Macaluso @Jamie_Gregory @nicole_ulloa
-
User.Environment.What?! - Session Attributes in Qlik Sense
Today - Jeff Goldberg is back and will introduce us to using session attributes to pass security and other information to a Qlik Sense session.IntroductionDid you know with Qlik Sense security rules, it's possible to use attributes delivered to Qlik Sense Enterprise during the authentication process? Yup, it's true. While the conventional approach to using attributes is to import them using a User Directory Connector, session attributes are a fl... Show MoreToday - Jeff Goldberg is back and will introduce us to using session attributes to pass security and other information to a Qlik Sense session.
Introduction
Did you know with Qlik Sense security rules, it's possible to use attributes delivered to Qlik Sense Enterprise during the authentication process? Yup, it's true. While the conventional approach to using attributes is to import them using a User Directory Connector, session attributes are a flexible alternative to storing attributes in the repository to control capabilities and authorization in Qlik Sense Enterprise.
Qlik Sense supports session attributes through SAML, ticketing, and session authentication schemes. Session attributes are attributes sent in the request for access to the Qlik Sense server. The attributes are not stored in the repository, but in the user's Qlik Sense session. Session attributes can be referenced in security rules using the user.environment (e.g. user.environment.attributename) syntax. In addition, if there is an attribute named group sent to Qlik Sense using SAML, ticketing, or session, it can be used in Section Access data reduction.
Session Attributes in SAML
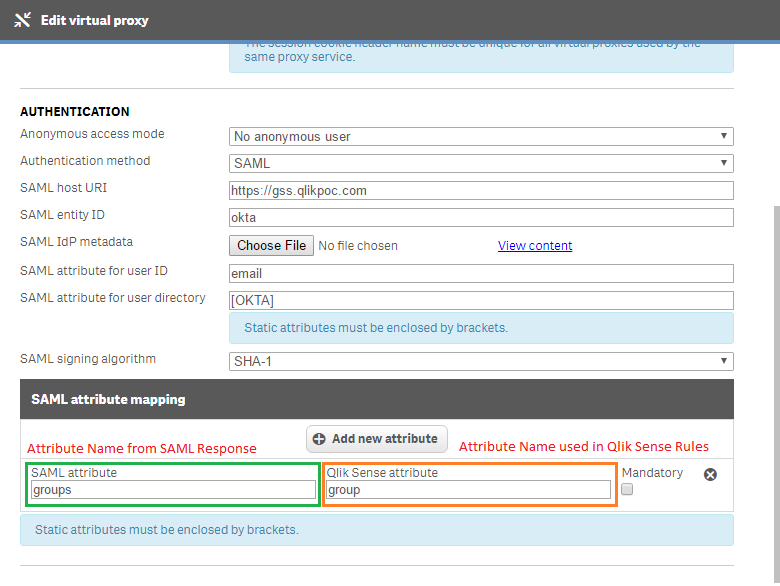
When you setup a SAML virtual proxy in Qlik Sense, there is an additional attributes section where you can add attribute names from the saml response sent by the identity provider, and the name you want to use in Qlik Sense. Here you can see I have a SAML integration with Okta. I have an additional attribute that comes in from Okta named Groups. In Qlik Sense I have it use the name group. The name on the left must match what is sent by the idp. The name on the right can be whatever you want it to be.
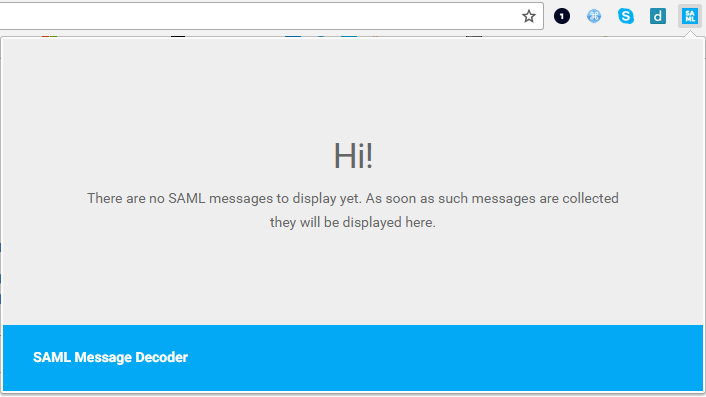
How do you identify the names of the attributes contained in the SAML response? I use SAML Message Decoder chrome extension. It's a great tool for reading through the messages sent to an IDP and sent to the Qlik Sense server.
<?xml version="1.0" encoding="UTF-8"?>
<saml2p:Response xmlns:saml2p="urn:oasis:names:tc:SAML:2.0:protocol"
        Destination="https://gss.qlikpoc.com:443/okta/samlauthn/"
        ID="id1026813850591869499238360"
        InResponseTo="_583b079d-39d2-44ab-9824-1336e628770e"
        IssueInstant="2016-12-13T14:03:23.898Z"
        Version="2.0"
        xmlns:xs="http://www.w3.org/2001/XMLSchema">
<...>
    <saml2 :AttributeStatement xmlns:saml2="urn:oasis:names:tc:SAML:2.0:assertion">
      <saml2 :Attribute Name="email"
             NameFormat="urn:oasis:names:tc:SAML:2.0:attrname-format:unspecified">
        <saml2 :AttributeValue xmlns:xs="http://www.w3.org/2001/XMLSchema"
               xmlns:xsi="http://www.w3.org/2001/XMLSchema-instance"
               xsi:type="xs:string">goldbergjeffrey@yahoo.com</saml2:AttributeValue>
      </saml2:Attribute>
          <saml2 :Attribute Name="groups" NameFormat="urn:oasis:names:tc:SAML:2.0:attrname-format:unspecified">
          <saml2 :AttributeValue xmlns:xs="http://www.w3.org/2001/XMLSchema" xmlns:xsi="http://www.w3.org/2001/XMLSchema-instance"
xsi:type="xs:string">QlikGroup</saml2:AttributeValue>
          <saml2 :AttributeValue xmlns:xs="http://www.w3.org/2001/XMLSchema" xmlns:xsi="http://www.w3.org/2001/XMLSchema-instance"
xsi:type="xs:string">Everyone</saml2:AttributeValue>
        </saml2:Attribute>
    </saml2:AttributeStatement>
</saml2p:Response>
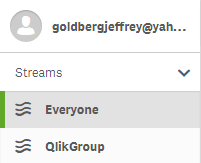
In Qlik Sense, I've created a stream for members of the QlikGroup group to access in the Qlik Sense Hub. The security rule I put in place uses the user.environment.group attribute and evaluates it against the QlikGroup group value.
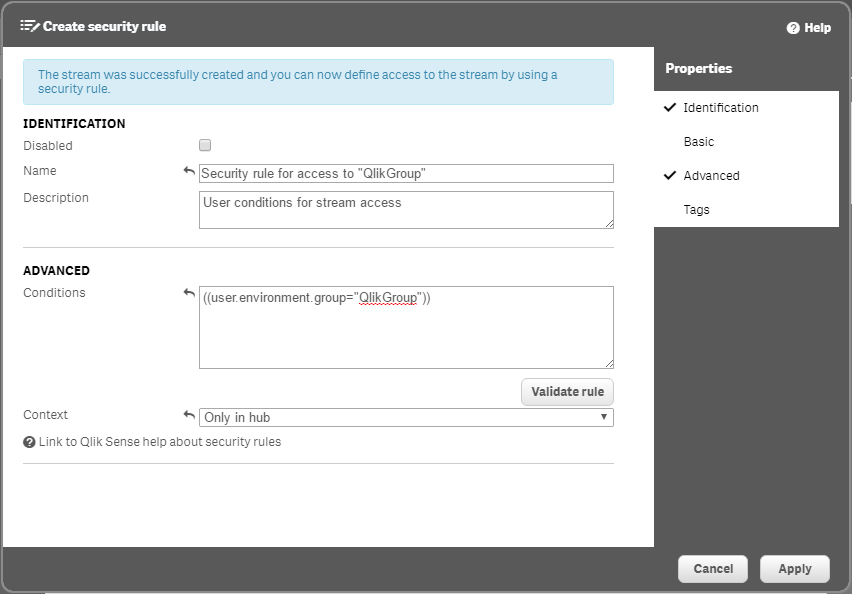
When I log into Qlik Sense, you see that I have access to the stream I created because in my SAML response I am a member of the QlikGroup group.
Session Attributes in Ticketing and Session
When ticketing and session authentication schemes are used session attributes are sent as part of the request. Here is a snippet from some sample code that demonstrates how to send attributes in a ticketing request. Notice that in the JSON message there is the UserDirectory and UserId properties and then the attributes property which is an array inside you specify an additional JSON object for each key value pair that's used to send an attribute to Qlik Sense.
ticket request message body
{...}
//The body message sent to the Qlik Sense Proxy api will add the session to Qlik Sense for authentication
string body = "{ 'UserId':'" + user + "','UserDirectory':'" + userdirectory +"',";
    body+= "'Attributes': [{"group":"QlikGroup"},{"group":"Sales"}],";
    body+= "}";

byte[] bodyBytes = Encoding.UTF8.GetBytes(body);
{...}
Once a session attribute has been sent through the ticketing or session request system those attributes are stored for the duration of the users access and are used for security rules just like in the SAML example. Let's take a quick at how this works. I'll navigate to my webpage that uses the ticketing code. Inside the ticketing code I've supplied a group attribute that will grant me access to the QlikGroup stream. During authentication, security rules will evaluate and determine that I have a group attribute and the security rule uses user.environment.group to grant me access to the QlikGroup stream.
Section Access
In the previous examples I sent along an attribute named group. In reality I could send any attribute I want through the session attributes mechanism. But the group attribute name has some additional capabilities within Qlik Sense. Using the group attribute name allows those values to pass into an application for section access data reduction purposes.
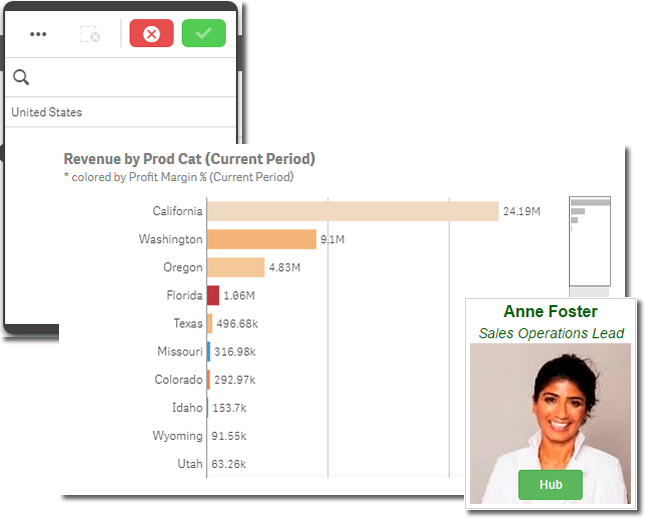
Let's go ahead and open up a sales application as Anne Foster.
Her data is reduced to only the United States because the session attribute named group has a value of "SalesUS".
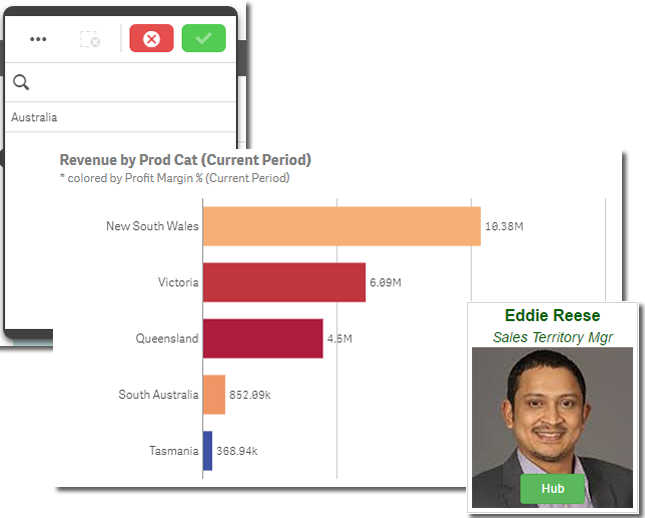
When I log in as Eddie Reese, he is only able to see Australia because his the session attribute value for him is "SalesAUS".
Wrap up
Session attributes are a powerful and flexible alternative to user directory connectors when using SAML, ticketing, or session authentication schemes. Session attributes are accessible in security rules with the user.environment syntax, and when the session attribute is named "group", the values may be used with Section Access data reduction. To learn more Qlik products and discover additional technical materials, join the conversation on our Qlik Community, Qlik Help YouTube channel and view the video libraries on the Qlik Community: New to Qlik Sense Videos - New to QlikView Videos
About Jeff:

Jeff is a Principal Enterprise Architect on the North America Enterprise Architecture team who has worked in various technology positions for over 16 years. Jeff focuses on integration, deployment, automation, security, and api topics across a wide range of software. Thanks for this valuable contribution Jeff!
(Hey Jeff - this pic is going to give me nightmares!)

Follow us:
Jeff Goldberg (@goldbergjeffrey) | TwitterMike Tarallo (@mtarallo) | Twitter
-
Thank you for making Qlik Connect a success!
Share your favorite Connect moments with Qlik Community -
Qlik Inline load
Inline load is a type of data load that can be used when you do not have a data source. The data can be entered manually or by using the wizard within QlikView or Qlik Sense.Here are a couple of key things to remember:Data entered through an inline clause must be enclosed by square brackets [ ]The columns of the table are defined in the first line of the inline load statement, separated by comas.A semi colon (;) is required after the closing squa... Show MoreInline load is a type of data load that can be used when you do not have a data source. The data can be entered manually or by using the wizard within QlikView or Qlik Sense.
Here are a couple of key things to remember:- Data entered through an inline clause must be enclosed by square brackets [ ]
- The columns of the table are defined in the first line of the inline load statement, separated by comas.
- A semi colon (;) is required after the closing square bracket
Here is an example of a simple table using inline load:Load * Inline [
ID, Name, Age, Title
1, Wladimir, 31, Team Lead
2, Paul, 22, Technical Support Engineer
3, Mark, 40, Customer Support Engineer
4, Janne, 27, IT Specialist
];
In the example inline load above, the columns for the table are:
- ID
- Name
- Age
- Title
The values starting with 1, are all data values that will populate the table. After loading the data, and looking at the data model, it will look like a normal table:As with any other dataset, two inline load tables can be created and be connected as can be seen below. You can also connect your inline table to an already existing table:
Inline load using the QlikView wizard:
You can accomplish the same result using the QlikView Inline load wizard.
In the edit script window, go to Insert > Load Statement > Load Inline. A window with a structure of a table will appear. Select the top cell indicated by F1 and change its value to the name of your first column. Repeat for the other columns of your inline table. Insert the data to create the table. At the end, your table should look like this:Inline load using the Qlik Sense wizard:
In the Data Manager, select the ‘Manual Entry’ option located at the top left corner of the screen.
Add the table name and double click on Field_1 cell to insert your first column name. Repeat this for the other columns. After naming all the columns, you should have something like in the image below.
Note that at the bottom right you can see the column count = 4 and number of rows = 0. If you Insert data, you see that the number of rows is no longer 0.For more detail information on using the Qlik Sense Wizard, please see the following resources:
Manual Entry - Qlik Sense
Inline load Delimiter
Please give this post a like if you found it helpful! Also please let us know if you have any questions or leave your feedback in the comments. -
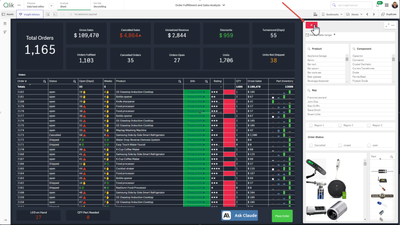
Healthcare Dashboard (Oncology)
Healthcare Dashboard AnyChart Unlock transformative insights in healthcare using Decomposition Tree, Gantt Chart, Combo Chart, Sunburst Chart, and Timeline Chart visualizations in Qlik Sense. Discoveries Dive deep into metrics like admissions, patient counts, and treatment costs. Perform root cause analysis or ad-hoc explorations with ease. Maintain clear, actionable visibility of doctor-patient timelines and track each patient's jour... Show MoreHealthcare DashboardAnyChart Unlock transformative insights in healthcare using Decomposition Tree, Gantt Chart, Combo Chart, Sunburst Chart, and Timeline Chart visualizations in Qlik Sense.
Discoveries
Dive deep into metrics like admissions, patient counts, and treatment costs. Perform root cause analysis or ad-hoc explorations with ease. Maintain clear, actionable visibility of doctor-patient timelines and track each patient's journey with insightful precision.
Impact
Experience how charts like Decomposition Tree, Gantt Chart, Combo Chart, Sunburst Chart, and Timeline Chart can enable powerful insights for a healthcare (oncological) institution
Audience
Healthcare institutions looking to unlock more efficient and insightful exploration of their data within their Qlik environment.
Data and advanced analytics
This application features Decomposition Tree, Gantt Chart, Combo Chart, Sunburst Chart, and Timeline Chart visualizations built with AnyChart's extensions for Qlik Sense. The data is fictional, representing a healthcare (oncological) institution.
-
Release Cadence Update: Qlik GeoAnalytics
We are introducing changes to the release cadence of our Qlik GeoAnalytics products, including: Server, Plus, Extensions, and Connectors for Qlik Sense Client Managed and QlikView. Beginning with May 2025, we will be releasing one yearly update, with a target release month of May. If needed, we will deliver service releases throughout the year on demand. As always, we recommend upgrading to the latest available release and SR (service release... Show MoreWe are introducing changes to the release cadence of our Qlik GeoAnalytics products, including:
- Server,
- Plus,
- Extensions,
- and Connectors for Qlik Sense Client Managed and QlikView.
Beginning with May 2025, we will be releasing one yearly update, with a target release month of May. If needed, we will deliver service releases throughout the year on demand.
As always, we recommend upgrading to the latest available release and SR (service release). If you are looking for information on version compatibility, see our official documentation.
This change was done to match with Qlik Sense Enterprise On Windows.
General GeoAnalytics information
About Qlik GeoAnalytics | Qlik GeoAnalytics Help
Version Compatibility
GeoAnalytics for Qlik Sense supported versions | Qlik GeoAnalytics Help
GeoAnalytics for QlikView supported versions | Qlik GeoAnalytics HelpDon't hesitate to reach out with any questions you might have.
Thank you for choosing Qlik,
Qlik Support -
OpenID Connect configuration in Qlik Cloud Services - Explained
A brief overview of OpenID Connect and a detailed explanation of the configuration settings for identity providers in Qlik Cloud Services.