Unlock a world of possibilities! Login now and discover the exclusive benefits awaiting you.
Analytics & AI
Forums for Qlik Analytic solutions. Ask questions, join discussions, find solutions, and access documentation and resources.
Data Integration & Quality
Forums for Qlik Data Integration solutions. Ask questions, join discussions, find solutions, and access documentation and resources
Explore Qlik Gallery
Qlik Gallery is meant to encourage Qlikkies everywhere to share their progress – from a first Qlik app – to a favorite Qlik app – and everything in-between.
Qlik Community
Get started on Qlik Community, find How-To documents, and join general non-product related discussions.
Qlik Resources
Direct links to other resources within the Qlik ecosystem. We suggest you bookmark this page.
Qlik Academic Program
Qlik gives qualified university students, educators, and researchers free Qlik software and resources to prepare students for the data-driven workplace.
Recent Blog Posts
-
【開催報告】Qlik アドボケイトミートアップ
Qlik アドボケイトとは、Qlik をこよなく愛し、その使い方を極め、ビジネスに活用して成果を上げ、その良さを社内外に広めていただいているエバンジェリストの集まりです。日本ではすでに 50名ほどの方がアドボケイトとして活躍されています。 今年最初のアドボケイトミートアップが、Qlik Lumina... Show MoreQlik アドボケイトとは、Qlik をこよなく愛し、その使い方を極め、ビジネスに活用して成果を上げ、その良さを社内外に広めていただいているエバンジェリストの集まりです。日本ではすでに 50名ほどの方がアドボケイトとして活躍されています。
今年最初のアドボケイトミートアップが、Qlik Luminary の萬様と 4名のアドボケイト幹事メンバーを中心にオンラインで開催されました。
はじめに Qlik Luminary とアドボケイトに新たに就任されたメンバーの紹介があり、続いて3つの部屋に分かれてのディスカッションとなりました。ここではそれぞれが最近興味を持っていることや、ミートアップで今後取り上げたいトピックなどについての活発な意見交換が行われました。
AI、DWH、QlikView移行、Insight Advisor、ロードスクリプト、Chat GPT、セキュリティ、人材教育、日本リージョンなど様々なキーワードが飛び交いました。また、「AutoML に魅力を感じているから SaaS に移行したい」「経営陣の利用促進が課題」などの声も聞かれました。今回の内容についてあらためて幹事メンバーで検討し、ご要望の多かったものを今後のユーザーミートアップ等で取り上げていく予定です。ぜひご期待ください。
-
WhatsApp Automation Integration for Qlik Application Automation
WhatsApp Automation Integration for Qlik Application AutomationDataGlow ITWhatsApp is missing as a native delivery target from Qlik Application Automa... Show MoreWhatsApp Automation Integration for Qlik Application AutomationDataGlow IT WhatsApp is missing as a native delivery target from Qlik Application Automation. DataGlow IT have engineered a process to allow output WhatsApp as an alternative to delivery via Teams, Slack or Email. Utilising WhatsApp as a delivery target opens up multiple use cases for Customer and Consumer data delivery. Furthermore, there also exists the ability to have a configurable conversation via WhatsApp, optionally utilising further 2 way interactions with Qlik Application Automation.
Discoveries
Share data from Qlik outside of the standard business delivery systems such as Teams, Slack and Email. Have conversations with your
Impact
Governed conversations, data and updates can now be shared to both Customers and Colleagues via WhatsApp, enabling them delivery and key data points from Qlik without needing Qlik licensing, or corporate comms infrastructure such as Teams or SharePoint.
Audience
Ideal for rolling out updates for Customers to WhatsApp directly from Qlik. Examples include delivering order status updates, surveys and regular KPI delivery.
Data and advanced analytics
Gather ultra-responsive feedback from clients and colleagues via a native and frequently used platform in WhatsApp.
-
Troubleshooting your Qlik Sense Installation or Upgrade
Qlik Sense may end up experiencing issues during an installation or an upgrade, even if you’ve already tested the same process in a different environ... Show MoreQlik Sense may end up experiencing issues during an installation or an upgrade, even if you’ve already tested the same process in a different environment. Those problems can be time consuming and frustrating to resolve, so I am going to give you some tips on how to accomplish a successful install/upgrade from scratch, and how to troubleshoot an issue, should something go wrong.
Here is what we will talk about
- Preparation and Best Practices
- Install or Upgrade – How to do it?
- Troubleshooting
Preparation and Best Practices
To prevent any unpleasant surprises, an installation or an upgrade requires a bit of preparation.
This will ensure that the installer completes on its first try and that you can access the platform afterwards. It also allows for a better understanding and control of your system.
Below are a few key points to check before installing or upgrading Qlik Sense:
- Make sure your environment follows at least the minimum requirements for the version of Qlik Sense you wish to install or upgrade to. This includes Operating System version, hardware requirements, disk space, type of storage, ports, etc. This information is available on qlik.com. (make sure you select the right version top left of the screen)
- If you are running an Antivirus or any software scanning your machine, be sure to follow our best practice
- If possible, try to get a dedicated machine to ensure no other software will fight for ports, resources, files…
- If using a virtual machine, be sure to follow our best practices.
- If using a physical server, be sure to have a look at our Server hardware whitelist.
- It’s important for you to know the service account credential going to run the Qlik Sense Services. This should be done by an administrator. If it is not, see the instructions for how to carry out an installation without administrative permissions.
- Read the Release Notes of the version you are about to install or upgrade to.
In addition, if you are upgrading:
- If you are using other Qlik Products like Qlik NPrinting, Qlik GeoAnalytics, Qlik WebConnector, etc. it’s crucial to verify the Qlik Sense version you are upgrading to is compatible with these products.
- Test your upgrade in a test environment first. This will help you to understand the process. Then let have a user test the functional part of your platform (apps, feature, etc) in the new version.
- Most important! Backup of your environment. Learn more about Backups from qlik.com.
In addition, I can only encourage you to take a server backup or a virtual machine snapshot.
- You need to know the Superuser password of your Qlik Sense Repository Database (user is postgres). This should be the same password used during the database backup. If needed, it is possible to reset the PostgreSQL password.
Install or Upgrade – How do to it?
Once you have gathered all information and prepared your installation/upgrade, it’s time to proceed.
I‘m not able to give you better explanation than the steps provided on help.qlik.com, so I will attach the links below.
But, be sure to select the correct version top left of the window:
For a new installation
For an upgrade
Troubleshooting
Now the most interesting part: What to do if your installation/upgrade fails?
Well, first we need to find out the root cause and there is no better place for that than the logs.
Luckily, the installation and upgrade logs are stored in the same place which is the user temporary folder running the Qlik Sense installer. (By default: C:\Users\<Username>\AppData\Local\Temp)
Below is an example of a failed upgrade. Let’s try to understand what the files are for.
We can clearly see by sorting the files by Date modified that the installer failed on the service dispatcher and then started to rollback all the services that went through previously.
So, the log is helping us to find the root cause. In this case, it is the Qlik Sense Dispatcher.
Now that we know which logs we should look at, I will tell you what you should search for because these files can become very large.
Basically, if you search for “Return value 3” or “error code 1603” you will find the cause of the failed installation/upgrade.
Back to our example, here is what you will see:
In this case, the error is pretty explicit. Basically, it looks like an Antivirus blocked one of the PowerShell script to execute properly.
But all the above is provided as a guideline to find out the root cause. There will probably be error messages in those logs that are less explicit and in this case, I would highly recommend you to search this exact error message in our knowledge base. #QlikSupport is documenting every error messages identified during case’s investigation, so you will likely find it there.
Help Us Improve
Finally, I want to highlight that just before launching your installation/upgrade, I recommend ticking the box Help Us Improve. This will help us to potentially identify patterns in failure and improve our installer by making it more robust.
Thank you for reading my blog post and I really hope it helps you prepare for your next installation.
I’ll be watching for your questions, feedback or suggestions so please comment!
-
Sunburst Chart Demo
Sunburst Chart Demo AnyChart Sunburst charts are greatly useful for visualizing hierarchical data. Explore their major features in this demonstr... Show MoreSunburst Chart DemoAnyChartSunburst charts are greatly useful for visualizing hierarchical data. Explore their major features in this demonstration app powered by AnyChart's Sunburst Chart extension for Qlik Sense.Discoveries
Discover how sunburst charts can help you. Explore multiple ways of displaying hierarchies and measures, drill-down, flexible labels, custom colors, center content, HTML tooltips, and more.
Impact
Experience firsthand how an interactive sunburst chart can empower intuitive exploration of hierarchical data structures through a set of sliced concentric rings and how it can be tailored to specific needs.
Audience
Everyone looking to enable more efficient and insightful exploration of hierarchical datasets within their Qlik environment.
Data and advanced analytics
This app features sunburst visualizations powered by AnyChart's Sunburst Chart extension for Qlik Sense, using U.S. Census data for illustration.
-
Welcome back Blerim Emruli-Qlik Educator Ambassador for 2024!
Blerim has been teaching since 2007, he is a Senior Lecturer at Lund University in Sweden teaching Decision Support Systems for BSc, as well as two MS... Show MoreBlerim has been teaching since 2007, he is a Senior Lecturer at Lund University in Sweden teaching Decision Support Systems for BSc, as well as two MSc courses; Business Intelligence and Business and Artificial Intelligence. Throughout his time as an Educator Ambassador Blerim has done a lot to promote the program within his university, he has introduced many faculty members to Qlik which is now being used within the highly popular course MSc Data Analytics and Business Economics.
When talking about his courses Blerim says, “A distinctive feature of all these courses is that they help in addressing the need to educate a data and AI-literate generation (required by the business and public sector) by being grounded in solid theoretical foundations, addressing real-world projects and using practitioner-oriented tools.” This is one of the reasons why Blerim collaborates so closely with industry, students studying on his courses can expect to gain both theoretical knowledge and hands on experience with tools such as Qlik, “We use the Qlik software and online training on Qlik products, up-to-date demos, Qlik customer stories, and applicable self-paced courses. The latter allows me for a flipped classroom or blended learning format, which [was] immensely useful during the COVID-19 pandemic”.
Blerim found the Academic Program resources especially useful once he started teaching a blend of online and in person classes, and they helped him in moving towards a more modern way of teaching “Blended teaching and learning with flipped classroom methods should be here to stay. Students do not only learn in a classroom…Qlik provides us educators and students various resources for free, as well as short module-based courses. I could not have done the same here alone or even with a help of a colleague. We can be really cutting edge by embracing these new initiatives and connecting different elements in our courses in a form of guest lectures or industry-led ’learnathons’, not just by relying on textbooks of 20 years ago”.
One of the reasons Blerim does this is his belief that jobs and education go hand in hand: “Many of my students immediately or even before graduating are taking on roles in industry as BI analysts, developers etc. In particular, I'm very proud that many of the expat female course participants quickly get employed”.
When asked about the future of analytics and education Blerim believes that that future is in “Cloud-based and self-service platforms, such as Qlik sense Business, so that access to advanced analytics across organizations is democratized, this has dramatically increased the need for data literacy of students within higher education”.
Educators and students can get access to free Qlik software and training resources, qualifications and certifications by applying to the Academic Program today: qlik.com/academicprogram
-
Qlik Cloud 1月2月の新機能
管理者向けの新機能 新しい認定を取得 Qlikは下記の認定を更新、また新たに取得しました。 ISO 27001:2022 (Updated) ISO 27017:2015 (New) ISO 27018:2019 (New) IRAP Protected (New) AutoML アクセス... Show More管理者向けの新機能
新しい認定を取得
Qlikは下記の認定を更新、また新たに取得しました。
- ISO 27001:2022 (Updated)
- ISO 27017:2015 (New)
- ISO 27018:2019 (New)
- IRAP Protected (New)
AutoML アクセス制御
AutoML に関するユーザーの役割が追加され、AutoMLを使用するユーザーを限定することができます。。管理コンソールのユーザー>役割の変更から各ユーザーに設定できます。
Automl Experiment Contributor: ML 実験の作成と、および ML モデルを展開できるユーザー
Automl Deployment Contributor: ML 展開と予測を管理できるユーザー
どちらの役割も持たないユーザーは、AutoML リソースを表示できず、アクセスもできません。またAutoMLのアセットが存在するスペースの権限も必要です。
Qlik Datagateway – 直接アクセス 新バージョン
Direct Access Gateway 1.6.1、1.6.2、1.6.3 がリリースされました。多くの機能改善がされていますので、最新バージョンへのアップデートをお勧めします。
SAML IdP のサポート
Qlik Cloud の認証に、SAMLプロトコルを使用したIdPをご利用いただくことができます。
Qlik のカスタマーマネージドキー(CMK)の機能強化
カスタマーマネージドキー(CMK)は、AWSマルチリージョンキーをサポートし、使用するようになりました。AWSマルチリージョンキーを使用することで、プライマリーリージョンに障害が発生した場合でも、暗号化されたデータへのアクセスと処理を継続することができます。キーのレプリカを作成することで、バックアップリージョンのデータを復号化することができ、バックアップで暗号化されたデータは、復旧後にプライマリーリージョンで復号化することができます。
分析の新機能
キードライバー分析
アプリのシート上からキードライバー分析を実行すると、Qlik AutoMLのパワーを活用し、分析結果を左右する最も影響力のある要因を簡単に理解することができます。回帰分析と二項分類に対応しています。3月12日のTECH TALK でデモを交えてご紹介します。
【無料Webセミナー】どうしてそうなったのか?「結果」の「理由」を知るキードライバー分析
Direct Query のカスタム SQL
Direct Query は、データをメモリにインポートまたはロードせずに SQL データベースを読み取る機能です。データマネージャーを使用して、Direct Query のアプリを作成することができます。ロードスクリプトで、カスタム SQL ステートメントを使用することができるようになりました。変数やQlikの数式と組み合わせることができ、多くの可能性が広がります。これは、多くのお客様から求められていた新しい機能です。
管理スペースからアプリをエクスポート
管理スペースからアプリをエクスポートできるようになりました。ソース アプリにアクセスできないユーザーがアプリのバックアップ コピーを作成できます。これは、ソース アプリの削除や紛失が発生した場合に役立ちます。ただしデータを含めてエクスポートすることはできません。スペースの [所有者] または [管理可能] ロールが必要です。
表形式レポートをPDFに出力
表形式レポートを使用する場合、レポートファイルをPDFに出力することができるようになりました。
SAP ODP コネクタ
Qlik Cloud 分析に SAP ODPコネクターのサポートが加わりました。このコネクタはSAP Operational Data Provisioning (ODP)フレームワークに接続するもので、SAPユーザーにとって従来のSAPコネクタと比較して以下のような多くのメリットがあります。
- CDSビューとHANAビューへの容易なアクセス
- スタンドアローンのネットワークサービスを使用せずに、Extractor にアクセス可能
- SAP ランタイムライセンスで使用可能
- Qlik SAP Connectorライセンスを別途必要としない
- SAPトランスポートのインストールが不要なため、SAPマネージドクラウドシステムで有用
- Qlikの既存のSAPコネクタと比較して、パフォーマンスが最大25%向上
他にも、データ統合も含めて新機能の追加や改善がされています。
ヘルプの Qlik Cloud の新機能をご確認ください。また、2月20日のTECH TALK でもご紹介しています。
【無料Webセミナー】Qlik What's New - February 2024 リリースの新機能のご紹介

-
Canonical Date
A common situation when loading data into a Qlik document is that the data model contains several dates. For instance, in order data you often have ... Show MoreA common situation when loading data into a Qlik document is that the data model contains several dates. For instance, in order data you often have one order date, one required date and one shipped date.
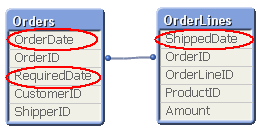
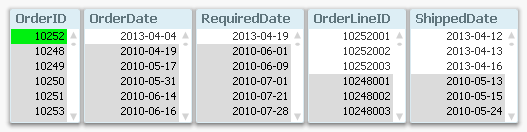
This means that one single order can have multiple dates; in my example one OrderDate, one RequiredDate and several ShippedDates - if the order is split into several shipments:
So, how would you link a master calendar to this?
Well, the question is incorrectly posed. You should not use one single master calendar for this. You should use several. You should create three master calendars.
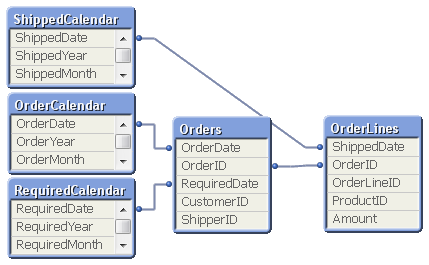
The reason is that the different dates are indeed different attributes, and you don’t want to treat them as the same date. By creating several master calendars, you will enable your users to make advanced selections like “orders placed in April but delivered in June”. See more on Why You sometimes should Load a Master Table several times.
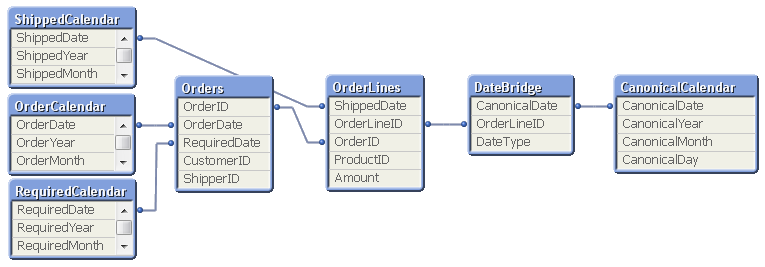
Your data model will then look like this:
But several different master calendars will not solve all problems. You can for instance not plot ordered amount and shipped amount in the same graph using a common time axis. For this you need a date that can represent all three dates – you need a Canonical Date. This is how you create it:
First you must find a table with a grain fine enough; a table where each record only has one value of each date type associated. In my example this would be the OrderLines table, since a specific order line uniquely defines all three dates. Compare this with the Orders table, where a specific order uniquely defines OrderDate and RequiredDate, but still can have several values in ShippedDate. The Orders table does not have a grain fine enough.
This table should link to a new table – a Date bridge – that lists all possible dates for each key value, i.e. a specific OrderLineID has three different canonical dates associated with it. Finally, you create a master calendar for the canonical date field.
You may need to use ApplyMap() to create this table, e.g. using the following script:
DateBridge:
Load
OrderLineID,
Applymap('OrderID2OrderDate',OrderID,Null()) as CanonicalDate,
'Order' as DateType
Resident OrderLines;Load
OrderLineID,
Applymap('OrderID2RequiredDate',OrderID,Null()) as CanonicalDate,
'Required' as DateType
Resident OrderLines;Load
OrderLineID,
ShippedDate as CanonicalDate,
'Shipped' as DateType
Resident OrderLines;If you now want to make a chart comparing ordered and shipped amounts, all you need to do is to create it using a canonical calendar field as dimension, and two expressions that contain Set Analysis expressions:
Sum( {$<DateType={'Order'}>} Amount )
Sum( {$<DateType={'Shipped'}>} Amount )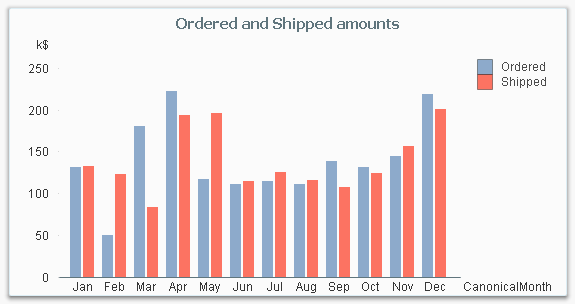
The canonical calendar fields are excellent to use as dimensions in charts, but are somewhat confusing when used for selections. For this, the fields from the standard calendars are often better.
Summary:
- Create a master calendar for each date. Use these for list boxes and selections.
- Create a canonical date with a canonical calendar. Use these fields as dimension in charts.
- Use the DateType field in a Set Expression in the charts.
A good alternative description of the same problem can be found here. Thank you, Rob, for inspiration and good discussions.

-
Special Event: Free Academic Program Webinar for Poland
Analytical thinking and big data are set to be the most in demand job skills by 2027. Get your students ready for this data driven workplace with f... Show MoreAnalytical thinking and big data are set to be the most in demand job skills by 2027. Get your students ready for this data driven workplace with free software, training and qualifications from the Qlik Academic Program. This webinar will give you an overview of Qlik, a demo of our market leading software Qlik Sense and information about the Qlik Academic Program. This webinar is exclusively for Polish university educators and will be led by Qlik experts and educators, Marcin Stawarz and Jacek Harazin.
A certified Qlik Sense expert with profound experience in data analysis and machine learning. Specializes in Business Intelligence and the application of machine learning in finance. Works as an academic teacher at the Faculty of Economic Sciences and Management at Nicolaus Copernicus University in Toruń, focusing on integrating theory with practice in teaching and research.
Data enthusiast, certified Qlik expert with experience in Business Intelligence, AI, and ML. Graduated from the University of Economics in Katowice, executed numerous BI projects. IT conference speaker, active at WSB Merito. Shares knowledge on: qlikblog.pl.
This webinar will be held on two dates:
Wednesday April 3 2024 at 11:00 CET - REGISTER HERE
Thursday April 4 2024 at 17:00 CET - REGISTER HERE
Webinarium programu akademickiego dla Polski
Myślenie analityczne i umiejętność pracy z dużymi zbiorami danych mają stać się najbardziej pożądanymi umiejętnościami na rynku pracy do roku 2027. Przygotuj swoich studentów na rzeczywistość opartą na danych, korzystając z darmowego oprogramowania, szkoleń i kwalifikacji oferowanych w ramach "The Qlik Academic Program". Zapraszamy na webinar, który zapewni Państwu przegląd możliwości Qlik, demonstrację naszego wiodącego na rynku oprogramowania Qlik Sense oraz informacje o programie akademickim Qlik. Webinar jest przeznaczony wyłącznie dla wykładowców oraz koordynatorów kierunków polskich szkół wyższych. Będzie prowadzony przez ekspertów i edukatorów Qlik: Marcin Stawarz i Jacek Harazin.
Certyfikowany ekspert Qlik Sense, z dużym doświadczeniem w analizie danych i uczeniu maszynowym. Specjalizacja w Business Intelligence i zastosowaniach uczenia maszynowego w finansach. Pracuje na stanowisku nauczyciela akademickiego na Wydziale Nauk Ekonomicznych i Zarządzania Uniwersytetu Mikołaja Kopernika w Toruniu, gdzie skupia się na łączeniu teorii z praktyką w nauczaniu i badaniach.
Pasjonat danych, certyfikowany ekspert Qlik z doświadczeniem w Business Intelligence, AI i ML. Absolwent UE w Katowicach, zrealizował liczne projekty BI. Prelegent IT, aktywny na WSB Merito, prowadzi qlikblog.pl.
Webinarium odbędzie się w dwóch terminach:
Środa 3 kwietnia 2024 r. o godz. 11:00 CET - ZAREJESTRUJ SIĘ TUTAJ
Czwartek 4 kwietnia 2024 r. o godz 17:00 CET - ZAREJESTRUJ SIĘ TUTAJ
To learn more about our Qlik Academic Program, go to qlik.com/academicprogram
-
Fiscal Year
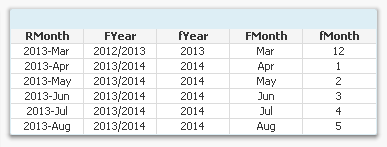
A fiscal year other than the calendar year implies a number of additional requirements in the QlikView app: The most obvious is that the year used in ... Show MoreA fiscal year other than the calendar year implies a number of additional requirements in the QlikView app: The most obvious is that the year used in all charts and reports must correspond to the fiscal year which runs over a different set of dates than the calendar year.
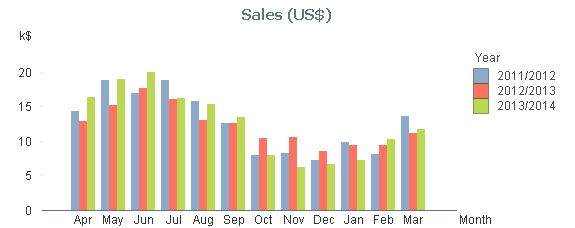
Further, the notation sometimes changes: You probably want to display years as ‘2012/2013’ instead of just the year number.
Also, other fields, e.g. Month and Week must be assigned to the fiscal year as well as the calendar year.
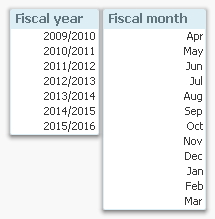
Finally, the sort order of field values changes in some cases. E.g. you want to sort the months using the first financial month as the first month: [Apr..Mar] instead of [Jan..Dec]. (Compare with the month order in the graph and the list box.)
There is a very simple way to achieve this in QlikView: Just add the necessary fields in the master calendar and use these in all situations where you need a calendar field. There are many ways that this can be done, but my suggested solution is the following:
- Create a variable that contains the month number of the first month of the fiscal year. Assuming that April is the first month of your fiscal year, this variable should get the value ‘4’.
- Create numeric values of the necessary fields. Usually the number of the fiscal year is defined by its end, so (again using April as the first month) April 2013 belongs to the fiscal year ‘2014’.
- Create dual values of the necessary fields.
The script for creating fiscal year and fiscal month then becomes:
Set vFM = 4 ; // First month of fiscal year
Calendar:
Load Dual(fYear-1 &'/'& fYear, fYear) as FYear, // Dual fiscal year
Dual(Month, fMonth) as FMonth, // Dual fiscal month
*;
Load Year + If(Month>=$(vFM), 1, 0) as fYear, // Numeric fiscal year
Mod(Month-$(vFM), 12)+1 as fMonth, // Numeric fiscal month
*;
Load Year(Date) as Year, // Your standard master calendar
Month(Date) as Month,
…
Other fields, like week, day, etc. can also be created in a similar way.
A comment on the field naming: In this script I use lowercase ‘f’ as prefix for the numeric values and uppercase ‘F’ for the dual values. In real life you may want to just have the dual fields (no numeric duplicates) and name these differently, e.g. just ‘Year’ and ‘Month’. If you do, you must also rename the original calendar year and calendar month accordingly.
The bottom line is anyway that you can solve this problem just by adding a couple of lines in you master calendar. No set analysis is needed. And no complex chart expressions are needed.
Simplicity.
- Create a variable that contains the month number of the first month of the fiscal year. Assuming that April is the first month of your fiscal year, this variable should get the value ‘4’.
-
Bed Invetory
Bed InvetoryGain Insights solution pvt ltdIts show the figure of bed inventory and how health care domain will workDiscoveriesWe deep drive into heal... Show MoreBed InvetoryGain Insights solution pvt ltdIts show the figure of bed inventory and how health care domain will workDiscoveries
We deep drive into health domain and how the will do bed inventory
Impact
It impacts the how we done the business by the end and how we are doing our business
Audience
count of beds
Data and advanced analytics
Graphs of visualization
-
Qlik Digest - February 2024
Welcome to the February Qlik Digest newsletter! We have some exciting news and updates this month, including the launch of Visionary Voices in AI, we... Show MoreWelcome to the February Qlik Digest newsletter! We have some exciting news and updates this month, including the launch of Visionary Voices in AI, webinars you may have missed, and more.
The Launch of Visionary Voices in AI
The buzz around AI continues to build. However, amongst all the noise is a definite feeling of information overload. So, it’s understandable that many data and analytics leaders remain uncertain of the technology’s real benefits and their road to adoption.
This is exactly why we’ve launched Visionary Voices in AI- an exclusive mini-series hosted by Ronald Van Loon. Each episode will explore practical insights and guidelines for data and analytics professionals, tackling the disconnect between AI hype and its real-world applications. Join Qlik customers, technology partners, industry leaders and experts as they share real life examples of AI-powered analytics, while emphasizing the crucial role of data quality for precise AI outcomes.
Episode 1 is available today, and you can join us on March 13th for the premiere of Visionary Voices Episode 2, where Qlik’s James Fisher & Nick Magnuson will discuss how you can take AI from trends to tangible business tool, from theory to reality.
One Community!
A few months ago, we took our first step into bringing the Qlik Community together by bringing Talend Ideas into the Qlik Community. On January 24, 2024, we took the next big step and brought over the Talend Community. This means all the members, knowledge articles, and discussions were migrated into the Qlik Community. This was a big effort and a huge success. You can read all the details in the Community News blog.
Catch Up On Webinars You May Have Missed!
We had 2 exciting webinars take place this month. Both are available on-demand now!
Qlik Product Roadmap Webinar: Data Integration and Quality
Do More with Qlik - Unlock the Power of Data: Part 2
Join Us For Qlik Connect 2024!
Excitement is building as we get closer to Qlik Connect 2024! Join us for 2+ days of learning, networking, and inspiration at Qlik Connect. It's an invaluable opportunity to explore how to apply the latest in data integration, quality, governance, analytics, and AI/ML in new and effective ways.
Customers and partners who register before March 29 will save $200!
Showcase your Data Literacy Skills!
Ready to show off your foundational Data Literacy Skills? We’ve got you covered with the brand-new Data Literacy Qualification Exam. Upon successfully passing the exam, you will earn a certificate of completion, a Credly digital badge for sharing on Social Sites and of course; bragging rights
-
More Reasons to Move to Qlik Cloud! Integrate with Application Automation, Gener...
Seeing is believing, this is the most Powerful BI you are ever gonna get and much more! 😉Create Qlik Cloud #analytics apps that integrate #generative... Show MoreSeeing is believing, this is the most Powerful BI you are ever gonna get and much more! 😉
Create Qlik Cloud #analytics apps that integrate #generativeai from #amazon #bedrock #anthropic as well as #ipaas (Integration Platform as a Service - Qlik Application Automation) to take action on your findings, quickly, easily.Reference - Qlik Nation "Ask Mike" Challenge:
https://lnkd.in/eQJRJdpX
-
Welcome Jacek Harazin - Qlik Educator Ambassador Class of 2024!
Jacek first encountered Qlik in October of 2014, when he participated in a Qlikview workshop held by a Qlik partner for those interested in learning m... Show MoreJacek first encountered Qlik in October of 2014, when he participated in a Qlikview workshop held by a Qlik partner for those interested in learning more about the product. At this point Jacek had 5 years experience in implementing analytical systems and controlling, but he was ready for a new career path. Through this workshop he started to understand the opportunities of working with Qlik, and by January 2015 he joined the Qlik partner company as a Qlik consultant. During this time he began to document his journey in an online blog (https://qlikblog.pl), all while earning Qlik certifications and reading through a 900 page Qlik view guide to solidify his knowledge, not once but twice! He soon started to train others before going on to teach at universities.
Jacek became more involved with Qlik and in 2017 his team won the first Qlik Hackathon in Poland by developing an app that monitored air pollution data and correlated it with tuberculosis incidence rates. This app then sent SMS alerts when pollution levels had exceeded safe limits. “I then got involved in organizing Qlik meetups in my region and speaking at conferences. I worked on various projects for automotive, construction, and pharmaceutical companies. I was continually uncovering the potential of the Qlik systems and I felt like I was learning something new every day”.
Jacek discovered the Qlik Academic Program in 2021 when the WSB University in Poznan invited him to join as a lecturer in Big Data and Engineering. “I discovered the Qlik Academic Program which offers free licenses and full access to educational materials to students. Within weeks I gained access and began my teaching adventure that still continues to this day”. He also extended his teaching responsibilities to other WSB Universities in Wrocław, Warsaw and Toruń, and even to the University of Warsaw and Łódź University of Technology. “Students are impressed by the capabilities of Qlik, often choosing it for their year end projects.”
While teaching Jacek has collaborated with Sii Poland to organize a contest among students for the most interesting Qlik project, with the prize being a paid internship at the company. Jacek says, “The winning student analyzed satellites orbiting Earth, using API sources, cleaning data, and creating a cohesive model with an Earth visualization. Students who work often talk about it in their companies, further showing Qlik's capabilities. This word-of-mouth marketing is invaluable.”
As well as teaching, Jacek also has a career at Merck Group as an analyst leading a team that supports Qlik analytics across 30 countries, with projects migrating to Qlik Cloud and utilizing AI technologies like the Insight Advisor, GPT API, chatbots, and converting analytics to audio format. A proud moment in Jacks career was in February 2023, “I became the first in the world to publish documentation on integrating a BI system with the GPT API engine, paving the way for further development and exploration of enhancing analytics with AI. I truly believe that today's educational programs must include these topics, as Qlik has great potential to implement them across various industries.” You can read Jacek's article on Qlik & OpenAI API here.
Jacek's goals for 2024 are to expand the list of universities participating in the Academic Program and encourage other developers to share their knowledge and practice. Outside of the classroom Jacek is awaiting the arrival of his third child along with “the joy and challenge of being father to two sons”. In his spare time, he enjoys exploring the nature of Poland, especially the mountains, and he actively promote mountain tourism and family hiking through a dedicated association.
We are pleased to have Jacek join our class of 2024 Academic Program Educator Ambassadors, to meet our other ambassadors go to qlik.com/academic-program/ambassadors and to learn more about our program visit qlik.com/academicprogram
-
Qlik Academic Program kicks off the Autumn term!
Over the past few weeks we have run a number of sessions for our Educators in Europe. At the end of September we went to the University of Lund in Swe... Show MoreOver the past few weeks we have run a number of sessions for our Educators in Europe. At the end of September we went to the University of Lund in Sweden to deliver a day of hands-on workshops to students studying Supply Chain Information Systems. The session was delivered in person by our Senior Software engineer - Stavros Orfanoudakis. This is a course that the Academic Program has run online workshops for before, so it was great to get back to presenting in person. The students took to Qlik Sense like pros and went far beyond the workshop guide by building additional visualizations and charts.
Our next trip was in Italy to the Università Ca' Foscari Venezia, where our Senior Presales Solution Architect – Lucia Grassi – delivered a workshop student at the Department of Management studying Business Economics and Management. The feedback was very positive from the students, and we hope to return for another session here in the future.
Last Friday Stavros Orfanoudakis returned to the University of Lund for a Qlik app demo session. This was a class for an educator who had heard great things about our previous workshops at Lund and was eager to have us speak to his students at the Department of Economics. The students enjoyed the session so much that it was extended by 30 minutes, and they were particularly interested in all the free training accessible to them through the Qlik Continuous Classroom.
We love having the opportunity to present Qlik and our Academic Program to students, and we are happy to run sessions, if and when our schedule allows, for members of our Academic Program. To learn more about joining the Academic Program, go to qlik.com/academicprogram
-
Technical Deep-dive Customer Churn App using AI, ML, and Automation in Qlik Clou...
@RoccoP_Qlik , @Ouadie and I provided an in-depth exploration of the technical backend processes involved in creating the Customer Churn Qlik Sense a... Show More@RoccoP_Qlik , @Ouadie and I provided an in-depth exploration of the technical backend processes involved in creating the Customer Churn Qlik Sense app showcased in Part 1:
https://youtu.be/JNRSwR47KvYSee Generative AI capabilities, seamless application automation integration, and robust machine learning using AutoML that powers the Customer Churn Application. This webinar unravels the behind-the-scenes magic that powers the application. Attendees can anticipate gaining valuable insights into the methodologies and technologies that contribute to enhanced predictability and data-driven decision-making.
Missed a previous session?
Do More Archive Playlist: https://www.youtube.com/playlist?list=PLW1uf5CQ_gSo8GzlcFKAjIxLfFETDECcK
Presentation (attached to this post)
-
Formula 1
Formule 1 2Foqus A simple dashboard checking out the new lay-out container with a formula 1 dataset. Discoveries Lay-outcontainter, butt... Show MoreFormule 12FoqusA simple dashboard checking out the new lay-out container with a formula 1 dataset.
Discoveries
Lay-outcontainter, buttons, text-images
Impact
Just exploring the world 🙂
Audience
For intern use
Data and advanced analytics
It's a first step to make better visual dashboards then we did before. Trying to make the world a better place with fancy dashboards.
-
Dimensions and Measures
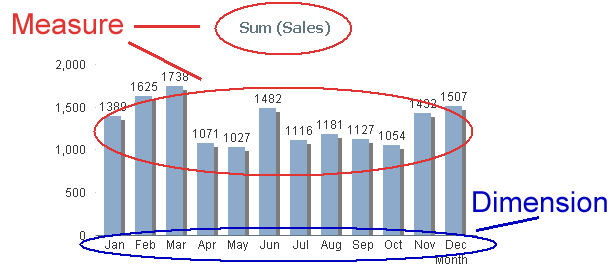
When you make a chart, you should start by asking yourself “What do I want to show?” The answer is usually Sales, Quantity or some other number. This ... Show MoreWhen you make a chart, you should start by asking yourself “What do I want to show?” The answer is usually Sales, Quantity or some other number. This is your Measure. In QlikView we have traditionally called this an “Expression”, but "Measure" is really the correct word. (There are expressions that are not measures, e.g. expressions used as labels, or as sort order definitions).
The second question you should ask yourself is “How many times should this be calculated? Per what do I want to show this measure?” The answer could be once per Month, per Customer, per Supplier or something similar. This is your Dimension.
In the bar chart below, you have one bar per month, and a general rule is that you always have one data point per distinct dimensional value: But depending on which visualization form you have chosen, it can be a row (in a table), a point (in a scatter chart) or a slice (in a pie chart).
Measures
A database or a QlikView app can consist of thousands or millions of records that each contains a small piece of information. A Measure is simply a calculation that can be made over multiple records in this data set. The calculation always returns one single value that summarizes all relevant records. This type of calculation is called an aggregation. There are several aggregation functions: Sum(), Count(), Min(), Max(), etc.
Examples:
- Each record contains a sales number. Then Sum(Sales) is a relevant measure that calculates the total sales value.
- Each record represents an order and “OrderID” is the key. Then Count(OrderID) is a relevant measure that calculates the number of orders.
A Measure can be used almost anywhere in QlikView: In charts, in text boxes, as label for objects, in gauges, etc. Typical measures are all KPI:s, Revenue, Number of orders, Performance, Cost, Quantity, Gross Margin, etc.
Once again: A Measure is always based on an aggregation. Always!
Dimensions
Contrary to Measures, dimensions are descriptive attributes – typically textual fields or discrete numbers. A dimension is always an array of distinct values and the measure will be calculated once per element in the array.
Example:
- The field “Customer” is used as dimension. The individual customers will then be listed and the measure will be calculated once per customer.
Typical dimensions are Customer, Product, Location, Supplier, Activity, Time, Color, Size, etc.
Like a For-Next loop
You can regard a chart like a For-Next loop: The Dimension is the loop variable; the calculations will be made once per dimensional value. So the Dimension determines how many rows/bars/points/slices the chart will have. The Measure is what is calculated in each loop.
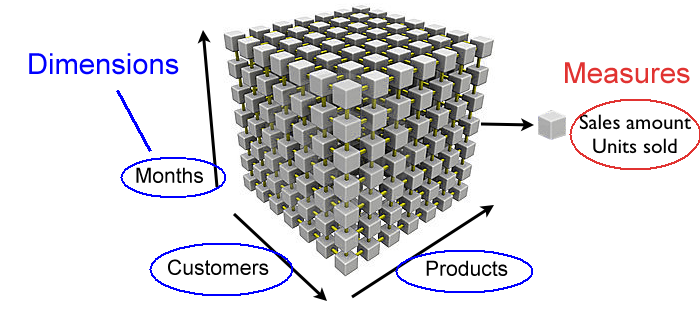
Several Dimensions
If you have two or three dimensions in a chart, the dimensional values no longer form an array, but instead a matrix or a cube, where the measures are calculated once per cell in the cube.
SQL
You can also compare a chart with an SQL SELECT statement. The GROUP BY symbols are the dimensions and the aggregations are the Measures.
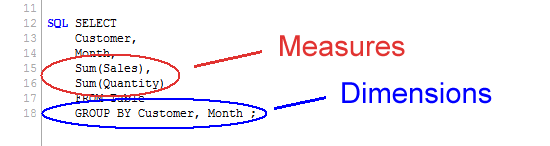
With this, I hope that the difference between Dimensions and Measures is a little clearer.
-
Monitoring Company Resource Consumption
Monitoring Company Resource Consumption Progesa Spa Our Qlik application serves as a powerful tool for monitoring water, energy, and heating con... Show MoreMonitoring Company Resource ConsumptionProgesa SpaOur Qlik application serves as a powerful tool for monitoring water, energy, and heating consumption in a corporate setting. In addition to providing a detailed cost analysis, it highlights our commitment to energy efficiency and responsible resource management.Discoveries
By analyzing data through the application, it is possible to identify consumption patterns that can help optimize resource allocation and reduce waste. The application can assist in evaluating the energy efficiency of business operations. Metrics and reports generated allow for identifying areas where improvements can be implemented to reduce costs and environmental impact.
Impact
By identifying and optimizing areas of energy and water consumption, the application can contribute to more efficient resource management, reducing operational costs associated with supplies. The application provides detailed data and reports that support informed decision-making regarding resource management.
Audience
Executives and operations managers can use the application to optimize resource usage, reduce operational costs, and enhance overall operational efficiency.
Data and advanced analytics
This application is crucial for a company's business as it enables daily monitoring and optimization of resource consumption, leading to cost reduction and improved sustainability practices.
-
Watch Q&A with Qlik: Qlik Replicate Best Practices!
Don't miss our previous Q&A with Qlik! Hear from our panel of experts to help you get the most out of your Qlik experience. SEE THE RECORDING HERE... Show MoreDon't miss our previous Q&A with Qlik! Hear from our panel of experts to help you get the most out of your Qlik experience.
Our experts held a Qlik Replicate Best Practices live webinar, answering all your questions about tips and recommendations for running Qlik Replicate implementations.

-
Welcome back Sumitra Pundlik - Qlik Educator Ambassador Class of 2024!
I feel pleased to introduce our new Educator Ambassador for 2024, Sumitra Pundlik from Marathwada Mitra Mandal College of Engineering, in the western ... Show MoreI feel pleased to introduce our new Educator Ambassador for 2024, Sumitra Pundlik from Marathwada Mitra Mandal College of Engineering, in the western Indian city of Pune. Sumitra has been an Educator since the last 15 years and is currently working as an Assistant Professor at Marathwada Mitra Mandal College of Engineering.
Sumitra teaches various subjects related to Data Analytics such as DBMS, Advanced DBMS, Machine Learning, Big Data Analytics. She has also taught R and Python Programming including different Business Intelligence and Data Analytics technologies including Qlik Sense.
Sumitra has been a member of the Qlik Academic Program since the last three years and has also successfully earned the Qlik Sense Business Analyst Qualification. After earning this qualification, she supported the learning journey of more than 400 students of different academic institutes like NMIMS,Hyderabad, VJIT Hyderabad,MIT ADT University and encouraged them to pursue Qlik Sense Business Analyst Qualifications.
According to her, “The Qlik Academic Program provides a great opportunity for students to access many online resources and different qualifications and certifications including Data Literacy, Qlik Sense Business Analyst and Qlik Sense Data Architect. The interactive material of the academic program helps students to excel in the field of data analytics”.
Further she adds, “I have been spreading awareness about the Qlik Academic Program and its benefits to other engineering colleges by conducting expert sessions via social media platforms”
Sumitra says, “Moving ahead, we are keen for internship and job opportunities for our students who have a good understanding of Qlik Sense and have earned the academic program qualifications.”
In Sumitra’s words, “Data literacy is my interest and I want to educate every data science enthusiast about the importance of data literacy.”
She feels it’s her mission to create more awareness about data analytics and encourage use of Qlik Sense. Data is the new fuel, and it is driving the current industry, she further adds.
When Sumitra is not teaching, she likes spending time with her son, Viraj. She is focusing on upskilling herself in recent trends, also taking care of her health and following a workout routine.
We are looking forward to working closely with Sumitra during her tenure as an ambassador and creating more links with Universities in Pune and rest of India.


.png")