Unlock a world of possibilities! Login now and discover the exclusive benefits awaiting you.
Analytics & AI
Forums for Qlik Analytic solutions. Ask questions, join discussions, find solutions, and access documentation and resources.
Data Integration & Quality
Forums for Qlik Data Integration solutions. Ask questions, join discussions, find solutions, and access documentation and resources
Explore Qlik Gallery
Qlik Gallery is meant to encourage Qlikkies everywhere to share their progress – from a first Qlik app – to a favorite Qlik app – and everything in-between.
Qlik Community
Get started on Qlik Community, find How-To documents, and join general non-product related discussions.
Qlik Resources
Direct links to other resources within the Qlik ecosystem. We suggest you bookmark this page.
Qlik Academic Program
Qlik gives qualified university students, educators, and researchers free Qlik software and resources to prepare students for the data-driven workplace.
Recent Blog Posts
-
Get to know the Engine API with Qixplorer
For those of us who want to go beyond the out-of-the-box capabilities of Qlik Sense and want to leverage the full potential of the platform to create ... Show MoreFor those of us who want to go beyond the out-of-the-box capabilities of Qlik Sense and want to leverage the full potential of the platform to create complex visualizations or satisfy custom development needs, understanding the Engine API is fundamental to taking advantage of what Qlik Sense hides under the hood.
The Qlik Engine API is a websocket protocol that uses JSON RPC 2.0 to communicate between the Qlik Associative Engine and clients. It works independently of any platform and programming language as long as it supports WebSockets and can parse JSON.
A great place to get your feet wet with trying out the Engine API is through Qixplorer (You might remember this as the Engine API Explorer on Qlik Managed). The tool that you can access at https://qixplorer.qlik.dev features a newly reimagined user interface and additional updates for a better experience.
Right off the bat, you can see that the format is divided into 4 main sections:
- Left: This is where you configure your connection to the tenant, pick the app, and browse through methods made available for your selected object.
- Middle: This is where you can see your requests and responses
- Bottom: This area is where you can construct and modify your requests and execute them
- Right: This is a neat feature that shows you inline documentation as you explore API methods
Other settings include a Light/Dark mode toggle at the top left, as well as a Layout toggle that lets you switch between the Original Layout (side by side request and response sections) or, my favorite, the Chat Layout.
How to use Qixplorer?
The first thing you would need to create a new connection to your Qlik Cloud tenant is a Web Integration ID. You can grab that by going to your tenant’s Management Console, under Web, Create a new integration and add https://qixplorer.qlik.dev as an origin.
Once you have the generated ID in hand, create a new connection on Qixplorer as shown below:
The next step is to choose the app you want to connect to from the second dropdown.
Once you select that, you will see that a first request and response have been made automatically. That’s the “OpenDoc” method, it is responsible for opening an app. More about it here.
Notice that a few items are now highlighted on the Left panel that you can start using - including the Doc and Global classes that can be expanded to reveal all the methods you can execute. You can also use the pre-defined Macros to list sheets, dimensions etc...
⚠️Before we continue, keep in mind that when using Qixplorer, you are performing changes directly on your apps, so when executing API methods to update or delete within Qixplorer, it will affect the objects in your apps.
Examples of using Qixplorer
- Using Macros to list sheets in our app
From the Macros dropdown, click on “ListSheets”.
Notice that the Request section at the bottom has our generated JSON with the methods needed to list sheets.
Click on Execute and view the JSON returned in the Response section.P.S: notice that two separate requests have been made by our Macro: CreateSessionObject and GetLayout.
- Using a method from Global
Let’s create an App in our tenant directly from Qixplorer.
First, select the “CreateApp” method from the Global dropdown.
Notice that the right panel has been populated with the inline documentation for our method. This makes it really convenient to view the definition and parameters at a glance.
Within the Request section that now contains the editable JSON, enter a name for the app we’re creating in the “qAppName” property.
Our request and response look like this:
{
  "handle": -1,
  "method": "CreateApp",
  "params": {
    "qLocale": "",
    "qLocalizedScriptMainSection": "",
    "qAppName": "test-qixplorer"
  }
}
You can check your tenant to view the newly created app:
- Using a method from Doc and GenericObject
Let’s retrieve the calculated data from a Table object in our app.
First, we need to get the object. Under ”Doc”, scroll down to GetObject and change the “qId” property to our Table's object id.
Now that we got the object, you can go to ”GenericObject”, then “Select Object” and click on table.
Next, scroll down to the “GetHyperCubeData” method under “GenericObject” and modify the JSON as follows to set the qHeight (number of rows to retrieve) and qWidth (number of columns)
{
  "handle": 2,
  "method": "GetHyperCubeData",
  "params": {
    "qPages": [
      {
        "qHeight": 1000,
        "qWidth": 5,
        "qTop": 0,
        "qLeft": 0
      }
    ],
    "qPath": "/qHyperCubeDef"
  }
}
Click on execute and examine the response:
The Engine API is without a doubt very powerful as it exposes methods that can be used to tap directly into the associative engine and manipulate complex data structures. Having a tool like Qixplorer is a great way to try out the API and learn more about all the methods available in a single place.
Let me know in the comments how you use Qixplorer on you end!
-
Qlik Cloud 日本リージョンへの移行方法
Qlik Cloud に 日本リージョンが開設されました。既存のテナントの移行をされる場合には、まずサポートにケース登録を行い、その後手動で移行する必要があります。 リージョンはテナントの初期設定時に選択できます。 リージョンごとに1テナントに制限されます。テナントの地域を変更する必要がある場合は... Show MoreQlik Cloud に 日本リージョンが開設されました。既存のテナントの移行をされる場合には、まずサポートにケース登録を行い、その後手動で移行する必要があります。
リージョンはテナントの初期設定時に選択できます。
リージョンごとに1テナントに制限されます。テナントの地域を変更する必要がある場合は、新しいテナントを作成する必要があります。既存のテナントをあるリージョンから別のリージョンに移行するには、下記の手順に従ってください。コンテンツの移行や移動は自動では行われません。すべての設定を新しいテナントで再作成し、新テナントにアプリをインポートする必要があります。
下記の手順に従ってください。
1.Qlikサポートにケース登録を行ってください。
連絡先と既存のテナント情報、移動先リージョンをお知らせください。既存のテナント情報は下記の手順で取得できます。
- Qlik Cloud にログインする
- 画面右上角のプロファイルアイコンをクリックする
- 「アプリについて」をクリックする
この依頼に基づき、サポートがライセンスを変更します。移行期間中に2つのテナントを使用したい場合はケース登録時にご依頼ください。基本的には30日間の並行稼働となります。
2.既存テナントからアプリケーションをエクスポートします。既存テナントのアプリケーションの変更は停止する必要があります。
3.サポートの指示に従って新テナントを作成し、設定を行います。
a. IdPを使用している場合は、既存テナントと同様の設定を行ってください。
IdP側でもテナントURLを更新する必要があります。ユーザー認証をテストして確認してください。
b. ユーザー資格の割り当てを行います。
c. スペースを作成します。
d. アプリをインポートします。
e. アラート、レポートサブスクリプション、リロードを設定します。
f. 必要に応じてカスタマイズについても設定を完了させてください。
エクステンションの管理
Webhook
ウェブ統合の管理
API キーの管理4.Qlik サポートに移行が完了したことをお知らせください。期間延長が必要な場合はサポートにご連絡ください。
手順については4月9日のTECH TALK でも詳しく解説します。
【無料Webセミナー】Qlik Cloud 日本リージョン開設!テナント作成と移行方法を解説
よくあるご質問
Q: 日本リージョンはどうすれば使用できますか?
A: テナント作成時の初期設定で Japan を選択すると、日本リージョンを使用することができます。Q: 日本リージョンのデータはどこに保存されますか?
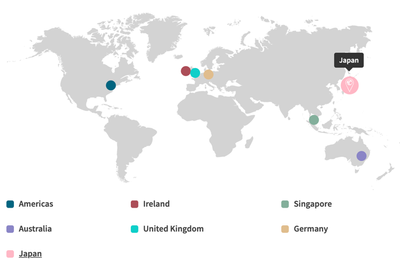
A: 東京と、大阪(バックアップ)に保存されます。下記を参照してください。
Qlik and Talend Subprocessors General Data Protection Regulation (GDPR) - Version 5.1 - February 2024Q: 既にQlik Cloud を使用していますが、日本リージョンへの変更は可能でしょうか?
A: 可能です。サポートにケース登録をし、テナントを移行する必要があります。上記を参照してください。Q: 既にQlik Cloud を使用していますが、日本リージョンへの移行は自動で行われるのでしょうか?
A: 手動ですべての設定を行う必要があります。上記を参照してください。Q: 既にQlik Cloud を使用していますが、日本リージョンへ変更する場合に契約の変更が必要でしょうか?
A: 契約の変更は不要です。Q: 既にQlik Cloud を使用していますが、日本リージョンへ変更する場合に料金は変わりますでしょうか?
A: 料金は変わりません。Q: 日本リージョンでも データ統合機能(QCDI)は使用できますか?
A: 使用できます。Q: 日本リージョンでもユーザーモデルもキャパシティモデルも選択できますか?
A: 選択できます。Q: 既存のテナントから 日本リージョンに移行する場合、テナントのURLは変わりますか?
A: 変わります。新しいURLでご利用ください。Q: 既存のテナントから 日本リージョンに移行する場合、並行稼働は認められるでしょうか?
A: サポートケース登録時に並行稼働のご要望をご記入ください。基本的には30日間は既存リージョンが使用できます。サポートから期限について連絡があります。Q: データゲートウェイを新環境に接続した場合、旧環境を閉じるまで引き続き旧環境でも使えるのでしょうか。A: データゲートウェイは、特定のテナントとのペアになりますので、移行にかぎらず、複数のテナントで同時に使うことはできません。適切なタイミングでの切り替えをお願いします。
Q: 既存テナントと新テナントで、Analyzer Capacity、アプリの自動化、レポーティングなどの消費量は引き継がれますか?並行稼働期間はどのようにカウントされますか?
A: 既存テナントと新テナントは同ライセンスですので、合算となります。Q: アジア圏のリージョン(オーストラリア/シンガポール)から日本リージョンに変更することで、レイテンシーがどの程度、改善されるかについて、情報はありますか。
A: レイテンシーに関してベンチマーキングとなる情報はございません。通常のAWSのリージョンのレイテンシーに依存すると思われます。Q: ケース登録時にいつから30日並行稼働希望といった形で指定できますか?(=新テナント作成日を指定できるか)
A: はい。指定していただくことができます。
-
March Qlik Digest
Welcome to the March Qlik Digest newsletter! We have some exciting news and updates this month, including upcoming webinars, updates on Tabular Repor... Show MoreWelcome to the March Qlik Digest newsletter! We have some exciting news and updates this month, including upcoming webinars, updates on Tabular Reporting, and training courses for Qlik Cloud!
Tabular Reporting in Qlik Cloud
One of the most requested features in Qlik Cloud Analytics is finally here: Tabular Reporting in Qlik Cloud Analytics!
“What is Tabular Reporting?” you may ask. To put it simply, a tabular report in a Qlik Sense app displays table-based data with chart images in an Excel template-defined structure.
Now, what does this mean for you and your business? With Tabular Reporting, report developers can unleash their creativity, crafting tailor-made, intricately detailed XLS or PDF documents infused with Qlik data and visualizations.
Exciting, we know!
For more information, and a quick dose of nostalgia, check out our new Tabular Reporting blog Keeping Tabs on Qlik Cloud Reporting and tune in on March 27th for our webinar series: ‘Do More with Qlik’ – Tabular Reporting for Nprinting Customers.
Looking to unlock big savings on Qlik Certifications?
Looking to up your data and analytics game? Qlik Connect (formerly, QlikWorld) has you covered. This year’s event offers 15 hands-on workshops and 17 certifications.
Register before March 29 to save $200. As an added bonus, all Qlik Connect attendees receive one free certification exam (up to $250 in value), with additional exams only $70 each (up to 72% discount).
Visionary Voices in AI On-Demand
Missed episode 2 of Visionary Voices, or interested in rewatching?
Stream the episode on demand
to hear Qlik’s James Fisher & Nick Magnuson discuss how you can take AI from trends to tangible business tool, from theory to reality.
Qlik Technical Workshops:
Join our live Qlik Technical Workshops to get hands-on guidance from our Adoption Specialists.
Bring your own Qlik Cloud instance and build alongside Qlik experts. We’ll cover the essentials, share step-by-step demos, and answer your questions along the way
Space is limited to ensure an interactive experience, so register today!
Cloud Migration Learning Plan:
Migrating to Qlik Cloud? Qlik has you covered with an in depth learning plan for both Qlik Sense Client-Managed as well as QlikView customers. These tools will assist your migration efforts and create a successful transition plan.
-
Welcome back Nassir Ibrahim -Qlik Educator Ambassador for 2024!
Nassir first became an educator ambassador in 2022 when he was a Lecturer in Technology Innovation at Birmingham City university. This year Nassir has... Show MoreNassir first became an educator ambassador in 2022 when he was a Lecturer in Technology Innovation at Birmingham City university. This year Nassir has been promoted and is now a Senior Lecturer in Business Analytics.
When Nassir started teaching in The Faculty of Computing, Engineering and Built Environment (CEBE), they typically used R Studio, Rapid Miner, Excel, SQL and Python for teaching and assessment.” I worked as part of a team that relied heavily on R Studio and saw the challenges faced by students first-hand when completing basic statistical analysis. The challenge translated into a poor student learning experience and was also reflected in lower-quality work being produced by students.”
Nassir was then promoted to become Module Lead and decided to switch from R Studio to Qlik Sense for the Final Year Data Intelligence module (now Business Intelligence). “Qlik Sense has been an excellent tool for teaching and assessment and students have taken to it very well. Recently students have had the opportunity to complete lab exercises and refreshed assessments using both Power BI and Qlik to equip them with practical experience using industry-standard tools. Having an industry mentor who utilizes both Qlik and Power BI in a senior business analytics role has informed my assessment design, lab exercises and pedagogy. Academia and Industry are not mutually exclusive and a fundamental challenge is addressing a perceived dichotomy that incorporates the differing interests of students, employers and academics. What unites these different actors is solving real-life problems effectively, together. I am empowered to continue integrating these actors as a Qlik ambassador, to successfully address the challenges of the modern day using analytics.”
Since we last introduced Nassir he has created and led new modules in Business Intelligence, Database Systems Development and managed a large course-wide Programming module utilising empirical industry-based case studies. He strongly encourages his students to study the courses on the Qlik Academic Program and earn certifications, “I have supported students with gaining Qlik certifications and encouraged students to promote their certification and badges on their CV's and LinkedIn profiles. Students have secured graduate roles at national firms and SME's that utilise Qlik”.
All of his support for his students is clearly paying off, not only have his students been securing graduate roles but his passion for his subject has also been recognised across the University. He has been shortlisted for the award of most inspiring lecturer in the Faculty for three consecutive years: 2021, 2022 and 2023.
Looking ahead to 2024 Nassir has a number of goals,” This year I’m supporting Knowledge Transfer Partnership (KTP) associates, Masters students and final year bachelor project students on research projects. I aim to support students and colleagues to produce publishable outputs and to disseminate knowledge created at both academic and industry conferences.“
Nassir is acutely aware of how important his own knowledge and development is too, “Continuous professional development is crucial and belonging to a community such as the Qlik ambassador team keeps me sharp. I am an active researcher and strive to practically demonstrate the effectiveness of how business analytics techniques can address industry challenges.” This is part of why he chose to reapply as an educator ambassador for 2024, the exchange of knowledge and experiences with fellow educator ambassadors,” Sharing knowledge is very rewarding and building competence to solve different business problems is stimulating. Obtaining and implementing the good practice learnt and exchanged with peer Qlik ambassadors is very valuable for assessment design and refining the pedagogy of my teaching teams to nurture industry ready graduates and postgraduates.”
His motivation to become an educator ambassador for a third time came from his commitment to lifelong learning, “Lifelong learning is extremely important and no matter how qualified one becomes you realize how little you know. There is no better feeling than helping others become better skilled and this requires self-investment. By becoming a Qlik Educator Ambassador, I am in a stronger position to help others develop their technical skillset and be part of an exciting community.”
We are thrilled to have Nassir back as an Educator Ambassador, if you want to learn more about how you can get access to Free Qlik software and learning resources to use in your teaching, go to qlik.com/academicprogram to learn more.
-
OAuth, OAuth, my kingdom for OAuth!
When King Richard III cried the immortal line: "A horse! A horse! My kingdom for a horse!" he was painfully aware of his vulnerability on the battlefi... Show MoreWhen King Richard III cried the immortal line: "A horse! A horse! My kingdom for a horse!" he was painfully aware of his vulnerability on the battlefield. While Shakespeare wasn’t thinking about cyber security back then, it’s just as much of a battleground today when it comes to fighting against the vulnerabilities of login credentials and protecting the keys to your ‘data castle’.
This is why Identity Access Management (IAM) is becoming so important for many organizations. IAM is a framework of business processes, policies and technologies used to manage the authentication and authorization of our digital identities.
One of the technologies that is fast becoming the de facto industry standard protocol for online authorization is OAuth 2.0. Largely because it allows organizations to authenticate across applications by providing access to the data via tokens without ever revealing the user’s identity or credentials.
When it comes to Data Integration, at Qlik, we understand the importance of security and the need for flexibility to match your IT requirements without compromise. Over various releases of our popular data replication solution Qlik Replicate, we've introduced the following flows to manage OAuth authorization when connecting to your required endpoints.
- Automated
- Semi-automated
- User Interactive
However, it is important to note that the flow is ultimately driven by the Identity Provider (IDP) and can be platform-dependent.
Automated
This is the preferred flow, using a Service Principal and is also known as “Machine-to-Machine” (M2M) or “Client Credentials Flow”. We recently introduced this automated flow in the latest release of Qlik Replicate for our customers using Databricks Lakehouse (Delta) and Databricks (Cloud Storage), without the need to provide information about the IDP. The flow works by requesting an OAuth token which is then used to login into Databricks instead of user credentials. The OAuth tokens have a defined lifespan, however, they are refreshed automatically, without user intervention required, while keeping the connection secure.
Semi-automated
An alternative flow is a semi-automated approach where the request for the token can be made outside of the UI and to the IDP directly. This is useful if you are managing authorization and authentication via APIs.
User Interactive
We’ve had to implement this flow for Snowflake due to how they support OAuth. This method requires manual user interaction in the Qlik Replicate UI. When configuring the Snowflake endpoint in Qlik Replicate you need to provide the information about the IDP to obtain the OAuth token, which is provided back to Qlik Replicate and used for authorization.
We've implemented these mechanisms to cater for different methods that the IDP or your organization may prefer to use to offer the best flexibility and choice.
The work we’ve done under the hood to deliver these methods paves the way for adding more endpoints that support OAuth, for example, we are looking at supporting PostgreSQL and Google BigQuery endpoints next, stay tuned for announcements with further releases.
Do you have an endpoint that you need to OAuth support for? – please submit your request via Ideation on Qlik Community. (authentication required - pun intended 😉)
What to learn more?
Read our online documentation for Qlik Replicate for both the Databricks and Snowflake endpoints
Snowflake (AWS / Azure / Google)
Setting up a Redirect URI for Snowflake
Databricks Lakehouse (Delta) / Databricks (Cloud Storage) / ODBC
-
Qlik Sense February 2024 (Client-Managed) now available!
Visualizations & Dashboards New Pivot Table The new Pivot table is here with a set of new features: Dimension headers Null value custom symbol, foreg... Show MoreVisualizations & Dashboards
New Pivot Table
The new Pivot table is here with a set of new features:
- Dimension headers
- Null value custom symbol, foreground, and background color
- Grid styling with width and color
- Font styling for size, color and family for headers and cell contents
- Totals styling and placement options: above or below
- Column width options, set to auto, in pixels or with percentage
- Scrollbars outside chart
- Interactive sort of dimensions
All the above are designed and added based on feedback from our users. The new Pivot table is launched in the Visualization bundle and will replace native pivot next year when additional features are added.
*Part of the visualizations bundleNew Layout Container
The Layout container is a new component in the Dashboard bundle. In the Layout container, charts can be placed in a freeform manner with or without a snapping grid. Charts can overlap, be stacked, and controlled with show conditions. The Layout container is highly versatile but especially useful for:
- Grouping charts together
- Combining charts into new visualizations
- Creating composite KPIs
- Grouping and reusing user controls and buttons
- Creating aesthetic pleasing dashboards
*Part of the visualizations bundle
New Borders and Shadows
As of today, most charts receive settings for borders and shadows. Charts inherit the border setting from the theme, but the border width and color setting can now be overridden and customized per chart. The border can play a big role in how your dashboard is perceived, use it wisely to achieve your goals, especially when layering multiple charts!
Chart shadow is a new property on charts, providing a shadow contour around the chart, with options for size and color. Shadows create a depth effect and can be used to highlight and make certain elements stand out.New Copy and Paste Style Option for Charts
This new chart feature makes life easier when creating a uniformed look across multiple charts! A simple copy and paste functionality now allow you to copy all a chart’s specific style attributes and paste those same attributes onto a separate chart, eliminating the need for tweaking each setting to ensure images are a match!
Styling Grid, Funnel & Sankey Charts
The Grid chart, Funnel chart, and the Sankey chart have been upgraded with the new property panel for styling. The styling includes general settings for title, subtitle, footnote, background, border and shadow and chart specific settings for axis and value labels.
Connectivity
Additional SaaS Application Connectors
We’re continuing to expand the connectivity of Qlik Cloud Data Integration with a new group of connectors that just got released. These connectors will enable you to gather business data from more applications that focus on the supply chain, ERP, CRM, and finance:
- Acumatica ERP
- GitHub
- QuickBooks
- SAP Ariba
- SAP Cloud for Customer
- SAP Fieldglass
- SAP SuccessFactors Payroll
- Stripe
- Zoho Books
- Zoho CRM
- Zoho Expense
- Zoho Inventory
We also updated the existing Oracle OPERA connector to support change data capture.
Like our previous connector releases, these connectors are Generally Available (GA), covered by our standard support policies and are tagged as Preview. If you haven’t already done so, you will need to contact your local support representative to activate the feature flag that enables all these connectors in your tenant. The preview tag and feature flag are there because these connectors do not cover all use cases and we want to make sure you have the best experience possible.Insight Advisor
Improved Tooltip for Period over Period Analysis
An improved tooltip is now available for Insight Advisor’s period over period analysis type feature, helping guide end-users to create a new calendar period for their Qlik Sense App (when needed).
Hub & Engine
Data window functions in engine load script
Customers can now perform complex calculations on their data tables in the Qlik load script to perform aggregation on different partitions without losing the granularity of their data. This functionality is commonly used in SQL and with many ML data preparation use cases.
Qlik Connect 2024
Join us this June 3-5 in Orlando, FL
Considering the move to SaaS? Hear how and why from Qlik and customers just like you that are taking advantage of Qlik Cloud Data Integration and Qlik Cloud Analytics today. Join us for 2+ days of learning, networking, and inspiration at Qlik Connect. Register by February 15th and save $300.
NOTE: Qlik Sense Client-Managed release cadence update:
The release cadence of Qlik Sense Enterprise will change from 4 quarterly releases a year to 2 releases a year. After this February 2024 release, moving forward, Qlik will deliver releases in May and November as the two major releases per year. As always, we will continue to deliver patches in between the major releases to ensure optimal performance. The reason for this release change is to streamline our development focus and optimize communications centered around two major releases per year.
-
Job-Sell
Job-SellSoevaa test sales app, using Figma to create a background.DiscoveriesA simple way to use a variable within the set analysys.ImpactA simple and... Show MoreJob-SellSoeva a test sales app, using Figma to create a background.
Discoveries
A simple way to use a variable within the set analysys.
Impact
A simple and beautiful view of sales and YOY comparison
Audience
Best-selling products, shipped products, total discounts per month.
Data and advanced analytics
Sum( {<Produto={"=rank(Sum(ValorLiquido),4)<=2"}>} ValorLiquido)
-
Dialing it in with Gauges
Within Qlik Sense, gauges are tied to a measure, with the data labeled a KPI. Gauges find their strength in displaying the progress toward a goal. As ... Show MoreWithin Qlik Sense, gauges are tied to a measure, with the data labeled a KPI. Gauges find their strength in displaying the progress toward a goal. As such, a major component of the gauge is found under ‘Appearance’ then ‘Presentation’ in the form of the ‘Range Limits’. Through range limits, users can provide the beginning and goal values of the gauge. Again, under ‘Presentation’, users can provide ‘limits’ within gauge, partitioning the gauge to show different subgoals or areas within the gauge, providing colors and values to track progress.
Gauges in Qlik are expressed in two different forms, the first being ‘Radial’ which displays the data as a dial, with the value being a needle that moves along the radius of the dial. The other form of gauge is the ‘Bar’. A rectangle that can be either horizontal or vertical, showing the maximum and minimum values on either side.
How can you use a gauge to visualize your data?
Let’s begin with the radial style of gauge. For this example, we can put ourselves into the mind of an district manager across a number of computer stores. Our computer stores sell a high number of graphics cards, and it is one of our main revenue drivers. As such, we need to make sure we always have a good amount in inventory. With Qlik Sense, we could tie the measure ‘Graphics Cards in Inventory’ to a gauge to visualize this item’s inventory value. In this example, you could associate different ranges within your gauge as good, order, and dangerously low, coloring them green, yellow, and red respectively. This example would look like this:
Now we have a visualize to show us the status of our inventory so we can make the appropriate actions to keep revenue where it needs to be. Also, with Qlik Sense, you can connect an alert to this chart so that you’ll be notified when your inventory dips into the yellow, and another when it drops to the red.
Now we’ll move onto the bar form of the gauge. For this example, we could put ourselves in the mind of a car sales manager. Our company has a promotion going saying that if we sell a total of a thousand cars during a certain amount of time throughout the district, we’ll get a bonus. With the bar chart, we can set the upper limit 1000, our measure to ‘Number of Cars Sold’ and our gauge is made. Now we can quickly view how close we are to our goal by the status of the cars sold. Our gauge should like this:
In this example we have also added markers throughout our journey to 100% of our goal. So now we can see how close we are to the $2,000, $5,000, and $10,000 bonuses. In other scenarios we could have money raised, contracts signed, anything that necessitates the tracking toward a goal.
These are only a few examples of how you could use a gauge. What are some examples you can think of where gauges may help you in visualizing your data?
-
Welcome to our new Educator Ambassador, Dr. K Kalaiselvi!
Dr. K. Kalaiselvi oversees courses in Data Analytics, specializing in Machine Learning, R and Python Programming, Data Visualization Technologies, and... Show MoreDr. K. Kalaiselvi oversees courses in Data Analytics, specializing in Machine Learning, R and Python Programming, Data Visualization Technologies, and Process Mining Technologies at Kristu Jayanti College. She also manages specialized and certification courses for students, complementing the regular curriculum.
Since 2019, Dr. K Kalaiselvi has been associated with the Qlik Academic Program and has also earned the Qlik Sense Business Analyst Qualification. By December 2023, approximately 300 students from Kristu Jayanti College achieved their qualifications in Qlik Sense Business Analyst and Data Literacy. Presently, 122 students are training for the Data Architect qualification. She says, “I’m thrilled that our institution was recognized as the Centre of Excellence in 2023, under the Qlik Academic Program”
According to Dr. K Kalaiselvi, she was drawn by the reputation of Qlik for providing comprehensive resources and tools geared towards learning data analytics and visualization. She therefore, decided to take further interest in the Qlik Academic Program. Kristu Jayanti recognizes the growing importance of new age skills in various industries, and this led to her interest in exploring further. The Qlik Academic Program stood out due to its commitment in offering free access to their powerful data analytics and visualization software, Qlik Sense along with free training and certifications.
Dr K Kalaiselvi believes that Qlik Academic Program's resources and learning materials will not only enhance understanding of data analytics and visualization but also contribute significantly to her students’ academic and professional growth. The opportunity to gain proficiency in using Qlik technologies is one that she finds both exciting and valuable, and she is enthusiastic about the potential it holds for her students’ future endeavors.
“The future of this engagement appears promising for me”, according to Dr. K Kalaiselvi. She further adds, “As students continue to benefit from Qlik Academic Program's training and certifications, they are likely to graduate with desirable skills in data analytics and visualization. This, in turn, could lead to increased job placements in roles such as Business Analysts, Data Scientists, and Data Visualization Designers. With a growing network and a reputation for producing skilled professionals, the engagement could contribute positively to both student careers and industry advancement”
Dr Kalaiselvi feels that her engagement with Qlik, especially after achieving the Qlik Sense Business Analyst certification, has deepened her understanding and appreciation for data literacy. She recognizes the critical role it plays in today's data-driven world, and she is eager to share this knowledge with others. Joining the academic program has offered her a structured platform to advocate for and elevate data literacy among students, preparing them for a future where data-informed decision-making is key. By becoming a Qlik Educator Ambassador, she aims to not only expand her own skills and understanding of Qlik technologies but also to stay at the forefront of BI and analytics innovations. It enables her to contribute to and learn from a like-minded community, further enriching the educational experiences she can offer and to foster a collaborative spirit among her students for global and cross-disciplinary projects.
At present, Dr. K Kalaiselvi is engaged in developing an AI chatbot project tailored for adolescents, aimed at addressing their psychological, physical, and academic inquiries. In addition to her teaching responsibilities, she has embarked on collaborative ventures with universities across Asia Pacific, concentrating on facilitating exchange programs and fostering project collaborations.
She feels thrilled and grateful to be involved in this collaboration with the Qlik Academic Program, as it allows her to learn and grow alongside her students.
We wish Dr. K Kalaiselvi all the best during her role as the Educator Ambassador!
Educators and students can get access to free Qlik software and training resources, qualifications and certifications by applying to the Academic Program today: qlik.com/academicprogram
-
Circular References
There are two Swedish car brands, Volvo and SAAB. Or, at least, there used to be... SAAB was made in Trollhättan and Volvo was – and still is – made i... Show MoreThere are two Swedish car brands, Volvo and SAAB. Or, at least, there used to be... SAAB was made in Trollhättan and Volvo was – and still is – made in Gothenburg.
Two fictive friends – Albert and Herbert – live in Trollhättan and Gothenburg, respectively. Albert drives a Volvo and Herbert drives a SAAB.
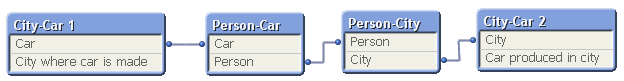
If the above information is stored in a tabular form, you get the following three tables:
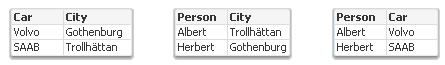
Logically, these tables form a circular reference: The first two tables are linked through City; the next two through Person; the last and the first through Car.
Further, the data forms an anomaly: Volvo implies Gothenburg; Gothenburg implies Herbert; and Herbert implies SAAB. Hence, Volvo implies SAAB – which doesn’t make sense. This means that you have ambiguous results from the logical inference - different results depending on whether you evaluate clockwise or counterclockwise.
If you load these tables into QlikView, the circular reference will be identified and you will get the following data model:
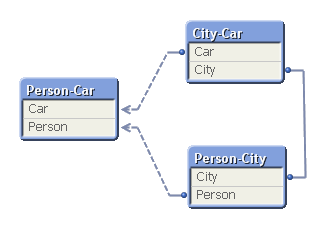
To avoid ambiguous results, QlikView marks one of the tables as “loosely coupled”, which means that the logical inference cannot propagate through this table. In the document properties you can decide which table to use as the loosely coupled table. You will get different results from the logical inference depending on which you choose.
So what did I do wrong? Why did I get a circular reference?
It is not always obvious why they occur, but when I encounter circular references I always look for fields that are used in several different roles at the same time. One obvious example is if you have a table listing external organizations and this table is used in several roles: as Customers, as Suppliers and as Shippers. If you load the table only once and link to all three foreign keys, you will most likely get a circular reference. You need to break the circular reference and the solution is of course to load the table several times, once for each role.
In the above data model you have a similar case. You can think of Car as “Car produced in the city” or “Car that our friend drives”. And you can think of City as “City where car is produced” or “City where our friend lives”. Again, you should break the circular reference by loading a table twice. One possible solution is the following:
In real life circular references are not as obvious as this one. I once encountered a data model with many tables where I at first could not figure out what to do, but after some analyzing, the problem boiled down to the interaction between three fields: Customers, Machines and Devices. A customer had bought one or several machines; a device could be connected to some of the machine types – but not to all; and a customer had bought some devices. Hence, the device field could have two roles: Devices that the customer actually had bought; and devices that would fit the machine that the customer had bought, i.e. devices that the customer potentially could buy. Two roles. The solution was to load the device table twice using different names.
Bottom line: Avoid circular references. But you probably already knew that…
Further reading on Qlik data modelling:

-
March Ahead: Qlik Cloud Data Integration's Latest Innovations
Data Movement Gateway Improvements As part of our continued commitment to ensure access to data is as seamless as possible, we have made a bunch of im... Show MoreData Movement Gateway Improvements
As part of our continued commitment to ensure access to data is as seamless as possible, we have made a bunch of improvements to the Data Movement Gateway to offer greater flexibility in deployment and supporting new sources and targets, database versions, and driver versions.
Deployment Options
It is now possible to install the Data Movement gateway on Red Hat 9.x* or on any corresponding and compatible Linux distribution. In addition to assisting in managing deployments a new notification feature has been introduced that will notify admins when a new gateway version is available.
New Data Sources and Target data platforms
We have really strong strategic technical and commercial partnerships with the technology vendors and we are continually improving our support of data movement options for databases and cloud data platforms.
Source Updates
- Azure Database for MySQL - Flexible Server – we have added this new data source which is supported via the existing MySQL source connector.
- MariaDB versions – we have expanded the support for MariaDB versions from 10.4 to 10.11 (previously 10.4 and 10.5)
Target Updates
- Azure Database for MySQL - Flexible Server – we have added this new target which is supported via the existing MySQL target connector.
- Databricks (Cloud Storage) – we have expanded our support to include Databricks 13.3 LTS and Serverless SQL Warehouse.
*Note: If you have an SAP HANA source that you want to use with a Data Movement gateway on Red Hat Linux 9.x, you must ensure you are using SAP HANA ODBC 64-bit Driver version 2.0.19 or later.
For information about how to upgrade to the latest version, see Upgrading the Data Movement gateway installation.
New Monitor Views
Monitor Views provide more granular visibility into task operations with the ability to create monitoring perspectives via various filtering options. This release introduces two new filters based on “Source Type” and “Data Movement Gateway”:
Source Type Filter
This filter creates monitor views that only show tasks for specific source technologies. With this new filter you can now focus on tasks with specific sources of interest, e.g. your tasks for SAP Landing or your SQL Server Replications.
Data Movement Gateway Filter
This filter creates a monitor view that lists all tasks for a specific gateway to simplify administration and management. It is really handy when an organization operates multiple gateways. For example, use the view to stop all tasks on a specific gateway before upgrading. Then, restart all gateway tasks once the upgrade is complete to ensure everything is operational.
Additional Data Landing Configurations
Qlik Cloud Data Integration landing tasks are the first step in transferring data into your cloud data warehouse. This release provides additional configuration options to control the behavior of the landing task and improve performance.
Control Tables
Control tables store additional operational information in the target data platform, such as landing status, suspended tables, and task history (including the number and volume of records processed during landing).
Error Handling Policies
Error handling policies allow you to control what happens when data truncation or other data errors occur. Choices include ignoring errors, suspending table updates, or stopping the task.
Data Preview
The new data preview feature displays the live data for the currently active task without leaving the Qlik Cloud Data Integration interface. The preview helps validate and shape the data while designing pipelines.
The data preview is currently available for physical tables and SQL transformations.
Physical tables behind logical datasets.
This shows the actual schema and data in the physical tables that logical datasets are mapped to.
Output of SQL transformations.
This allows previewing the result set of a SQL transformation while writing the query, even before any physical tables have been created. This is more powerful than just previewing source data.
Security Controls:
- Can be disabled at the tenant level completely.
- Can be enabled/disabled at the space level (currently same as project level). This allows enabling for dev/staging spaces but disabling for production spaces.
- Can be restricted at the user level - to allow only certain users to view data.
So, in summary, this new data preview feature is a huge benefit for users to validate data and shape transformations, with granular security controls to restrict access to production data. The initial phase focuses specifically on SQL transformations, providing strong value and thereby allowing data shaping entirely within Qlik Cloud Data Integration. Additional data preview capabilities will be rolled out progressively over 2024.
What Next?
All these updates are available from March 12th, 2024, check them out now in your Qlik Cloud Data Integration tenant. If you don't yet have access to Qlik Cloud, why not take a guided tour and experience the value it can bring by yourself here?
-
Central Telefônica
Central TelefônicahorusIn this application, we evaluate and analyze all calls passing through the telephone exchange. Being able to analyze the entrie... Show MoreCentral TelefônicahorusIn this application, we evaluate and analyze all calls passing through the telephone exchange. Being able to analyze the entries, exits, and the time of these calls. Evaluate the distribution by state, average time per call, by extension and other visions for any differente cases.Discoveries
With this application it was possible to analyze the call time of each extension, consequently checking the calls that actually had communication. The number of rejected calls is a very important finding for monitoring.
Impact
The number of rejected calls is a very important finding for monitoring. Call analysis by Brazilian state
Audience
telemarketing, telephony
Data and advanced analytics
Separation of calls into Extension, Mobile and Fixed. As we have several area codes and different sizes of telephone numbers, this was a challenge.
-
New AI/ML Area in Forums!
Hello Qlik Community! I’m back with a few more changes in the navigation! These changes were made to align more with Qlik and give AI/ML time in the s... Show MoreHello Qlik Community!
I’m back with a few more changes in the navigation! These changes were made to align more with Qlik and give AI/ML time in the spotlight!
Added AI/ML area
A section for AI/ML forums has been added. We have moved the Qlik AutoML and Insight Advisor forums to this area. You can find Integrations, Extensions & API’s (for Qlik Analytics) in this section or Analytics.
Renamed ‘New to Qlik Sense’ forum
The New to Qlik Sense forum has been renamed to Qlik Sense Analytics. When posting, be sure to use the appropriate label: either Client Managed for on prem or Qlik Cloud.
(Also, a cleanup of the labels on this forum is imminent.)
Reordered 'Discover'
Programs has been moved down the list, but it doesn’t mean it’s any less important! Make sure you’re subscribed to the Education or Academic areas for updates.
Please let us know if you have any questions about the changes using the comments below. We will be back soon with some more Qlik Community enhancements!
Your Qlik Community Admins,
Melissa, Sue, Jamie, and Nicole
-
Marching towards a Simplified Nav
Hello Qlik Community! Ah, February. We hardly knew ye. Let's March towards the enhancements and fixes for the month of February. NPrinting dropdowns... Show MoreHello Qlik Community!
Ah, February. We hardly knew ye. Let's March towards the enhancements and fixes for the month of February.
NPrinting dropdowns are back
The NPrinting forum has a couple more dropdowns to select Product and Version when posting.
Last Update and Created date timestamps
These two fields were potentially using different settings based on a user's profile. These timestamps are now using the preferred time zone for each user to ease any confusion.
Search icon slide out
A text window slides out when clicking the search icon.
And now… the pièce de résistance…
A Simplified Navigation
There are now only 4-5 options across the top of the navigation, depending on your user type. Let’s review each area and walk through the changes.
Forums
- Data Integration has been renamed to Data Integration & Quality
- The Analytics forums are now under Data Integration & Quality forums on the left side to match the order in which you use the tools
- The Job Board is now under Discover > Programs > Qlik Academic Program
- Removed More tab that included Job Board and Video Transcripts (which can still be found on the Resources page)
Support
- Ideation is now under Support! Same structure – new location!
- Learn to move to Qlik Cloud has been renamed to Move to Qlik Cloud
- View Licenses and Archived Cases is now under Support > Get Help
- Renamed the Product Downloads page to Download Qlik Products
Discover (Formally Learn)
- Job Board is now under Qlik Academic Program
- Blogs, Events and Qlik Gallery are now under Discover
- The Japan blog is now under Product
- Events has been renamed to Events & Webinar
- The Events & Webinar page is now called Global Events
- The two different categories (Webinar & In-person and Expert Led) have been condensed into one category
- The Qlik Gallery page has a new name: Explore Qlik Gallery
The Partners area (only visible to Partners) is unchanged and of course, the Greenway is still available to learn how to engage more with Qlik.
This is just the first step in simplifying the navigation. We have more simplification coming in the next few months. Let us know what you think about the changes in the comments below.
Your Qlik Community Admins,
Melissa, Sue, Jamie and Nicole
@Melissa_Potvin @Sue_Macaluso @Jamie_Gregory @nicole_ulloa
-
Welcome Priscila Papazissis-Qlik Educator Ambassador for 2024!
Priscila started using Qlik for her work in 2013, and in 2016 she began teaching at Pontifícia Universidade Católica de Minas Gerais in Brazil, on th... Show MorePriscila started using Qlik for her work in 2013, and in 2016 she began teaching at Pontifícia Universidade Católica de Minas Gerais in Brazil, on the Post Graduation courses, “I decided to use Qlik as the platform to help the students to understand in a practical way how to model data warehouses using the concepts of the star schema. Qlik is used showing the star schemas and how this kind of data model can be transformed in a dashboard full of information to potentially take better and faster decisions.”
Priscillas course is all about data warehouse modelling, when she started teaching, she thought, “it's not very interesting to create a conceptual model without understanding in a practical way how it will be used in the future." I understood that to show the conceptual model, [if I] show data about that model and use the data visually, the students could understand more about how to build good data products and try to use it in their day by day business.” Priscila knew from her professional life that Qlik could do this very simply, so she chose it as the tool for her course.
Pricilla started by using Qlikview with her students then in 2018 she moved onto Qlik Sense Cloud and began to incorporate data literacy concepts too, “In 2018 I started studying about the concepts of Data Literacy, and when I discovered that Qlik had this program too, some of the classes were built to show the students that they can count on this program to know more about how to deal with data in a better way.”
With the inclusion of the Academic Program in her teaching, Priscila has seen her students achieve great professional success, “As I am a leader in the companies I have been working for since 2017, I already hired 3 of my post-graduation students after they finished the courses. But I believe that many of my other students have been hired because of the competences they acquire during this post graduation.”
In 2024 Priscila hopes to spread Data Literacy further, using more the materials Qlik makes available. “I plan to give more examples using Qlik Sense Cloud, using the concepts of AUTO ML to give more robustness to the knowledge students of 2024 need to make a difference in their careers, as we are in the AI Era.”
“I believe we will face many changes in 2, 3 years in data industry. With the spread of AI practices, both traditional AI and Generative AI, every employee, in business areas or technology areas must understand how data can help to do more with less, to get some operational efficiency through the use of data and how to help to increase revenue and shrink the costs.”
When Priscila isn’t teaching, she’s busy managing an analytics team at a large company in Brazil. Outside of work and teaching she can be found travelling, visiting the beach and enjoying nature with her husband, daughter and stepson. As well as visiting the cinema and enjoying dinners out together.
During her year as Educator Ambassador, she hopes to make new friends and understand how her fellow educator ambassadors are using Qlik in their universities as well as have the opportunity to present about the program and her teaching. Priscila hopes to learn even more about Qlik and how can be used to better educate students on data analytics.
Educators and students can get access to free Qlik software and training resources, qualifications and certifications by applying to the Academic Program today: qlik.com/academicprogram
-
Making a Multilingual Qlik Sense App
A colleague of mine had translated two demos from the Demo Site to Japanese and wanted to know if we could post them on the Demo Site alongside the En... Show MoreA colleague of mine had translated two demos from the Demo Site to Japanese and wanted to know if we could post them on the Demo Site alongside the English versions. We decided that it would be best to combine the English and Japanese versions into one multilingual Qlik Sense app making it easier for us to add additional languages to the app as needed. It was an easy process and required only a few steps:
- Create a translation sheet with all the languages that will be available in the app
- Update the script to add a table of the translations and a list of the languages available in the app
- Add a Language filter pane to every sheet in the app that allows only one selected value
- Update sheet names, chart titles, subtitles and labels with an expression that will display the text in the selected language
Create Translation Sheet
To begin the process of making a demo multilingual, I created an Excel file with all the languages that are to be included in the app. Below is a snippet of the worksheet. The first column, Index, has a unique value which will be used in the charts and expressions to indicate what data should be displayed. The second and third columns are the languages to be used in the app. An additional column can be added for additional languages that need to be added to the app. In this scenario, I entered all the English text (sheet names, chart titles and subtitles, labels and text) and then using the Japanese version of the app, I entered the respective Japanese text. If I did not have the Japanese version of the app, I would have shared the Excel file with someone who could enter the Japanese translations for me. Preparing the Excel file in this format makes it easy to add additional languages to the app without having to update the QVF.
Snippet of Excel translation sheet
Update the Script
Once the translation sheet was created, it needed to be loaded into the data model. The script below is what I added to the demo.
On line 1, the HidePrefix system variable is used to hide all fields that begin with “#.” Starting on line 3, the Excel file is loaded. Once it is loaded, the vLanguage variable is set to the expression “=Minstring(#LANGUAGE).” This is an important step and we will take a closer look at this when we update the front-end. On line 13, the languages from the Excel file are loaded - users can select the language they would like to view from this list. These languages are then stored in the #LANGUAGE field which will be hidden from the user (since it starts with “#”).
Add Language Filter
One each sheet in the app, I added a Language filter pane using the dimension #LANGUAGE that was created in the script. Once the script is reloaded with the HidePrefix variable, the #LANGUAGE field will not be visible, but you can still use it as the dimension in the Language filter pane. I needed to see the field temporarily so I commented out the HidePrefix line in the script and reloaded so I could change a setting on the field. I only want the user to be able to select one Language at a time, so I needed to check the “Always one selected value” checkbox in the Field settings of the #LANGUAGE field. (Right click on the #LANGUAGE field and select Field settings to see the window below).
Field settings dialog window
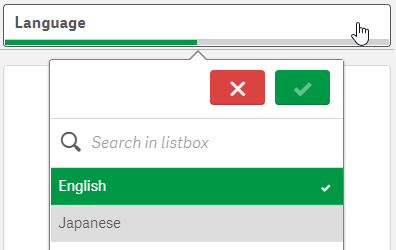
Once my settings are saved, I uncommented the HidePrefix line and reloaded the app to hide the #LANGUAGE field again. The filter pane will look like this (image below) and only one language can be selected at any given time. When a language is selected, the vLanguage variable (that was created in the script) will store the language. This variable is used later when updating the text in the UI.
Language filter pane
Update Front-End
Now the last step is to update everything in the app that should be translated. In this scenario, I updated sheet names, chart titles and subtitles, chart labels, KPI text and text on the sheets. Here is an example of how I updated the title of the Language filter pane. In the title field, I entered:
In the snippet below from the Excel translation sheet, the Index is 64 for the text “Language” which is why I used it in the expression above for the title of the Language filter pane. This expression will return either the English or Japanese translation for Language depending on the value of the variable vLanguage.
Snippet from Excel translation sheet
Another piece of information I would like to share is how I handled Text & image objects that needed to be translated. In the screenshot below, there is heading text and body text that have 2 different formats (font size and font color).
To handle this, I created two variables, one for the heading and one for the body and in the variables, I stored the translation expression.
This way, I was able to not only translate the text but format the text in a single Text & image chart two different ways.
As you can see, it is easy to make a Qlik Sense app multilingual and it is easy to update the app with additional languages as needed. Sales, Customer Experience & Churn and Supply Chain – Inventory & Product Availability are the two demos that were made multilingual. Check them out and switch between the languages to see the final results. If you are interested in doing this in QlikView, check out Chuck Bannon’s blog on this topic as well as making the data multilingual in a QlikView app.
Thanks,
Jennell
-
【開催報告】Qlik アドボケイトミートアップ
Qlik アドボケイトとは、Qlik をこよなく愛し、その使い方を極め、ビジネスに活用して成果を上げ、その良さを社内外に広めていただいているエバンジェリストの集まりです。日本ではすでに 50名ほどの方がアドボケイトとして活躍されています。 今年最初のアドボケイトミートアップが、Qlik Lumina... Show MoreQlik アドボケイトとは、Qlik をこよなく愛し、その使い方を極め、ビジネスに活用して成果を上げ、その良さを社内外に広めていただいているエバンジェリストの集まりです。日本ではすでに 50名ほどの方がアドボケイトとして活躍されています。
今年最初のアドボケイトミートアップが、Qlik Luminary の萬様と 4名のアドボケイト幹事メンバーを中心にオンラインで開催されました。
はじめに Qlik Luminary とアドボケイトに新たに就任されたメンバーの紹介があり、続いて3つの部屋に分かれてのディスカッションとなりました。ここではそれぞれが最近興味を持っていることや、ミートアップで今後取り上げたいトピックなどについての活発な意見交換が行われました。
AI、DWH、QlikView移行、Insight Advisor、ロードスクリプト、Chat GPT、セキュリティ、人材教育、日本リージョンなど様々なキーワードが飛び交いました。また、「AutoML に魅力を感じているから SaaS に移行したい」「経営陣の利用促進が課題」などの声も聞かれました。今回の内容についてあらためて幹事メンバーで検討し、ご要望の多かったものを今後のユーザーミートアップ等で取り上げていく予定です。ぜひご期待ください。
-
WhatsApp Automation Integration for Qlik Application Automation
WhatsApp Automation Integration for Qlik Application AutomationDataGlow ITWhatsApp is missing as a native delivery target from Qlik Application Automa... Show MoreWhatsApp Automation Integration for Qlik Application AutomationDataGlow ITWhatsApp is missing as a native delivery target from Qlik Application Automation. DataGlow IT have engineered a process to allow output WhatsApp as an alternative to delivery via Teams, Slack or Email. Utilising WhatsApp as a delivery target opens up multiple use cases for Customer and Consumer data delivery. Furthermore, there also exists the ability to have a configurable conversation via WhatsApp, optionally utilising further 2 way interactions with Qlik Application Automation.Discoveries
Share data from Qlik outside of the standard business delivery systems such as Teams, Slack and Email. Have conversations with your
Impact
Governed conversations, data and updates can now be shared to both Customers and Colleagues via WhatsApp, enabling them delivery and key data points from Qlik without needing Qlik licensing, or corporate comms infrastructure such as Teams or SharePoint.
Audience
Ideal for rolling out updates for Customers to WhatsApp directly from Qlik. Examples include delivering order status updates, surveys and regular KPI delivery.
Data and advanced analytics
Gather ultra-responsive feedback from clients and colleagues via a native and frequently used platform in WhatsApp.
-
Troubleshooting your Qlik Sense Installation or Upgrade
Qlik Sense may end up experiencing issues during an installation or an upgrade, even if you’ve already tested the same process in a different environ... Show MoreQlik Sense may end up experiencing issues during an installation or an upgrade, even if you’ve already tested the same process in a different environment. Those problems can be time consuming and frustrating to resolve, so I am going to give you some tips on how to accomplish a successful install/upgrade from scratch, and how to troubleshoot an issue, should something go wrong.
Here is what we will talk about
- Preparation and Best Practices
- Install or Upgrade – How to do it?
- Troubleshooting
Preparation and Best Practices
To prevent any unpleasant surprises, an installation or an upgrade requires a bit of preparation.
This will ensure that the installer completes on its first try and that you can access the platform afterwards. It also allows for a better understanding and control of your system.
Below are a few key points to check before installing or upgrading Qlik Sense:
- Make sure your environment follows at least the minimum requirements for the version of Qlik Sense you wish to install or upgrade to. This includes Operating System version, hardware requirements, disk space, type of storage, ports, etc. This information is available on qlik.com. (make sure you select the right version top left of the screen)
- If you are running an Antivirus or any software scanning your machine, be sure to follow our best practice
- If possible, try to get a dedicated machine to ensure no other software will fight for ports, resources, files…
- If using a virtual machine, be sure to follow our best practices.
- If using a physical server, be sure to have a look at our Server hardware whitelist.
- It’s important for you to know the service account credential going to run the Qlik Sense Services. This should be done by an administrator. If it is not, see the instructions for how to carry out an installation without administrative permissions.
- Read the Release Notes of the version you are about to install or upgrade to.
In addition, if you are upgrading:
- If you are using other Qlik Products like Qlik NPrinting, Qlik GeoAnalytics, Qlik WebConnector, etc. it’s crucial to verify the Qlik Sense version you are upgrading to is compatible with these products.
- Test your upgrade in a test environment first. This will help you to understand the process. Then let have a user test the functional part of your platform (apps, feature, etc) in the new version.
- Most important! Backup of your environment. Learn more about Backups from qlik.com.
In addition, I can only encourage you to take a server backup or a virtual machine snapshot.
- You need to know the Superuser password of your Qlik Sense Repository Database (user is postgres). This should be the same password used during the database backup. If needed, it is possible to reset the PostgreSQL password.
Install or Upgrade – How do to it?
Once you have gathered all information and prepared your installation/upgrade, it’s time to proceed.
I‘m not able to give you better explanation than the steps provided on help.qlik.com, so I will attach the links below.
But, be sure to select the correct version top left of the window:
For a new installation
For an upgrade
Troubleshooting
Now the most interesting part: What to do if your installation/upgrade fails?
Well, first we need to find out the root cause and there is no better place for that than the logs.
Luckily, the installation and upgrade logs are stored in the same place which is the user temporary folder running the Qlik Sense installer. (By default: C:\Users\<Username>\AppData\Local\Temp)
Below is an example of a failed upgrade. Let’s try to understand what the files are for.
We can clearly see by sorting the files by Date modified that the installer failed on the service dispatcher and then started to rollback all the services that went through previously.
So, the log is helping us to find the root cause. In this case, it is the Qlik Sense Dispatcher.
Now that we know which logs we should look at, I will tell you what you should search for because these files can become very large.
Basically, if you search for “Return value 3” or “error code 1603” you will find the cause of the failed installation/upgrade.
Back to our example, here is what you will see:
In this case, the error is pretty explicit. Basically, it looks like an Antivirus blocked one of the PowerShell script to execute properly.
But all the above is provided as a guideline to find out the root cause. There will probably be error messages in those logs that are less explicit and in this case, I would highly recommend you to search this exact error message in our knowledge base. #QlikSupport is documenting every error messages identified during case’s investigation, so you will likely find it there.
Help Us Improve
Finally, I want to highlight that just before launching your installation/upgrade, I recommend ticking the box Help Us Improve. This will help us to potentially identify patterns in failure and improve our installer by making it more robust.
Thank you for reading my blog post and I really hope it helps you prepare for your next installation.
I’ll be watching for your questions, feedback or suggestions so please comment!
-
Sunburst Chart Demo
Sunburst Chart Demo AnyChart Sunburst charts are greatly useful for visualizing hierarchical data. Explore their major features in this demonstr... Show MoreSunburst Chart DemoAnyChartSunburst charts are greatly useful for visualizing hierarchical data. Explore their major features in this demonstration app powered by AnyChart's Sunburst Chart extension for Qlik Sense.Discoveries
Discover how sunburst charts can help you. Explore multiple ways of displaying hierarchies and measures, drill-down, flexible labels, custom colors, center content, HTML tooltips, and more.
Impact
Experience firsthand how an interactive sunburst chart can empower intuitive exploration of hierarchical data structures through a set of sliced concentric rings and how it can be tailored to specific needs.
Audience
Everyone looking to enable more efficient and insightful exploration of hierarchical datasets within their Qlik environment.
Data and advanced analytics
This app features sunburst visualizations powered by AnyChart's Sunburst Chart extension for Qlik Sense, using U.S. Census data for illustration.


.png")

.png")