Unlock a world of possibilities! Login now and discover the exclusive benefits awaiting you.
This forum is where any logged-in member can create a knowledge article.
Recent Documents
-
Database Design for Qlik Analytics consumption
Qlik Cloud Analytics has a very powerful and easy to use data loading and transformation framework. This includes no-code data flows and Qlik scriptin... Show MoreQlik Cloud Analytics has a very powerful and easy to use data loading and transformation framework. This includes no-code data flows and Qlik scripting for advanced transformations. However, there are times when a customer may prefer to handle these transformations as much as possible outside of Qlik Analytics. Maybe the data is being used by Multiple Qlik Analytics environments, in a multi-tenant or hybrid architecture. Or maybe the data set needs to be consumed by other tools in addition to Qlik Analytics. You may also be looking to provide ready to use tables for Self-service analytics. In these situations, it makes sense to move any logic earlier in the lifecycle to avoid duplication and so all tools can benefit from the transformations.
The aim of this guide is to provide some recommendations on how to model your database for minimal transformations, or transformation-free consumption by Qlik Analytics. We cover our top ten recommendations, that if followed reduce, if not eliminate the need for extensive transformations within your Qlik analytics applications. While some of these recommendations assume a database as the data source, most are applicable across all data sources.There are many powerful tools in Qlik’s Data Integration portfolio that can be used to achieve this, such as Talend Studio, Qlik Talend Data Integration or Qlik Compose. Qlik Talend Data Integration can even be used to replicate tables to QVDs in Qlik Cloud using Change Data Capture (CDC). For more information on these solutions, see Data Integration and Quality. However, this document will focus on the end goals, rather than the tools used to achieve this.
1. Use RDBMS views
I am going to start with what is a somewhat controversial, but I believe necessary step for many organisations that wish to minimise downstream transformations. Views in an RDBMS allow use to encapsulate all the other changes we will need to make into a virtual table than we can simply read from our Qlik Analytics app. There are a few assumptions behind this approach though that if not true may render this unnecessary or undesirable. These assumptions are:
- The data resides in an RDBMS. Obviously if the data source is a flat file, rest connection or other Non-RDBMS source this is not an option.
- An ETL/ELT tool is not desirable or not an option. Some organisations may prefer to use a tool to physically transform the data. In this case views would not be needed.
- SQL skills are stronger and/or more readily available than Qlik scripting in your organisation. If you don't have the skills to do this, then it may make more sense to do this in Qlik.
2. Exclude columns not relevant for analytics
Often when building a data warehouse, data lake or Lakehouse we tend to include all possible columns and data so it is available at a later data to meet changing requirements. However pulling this data into a Qlik Sense app is not recommended unless there is a use for it. This is because Qlik Analytics uses a very powerful in-memory associative model to manage your data and bringing unused data into memory will have a performance impact.
3. Prefix standardized columns with the table name (e.g. last-modified)
It is quite common for tables in databases to include standardised columns. For example: CreatedBy, CreatedDate, etc. These columns are useful for organisational governance and audit requirements, but will cause problems in Qlik Analytics as Qlik will associate tables based on the identically named columns. Assuming you can not exclude the columns, renaming them e.g. myTable_CreatedBy, myTable_CreatedDate, etc. will avoid this issue.
4. Use unique single column primary keys where possible to avoid synthetic keys.
Qlik does not support composite (multi-column) keys in the same way databases do. When Qlik encounters a multi-column key it creates a synthetic key based on all the possible values for the keys. Synthetic keys use extra memory and can impact performance, as well as increasing the complexity of the analytics application. They are often not required and are due to factors such as standardised names (see #3). If there is not a natural key, you may be better to use an Autonumber or guid function to create a unique key. See Synthetic keys for more information.
5. Use the same naming convention for primary & foreign keys
Closely related to #4, Qlik expects primary and foreign key columns to have the same name. So if your primary key is person.id and your foreign key is role.person-id they will not join by default. The solution is to rename person.id to person.person-id.
6. De-normalise before if possible
There are no benefits from a highly normalised data model in Qlik. Qlik stores values in symbol tables so there isn't much extra data storage required for denormalised tables and extra joins impact performance. Therefore denormalising before it reaches Qlik removes the complexity of having to do this afterwards.
7. Use Star schemas if possible, snowflake if not
Closely related to #6, Qlik Analytics performs best against a Star Schema, and well against a snowflake schema. This is also true of many other query tools so transforming into one of these Schema styles in your database will provide value across your data landscape. These transformations from a normalised schema can sometimes be easier to make in SQL outside of Qlik Analytics than if they need to be hand-coded in Qlik Script. See star and snow & When do we use Snow Flake schema in Data Model?. And as you ideally only want a single fact table, you may want to consider concatenated fact tables (see Concatenate vs Link Table ).
8. Filter data in the SQL statement (or before) where possible
when loading data from a source database, It is common to filter the data to provide just what is needed for your use-case. It is possible to filter any data source, however if this is done within a Qlik Analytics load statement, the data will first be read by Qlik before excluding that which does not meet the filter. This increases load times, network bandwidth and resource usage. If however, the filter is placed on a select statement, then this will be pushed down to the source and data excluded by the filter will never be sent to Qlik. In the following example, the end result is the same. In the former however the filtering is done once the data has been read by Qlik. In the latter, it is pushed down to the database and is never seen by Qlik.
If this filter is static, it would make sense to include it as part of the view to ensure self-service users do not load unnecessary data.
9. Only keep the level of precision you need
Analytics rarely involves drilling down to the individual transactions. Therefore often less precision is needed for analytics as is needed for an operational system. Rounding down (say from 8 to 4, or even two decimal places) saves space, reduces data transferred and improves performance. If you are doing this it makes sense to do it before it gets to Qlik and this could be embedded in a view. For example if I have a ‘rate’ field that allows 6 decimal points, but IO only need 2, I could use a statement like “cast(rate as NUMERIC(6, 2) )”. Doing this before it gets to Qlik will provide better consistency across your Qlik Landscape and provides better performance to your self-service users.
10. Plan for incremental loads if possible
Remember when we said to exclude columns not relevant for analytics (#2) ? Well there is an exception to this and it relates to the need to understand when data was changed so you can perform incremental loads. Storing the last modified date allows us to only look at the data changed since our last reload, so will make a big difference to performance for incremental loads.
Final thoughts
The suggestions on this list are not the only things that you can do to make your source database Qlik analytics ready however they deserve consideration as they can provide a lot of value. And this is not the only approach you can take – there may be good reasons for for taking a different approach in some of these areas, however at least considering these facors will help you to build an analytics ready database.
What other suggestions do you have? What has your organisation done to create a Qlik Analytics ready environment? Let me know in the comments!
-
Decomposition Tree in Qlik Sense: All You Need to Know
A decomposition tree is a visualization tool used in data analysis and business intelligence to help break down complex data sets into more manageabl... Show More -
Transfer Data from Qlik Sense to WEB SERVICE using Qlik REST Connector
Hi community, I assume we all, once in a while, faced this question : "Is it possible to send a table from QlikSense to our WebService/database?" ... Show MoreHi community,
I assume we all, once in a while, faced this question : "Is it possible to send a table from QlikSense to our WebService/database?"
So, without further due, the answer is : YES !
I'll now share with you how I did to implement this:
0) prerequisites : The WEB SERVICE is already created.. (obviously)
1) This is a Qlik Sense Tabletable:
//This is the alert table, in which will be sent to the WS
load alert,RowNo() as row, timestamp(date#(date,'DDMMYYYY'),'YYYY-MM-DD hh:mm:ss.ff') as date;
load * inline [
alert, date
alert1,06/12/2017
alert2,06/12/2017
];
PS : The row field is created to browse all the alerts to send.
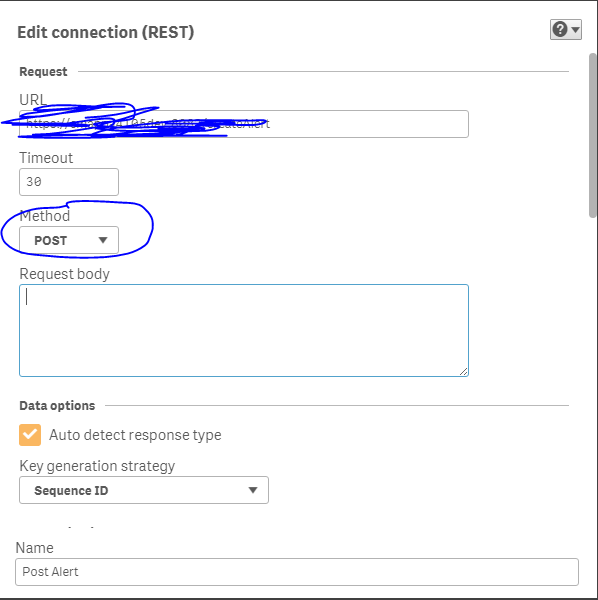
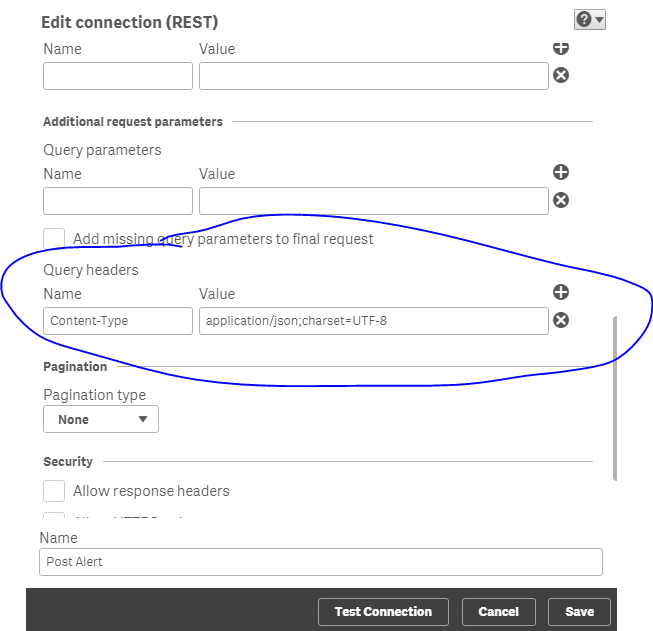
2) Make a Rest Connector with your Web Service (POST method):

3) Import the data within the WS:

Result:
LIB CONNECT TO 'Post Alert';
RestConnectorMasterTable:
SQL SELECT
"alertName",
"dateCreation",
"dateValidation",
"utcodeValidator"
FROM JSON (wrap on) "root";
[root]:
LOAD [alertName] AS [alertName],
[dateCreation] AS [dateCreation],
[dateValidation] AS [dateValidation],
[utcodeValidator] AS [utcodeValidator]
RESIDENT RestConnectorMasterTable;
DROP TABLE RestConnectorMasterTable;
4) The 4th and most important step, is to modify the script above, to control the request sent to the WS.
For that, it's mandatory to add our Request Body
a)
RestConnectorMasterTable:
SQL SELECT
"alertName",
"dateCreation",
"dateValidation",
"utcodeValidator"
FROM JSON (wrap on) "root" WITH CONNECTION(
BODY "$(vRequestBody)"
);
[root]:
LOAD [alertName] AS [alertName],
[dateCreation] AS [dateCreation],
[dateValidation] AS [dateValidation],
[utcodeValidator] AS [utcodeValidator]
RESIDENT RestConnectorMasterTable;
DROP TABLE RestConnectorMasterTable;
b) Let's now define the request body.
Depends on the WS (how It's constructed) ; This phase is handled by experts, as Qlikers, we just ask the question to know what to do..)
FIRST CASE: send the alerts one by one :
For this case: the request body for our Web Service should be as follow:
send :
{"alertName": "Alert1", "dateCreation": "2017-12-06 14:59:25.00"}then
{"alertName": "Alert2", "dateCreation": "2017-12-06 14:59:26.00"}
/this the part where we use the rest connector to send the table alert to the DB
//each time we peek and alert and its date and store them in variables
for a=0 to FieldValueCount('row')-1
Let vAlert = Peek('alert',$(a), 'alerts');
Let vDateCreation = Peek('DateAlertes',$(a),'alerts');
//here we write our body request using the created variables and send them (one by one)
//This is the Json Request to post in the Web Service
LET vRequestBody ='{';
Let vRequestBody = vRequestBody&'"alertName":"$(vAlert)",';
Let vRequestBody = vRequestBody&'"dateCreation":"$(vDateCreation)"';
Let vRequestBody = vRequestBody&'}';
let vRequestBody = replace(vRequestBody,'"', chr(34)&chr(34)); //this is mandatory
LIB CONNECT TO 'Post Alert';
RestConnectorMasterTable:
SQL SELECT
"alertName",
"dateCreation",
"dateValidation",
"utcodeValidator"
FROM JSON (wrap on) "root" WITH CONNECTION(
BODY "$(vRequestBody)"
);
[root]:
LOAD [alertName] AS [alertName],
[dateCreation] AS [dateCreation],
[dateValidation] AS [dateValidation],
[utcodeValidator] AS [utcodeValidator]
RESIDENT RestConnectorMasterTable;
DROP TABLE RestConnectorMasterTable;
next a
SECOND CASE: send all the alerts in one shot :
For this case: the request body for our Web Service should be as follow:
send:
{{"alertName": "Alert1", "dateCreation": "2017-12-06 14:59:25.00"},{"alertName": "Alert2", "dateCreation": "2017-12-06 14:59:26.00"}}Let vRequestBody ='[';
for a=0 to FieldValueCount('row')-1
Let vRequestBody = vRequestBody& '{"alertName" :'&'"'& Peek('alert',$(a), 'alerts')&'"'&',' & '"dateCreation":'&'"' & Peek('DateAlertes',$(a), 'alerts')&'"'&'},';
next a
// this below is to eliminate the last ',' created
Let vRequestBody = left(vRequestBody,len(vRequestBody)-1);
Let vRequestBody=vRequestBody& ']';
let vRequestBody = replace(vRequestBody,'"', chr(34)&chr(34));
LIB CONNECT TO 'Post Alert';
RestConnectorMasterTable:
SQL SELECT
"alertName",
"dateCreation",
"dateValidation",
"utcodeValidator"
FROM JSON (wrap on) "root" WITH CONNECTION(
BODY "$(vRequestBody)"
);
[root]:
LOAD [alertName] AS [alertName],
[dateCreation] AS [dateCreation],
[dateValidation] AS [dateValidation],
[utcodeValidator] AS [utcodeValidator]
RESIDENT RestConnectorMasterTable;
DROP TABLE RestConnectorMasterTable;
That's all folks.. Hope this could be of a help for someone out there

Omar BEN SALEM.
-
Enhanced Guide: Embedding Qlik Cloud Content with JWT Authentication
Hello there! Solving the Qlik Cloud Content Embedding Puzzle with JWT Iframe Magic Welcome to a tutorial designed for those navigating the waters of e... Show MoreHello there!
Solving the Qlik Cloud Content Embedding Puzzle with JWT Iframe Magic
Welcome to a tutorial designed for those navigating the waters of embedding Qlik Cloud content while ensuring a seamless, invisible authentication experience. Say goodbye to complexities and embrace a dynamic way to present Qlik Cloud app/sheet using iframes.
The default behavior of embedding an iframe with tenant URL, app ID, and sheet ID usually leads to unwanted redirections, demanding logins before content becomes visible.
Enter JWT authentication, the solution that sends a payload to Qlik Cloud, signs the response, and generates a JWT token for seamless authentication.
Let's dive in!
Step 1: Enabling JWT for Your Qlik Cloud Tenant Begin by enabling JWT for your Qlik Cloud tenant. This involves raising a support case with Qlik to activate JWT.
Step 2: Crafting the Key Pair for JWT Configuration As JWT gets activated, generate a public/private key pair to configure JWT authentication for Qlik Cloud. Follow this guide.
Step 3: Configuring JWT IDP Once JWT is live in your Qlik Cloud tenant, configure the JWT Identity Provider (IDP) using details obtained from the public/private key pair. Follow this guide.
Step 4: Preparing the Iframe Presentation
Gather essentials:
- Open the desired APP and copy its app ID from the URL.
- Open the SHEET you want to showcase and copy its sheet ID from the URL.
Take action:
- Within the Management Console, navigate to "Web" and set up a Web Integration. Origin should match the host of your PHP/HTML file for iframe presentation (e.g., https://www.example.com).
- In the Management Console, visit "Content Security Policy" and create a new entry with the "frame-ancestors" directive. Use the same origin as your Web Integration.
Step 5: Interacting with the JWT Endpoint
This thrilling step involves:
- Sending a payload.
- Signing the payload.
- Outputting the JWT Token.
This process allows us to authenticate (POST) against
https://yourcloudtenant/login/jwt-session. This session creation facilitates content presentation through iframes.For implementation, I've used node.JS, requiring modules such as fs, jsonwebtoken, and uid-safe. Follow the provided links for installation instructions.
-
Install node.JS: Follow the installation guide.
-
Install module uid-safe: Check out the installation details here.
-
Install module jsonwebtoken: Install it via this link.
-
Install module fs: Find installation instructions here.
Create the
.jsfile, e.g.,generate.js, to handle payload/signing and JWT token output. Replace placeholders with your specifics.Here's a peek at the code:
const fs = require('fs');
const jwt = require('jsonwebtoken');
const uid = require('uid-safe');

const privateKey = fs.readFileSync('<the path to your privatekey.pem, for example: certificates/privatekey.pem>', 'utf8'); // Adjust the path and encoding

const signingOptions = {
  keyid: '<the keyid. You can copy this when you create the JWT IDP on your cloud tenant>',
  algorithm: 'RS256',
  issuer: '<the issuer. You can copy this when you create the JWT IDP on your cloud tenant>',
  expiresIn: '30s',
  notBefore: '-30s',
  audience: 'qlik.api/login/jwt-session',
};

const payload = {
  jti: uid.sync(32),
  sub: '<the subject of the user>',
  subType: 'user',
  name: '<full name of the user>',
  email: '<e-mail address of the user>',
  email_verified: true,
  groups: []
};

const myToken = jwt.sign(payload, privateKey, signingOptions);

// Output the token
process.stdout.write(myToken);
To proceed, some aspects within the JWT payload need customization. Let's address these requirements:
-
sub: The "sub" field within the payload represents the user ID used to transmit the payload. Obtain this ID by accessing the URL
https://yourcloudtenant/api/v1/users/meafter logging into your Qlik Cloud tenant. The URL will display relevant information on-screen; focus on the URL itself. You'll find a segment like "****-ugW-**-nGH8sRxq97ksBpwx." Remove the asterisks and utilize this value for the "sub" entry. -
name and email: These fields are straightforward. Retrieve the user's full name and email from the same endpoint mentioned earlier. Alternatively, you can click the "i" icon in your user list within the Management Console to access this information.
-
keyid and issuer: These values are furnished during JWT IDP creation. When you set up the JWT Identity Provider, these details will be visible. Finally, the
const privateKeyshould point to the location of your.pemfile on the server.
Make sure to make these adjustments to ensure the JWT payload accurately reflects the user and adheres to the requirements of your Qlik Cloud integration.
This
.jsfile interacts with the JWT endpoint and prepares the authentication token.Testing JWT Token Generation
Now comes the exciting part – verifying the successful generation of the JWT token. To do this, execute the following command in your terminal:
node <filename.js>Upon running this command, your terminal will display the resulting JWT token, which appears as a lengthy encrypted string. This token is crucial for establishing secure authentication within your Qlik Cloud integration.
Here's a glimpse of the token (partially redacted for security reasons):Every character within this token holds encrypted information necessary for the secure operation of your integration.
eyJhbGciOi....7sNtjlad6CJA1AV2552GGMclPXBPdfXUyrxGzNvzN0L9Rr8jhB4AyrVVXUsBjgCo6VbF6WogxPbk7P07OPN-P9awEG_7oCVaBK9gJUXT4GSI8moy7VOMFHO6tzLennruCiHIMUhKy9L3ncXIzwe9vEvllZ1bvsRemember, your Qlik Cloud experience is about to get smoother as this token plays a pivotal role in seamless and secure authentication. Now that you've got the token, it's time to move on to the next steps.
Step 11: Validating the JWT Token
You can verify the validity of the generated JWT token by using Postman, a versatile API testing tool. Follow these steps:
-
Download Postman if you haven't already.
-
Create a new POST request in Postman, directing it to
https://yourcloudtenant/login/jwt-session. -
Set the necessary headers:
Content-Type: application/jsonqlik-web-integration-id: <Your web integration ID>Authorization: Bearer <Your JWT Token>
If all goes well, you'll receive a 200 OK status, indicating the successful authentication of the JWT token.
Step 12: Crafting the JWT Token Endpoint
To provide a convenient endpoint for code reference, you can create a simple
.phpfile that executes thenode generate.jscommand on your server and presents the JWT token in encoded JSON format.Here's an example of the PHP code:
<?php
header('Content-Type: application/json');
echo json_encode(['body' => `node generate.js`]);
This endpoint URL will be something like
https://www.example.com/qlikcloud/jwt_token.php.Step 13: Building the Iframe Display Page
Finally, let's build the
index.php/index.htmlfile that utilizes the JWT Endpoint to acquire and utilize the token for the iframe display. You'll need to replace placeholders with your actual details:<html> <head> <script src="https://unpkg.com/enigma.js/enigma.min.js"></script> </head> <body> <div id="main"> <div id="message"></div> <iframe id='qlik_frame' style='border:none;width:100%;height:900px;'></iframe> </div> <script> // CONFIGURATION const TENANT = '<yourcloudtenant>'; const JWTENDPOINT = 'https://www.example.com/qlikcloud/jwt_token.php'; const WEBINTEGRATIONID = '<web integration id>'; const APPID = '<appid>; const SHEETID = '<sheetid>'; const IDENTITY = '<not mandatory, fill in whatever you want>'; // MAIN (async function main() { const isLoggedIn = await qlikLogin(); const qcsHeaders = await getQCSHeaders(); const [session, enigmaApp] = await connectEnigma(qcsHeaders, APPID, IDENTITY); handleDisconnect(session); const theme = await getTheme(enigmaApp); renderSingleIframe('qlik_frame', APPID, SHEETID, theme, IDENTITY); })(); // LOGIN async function qlikLogin() { const loggedIn = await checkLoggedIn(); if (loggedIn.status !== 200) { const tokenRes = await (await getJWTToken(JWTENDPOINT)).json(); const loginRes = await jwtLogin(tokenRes.body); if (loginRes.status != 200) { const message = 'Something went wrong while logging in.'; alert(message); throw new Error(message); } const recheckLoggedIn = await checkLoggedIn(); if (recheckLoggedIn.status !== 200) { const message = 'Third-party cookies are not enabled in your browser settings and/or browser mode.'; alert(message); throw new Error(message); } } console.log('Logged in!'); return true; } async function checkLoggedIn() { return await fetch(`https://${TENANT}/api/v1/users/me`, { mode: 'cors', credentials: 'include', headers: { 'qlik-web-integration-id': WEBINTEGRATIONID }, }) } // Get the JWT and use it to obtain Qlik Cloud session cookie. async function getJWTToken(jwtEndpoint) { return await fetch(jwtEndpoint, { mode: 'cors', method: 'GET' }) } async function jwtLogin(token) { const authHeader = `Bearer ${token}`; return await fetch(`https://${TENANT}/login/jwt-session?qlik-web-integration-id=${WEBINTEGRATIONID}`, { credentials: 'include', mode: 'cors', method: 'POST', headers: { 'Authorization': authHeader, 'qlik-web-integration-id': WEBINTEGRATIONID }, }) } async function getQCSHeaders() { const response = await fetch(`https://${TENANT}/api/v1/csrf-token`, { mode: 'cors', credentials: 'include', headers: { 'qlik-web-integration-id': WEBINTEGRATIONID }, }) const csrfToken = new Map(response.headers).get('qlik-csrf-token'); return { 'qlik-web-integration-id': WEBINTEGRATIONID, 'qlik-csrf-token': csrfToken, }; } // ENIGMA ENGINE CONNECTION async function connectEnigma(qcsHeaders, appId, identity) { const [session, app] = await getEnigmaSessionAndApp(qcsHeaders, appId, identity); return [session, app]; } async function getEnigmaSessionAndApp(headers, appId, identity) { const params = Object.keys(headers) .map((key) => `${key}=${headers[key]}`) .join('&'); return (async () => { const schema = await (await fetch('https://unpkg.com/enigma.js@2.7.0/schemas/12.612.0.json')).json(); try { return await createEnigmaAppSession(schema, appId, identity, params); } catch { // Handle race condition with new users who do not have permissions to access the application. The code makes another attempt after a 1.5 seconds. const waitSecond = await new Promise(resolve => setTimeout(resolve, 1500)); try { return await createEnigmaAppSession(schema, appId, identity, params); } catch (e) { throw new Error(e); } } })(); } async function createEnigmaAppSession(schema, appId, identity, params) { const session = enigma.create({ schema, url: `wss://${TENANT}/app/${appId}/identity/${identity}?${params}` }); const enigmaGlobal = await session.open(); const enigmaApp = await enigmaGlobal.openDoc(appId); return [session, enigmaApp]; } // BONUS! DYNAMICALLY FETCH THEME async function getTheme(enigmaApp) { const createAppProps = await enigmaApp.createSessionObject({ qInfo: { qId: "AppPropsList", qType: "AppPropsList" }, qAppObjectListDef: { qType: "appprops", qData: { theme: "/theme" } } }); const appProps = await enigmaApp.getObject('AppPropsList'); const appPropsLayout = await appProps.getLayout(); const theme = appPropsLayout.qAppObjectList.qItems[0].qData.theme; return theme; } // HANDLE ENGINE SESSION CLOSURE function handleDisconnect(session) { session.on('closed', () => { const message = '<Your text here> Due to inactivity or loss of connection, this session has ended.'; document.getElementById('qlik_frame').style.display = "none"; document.getElementById('message').innerHTML = message; }); session.on('suspended', () => { const message = '<Your text here> Due to loss of connection, this session has been suspended.'; document.getElementById('qlik_frame').style.display = "none"; document.getElementById('message').innerHTML = message; }); window.addEventListener('offline', () => { session.close(); }); } // HELPER FUNCTION TO GENERATE IFRAME function renderSingleIframe(frameId, appId, sheetId, theme, identity) { const frameUrl = `https://${TENANT}/single/?appid=${appId}&sheet=${sheetId}&theme=${theme}&identity=${identity}&opt=ctxmenu,currsel`; document.getElementById(frameId).setAttribute('src', frameUrl); } </script> </body> </html>Customizing Integration Parameters
Before proceeding, let's customize a few essential parameters that will tie your integration together seamlessly. These values act as the foundation for your Qlik Cloud integration, enabling it to function smoothly. Let's take a moment to personalize them:
TENANT: Replace with your Qlik Cloud tenant URL.JWTENDPOINT: Set this to the endpoint where your JWT token will be generated, for instance:https://www.example.com/qlikcloud/jwt_token.php.WEBINTEGRATIONID: Input your unique web integration ID.APPID: Insert the App ID of the Qlik Cloud app you want to embed.SHEETID: Specify the Sheet ID of the specific sheet you wish to display.IDENTITY: Optionally, add a unique identity to enhance tracking and management.
With these values tailored to your integration's requirements, you're ready to proceed to the next step.
Witness Your Integration in Action
Now that everything is in place, it's time to witness the magic unfold. By serving your
index.phporindex.htmlfile, you'll see your Qlik Cloud integration come to life.Prepare to be amazed as the iframe showcases your chosen app and sheet, all seamlessly authenticated without any hassle. Sit back and enjoy the smooth presentation of data within the iframe.
Step 14: Conclusion
And there you have it! By following this thorough guide, you've accomplished the intricate process of embedding Qlik Cloud content using iframes and JWT authentication. Your users can now seamlessly access the content without encountering any login hurdles.
Remember, every placeholder like
<...>needs to be replaced with your specific details to make the entire process work seamlessly.Enjoy the enhanced user experience and feel free to reach out if you encounter any challenges or need further assistance!
-
Using an Application Automation to serve as an Advanced Analytics Connector
My Catch 22 So here was the situation I was facing, my boss was screaming at me to do something that didn't exist so I ... alright truth be told he wa... Show MoreMy Catch 22
So here was the situation I was facing, my boss was screaming at me to do something that didn't exist so I ... alright truth be told he was never screaming at me and he was fine with the initial work around I came up with. I was the one screaming to try and connect to the Google Gemini Pro #LLM in the same Server Side Extension manner I had been for other Large Language Models. I wanted to be able to ask a question and get a response, but also have the response be responsive if I filtered selections in the data.
The problem is that the API for Google Gemini Pro expects a nested block of JSON, and the generic Advanced Analytics Connector only sends a basic JSON block with field/value pairs. But my hero, Daniel Pilla, helped me realize that a Qlik Application Automation will accept the basic JSON field/value pair block and that I could then infuse the question and data into the URL call as needed for the Google Gemini Pro API.
Feel free to watch the video and skip all of the yapping I do after it. Or if you think it might be helpful and actually want to try, feel free to read the step by step instructions to give it a try on your end.
Video
Yapping with Step by Step Instruction
To test let’s create a brand new Qlik Application Automation
Be sure to set the Start block to Triggered and keep a copy of the information that it will display for you as to how to call the automation you will need that when creating the Advanced Analytics Connector inside of Qlik Sense momentarily.
Then add an Output block that will simply output “Yeah I did something”
Create a new Qlik Sense application and go to the Load Script.
Before adding our Advanced Analytics connector we need to add some sample data to our load script to test with:
Data:
Load * Inline [
Question#, Prompt
Question 1, "Human: What can you tell me about the Qlik Associative Model and why customers love it so much? Assistant:"
];
Choose Create new connection and then choose Advanced Analytics
Simply copy the URL from the Automation you just created, and then create a HTTP Headers entry for X-Execution-Token as shown and the token provided.
In the Response Table section simply input any table name value you wish for the Name of Returned Table and uncheck the box that says Load all available fields, and set the Table Field (JMESPath) to response and response.
You will see why based on the data in a second but for now just enter Question# as the Association Field and be sure the Send Association Field box is not checked:
Save your newly created Advanced Analytics connector.
Now choose the Select Data icon for your Advanced Analytics test connection
After you type in the name of our sample data table “Data” the connector will then show you what information will be returned. Notice in my image it’s the AnyNameYouWant table because that is literally what I input, your screen will contain the name you used.
Run the load script and you will see that you sent 1 row and you got 1 row back:
Keep in mind that we didn’t do anything special in our Qlik Application Automation yet, we are simply using this as a test to understand HOW the Advanced Analytics Connector works. So let’s go over to the Qlik Application Automation you created and see what we learned.
Click on your Output block and delete the “Yeah I did something” text that was being output previously:
Now from the dropdown for Data to output choose the right arrow icon for Output from start because we want to see what it actually contains:
Not surprisingly it shows us that it received a simple record. Now click the Toggle view mode icon so that you can see what I mentioned at the onset. It is the very simple JSON block with a simple field/value pair that is passed in:
With that knowledge untoggled the View mode so we see the array instead and type
“You asked for: ” then click the Prompt field and choose Select first item from list. (While you saw it knows we only passed 1 entry, it assumes the body can be an array. So we need to select the first one, which is all we would ever pass it.)Instead of calling the automation from the load script again, lets build a simple Analytics sheet instead.
Simply add a Text & Image chart to your new sheet.
Now add a measure
And use the following string as your expression. The connectionname you use is the one you created and you can copy it right from the load script if needed to ensure you have spelling and spacing correct:
Your measure expression should be:
endpoints.ScriptEvalStr('{"RequestType":"endpoint", "endpoint":{"connectionname":"Advanced_Analytics"}}', 'Tell me a dad joke' as Prompt, 'Qlik Dork' as UserName)
The measure we added is evaluated and our Text & Image Chart now contains the response from our Automation:
Now let’s go back to the Automation and take another look at it. We know we were just forcing the Output value, it’s the Start block that we care about. Notice that now the Start block had a plain JSON body with both fields.
Now let’s add a Table object to our screen. Add the Question# and the Prompt as dimensions. Then add a measure with the following expression:
endpoints.ScriptEvalStr('{"RequestType":"endpoint", "endpoint":{"connectionname":"Advanced_Analytics"}}', Prompt)
Yeah … we can call our Automation as an SSE style Advanced Analytics connector and we know that we can pass fields from our actual data, or made up values as needed.
Summary
We know there is nothing super exciting about getting a return value that repeats your question. But this post is just the foundation for you to build upon, which is exactly what I did and what I refer to in my video. Who knows what you may try and utilize the Advanced Analytics Connector for and when you encounter a red screen error or something you will know just what the issue may be.
On my end, one Dan helped me know I could call my Application Automation from an Advanced Analytics Connector, the rest of my problem was resolved quickly. All I simply had to do was add the simple basic URL block to my automation and call the Google Gemini Pro API.
In a similar fashion to what it expects, their API returns a nested block. I was able to pull that value out and return it as the result.
-
When a table contains more than what is needed (i.e. only valued fields)
Hi,have you ever needed to delete the fields of a table with hundreds of columns that were actually unused (i.e., empty or zero)?Here is the function ... Show MoreHi,
have you ever needed to delete the fields of a table with hundreds of columns that were actually unused (i.e., empty or zero)?
Here is the function that will INSTANTLY allow you to remove the columns without values:sub ClearFields(tName) //pass the table name AFTER a Load *... let cancellati=0; let totfield=NoOfFields('$(tName)'); let vElenco=''; for i=0 to totfield let vFName = PurgeChar(FieldName($(i),'$(tName)'),'[]"'); let vCnt=FieldValueCount('$(vFName)'); if vCnt=1 then vElenco = vElenco & ',[$(vFName)]'; let cancellati=cancellati+1; end if next i if cancellati>0 then vElenco = mid(vElenco,2); drop fields $(vElenco) from $(tName); trace Tabella $(tName): cancellati $(cancellati) campi su $(totfield) iniziali presenti; else trace Table $(tName): nessun campo eliminato su $(totfield); end if end sub -
Comparing Qlik Analytics and R Software for Accurate Two-Sample T-Tests Research...
A while ago, I conducted an internal research project with my colleagues @AlaneMiguelis, and Dr. @priscilarubim, aiming to validate the accuracy of a ... Show MoreA while ago, I conducted an internal research project with my colleagues @AlaneMiguelis, and Dr. @priscilarubim, aiming to validate the accuracy of a Two-Sample T-Test in Qlik by comparing it with the medical research gold standard: R. While we explored various hypothesis testing methods, we prioritized formalizing our findings on the T-Test. Recently, we decided to make this document available to the whole community.
The focus of our project was to assess whether the statistical results produced by Qlik matched those generated by R, particularly for the Two-Sample T-Test. Our methodology involved rigorous data analysis and repeated testing to ensure the reliability and consistency of our results. Through our detailed comparative analysis, we aimed to provide insights into the robustness of Qlik’s statistical capabilities. The code and dataset is available in a Git repository for those who want to reproduce the study.
Here is the abstract of our study. The full document can be accessed through the link at the end of this post.
ABSTRACT
Objective
The statistical determination of a large or small difference between two groups is not based on an absolute standard, but is rather an evaluation of the probability of an event.1,2 In the field of medical research, it is common to use statistical software for descriptive statistics as well as to perform statistical tests.3 However, most software provides ready-to-use functions, and the researchers have almost no information as to how those statistical tests are calculated inside those functions. This article evaluates the accuracy of two-sample Student’s t-test using Qlik analytics software. The gold standard used for this evaluation is the set of standard t-test functions available in R software, a widely used, robust, and reliable statistical software.5–7
Materials and MethodsThe tests performed in this evaluation used a subset of Framingham heart study data. The dataset contains data on 4,434 anonymous participants, collected in three periods apart from each other by 6 years from 1956 to 1968. Five t-tests with 2 scenarios each were performed in Qlik analytics and in R and the results compared.
ResultsIn general, the results for multiple statistics obtained in Qlik analytics match the ones found in R for multiple scenarios: small and large sample sizes, small and large p-values, assuming and not assuming equal variance.
DiscussionAlthough Qlik analytics matches all statistics for t-test found in R, the p-value only matches up to four decimal points, which is concluded to be enough for testing hypothesis since the conventional levels of significance do not go lower than 0.1.
ConclusionThis research concluded that Qlik analytics can be used for two-sample t-tests in multiple scenarios.
Keywords: Qlik, t-test, r language, Framingham.
Link for the full article: Comparing Qlik Analytics and R Software for Accurate Two-Sample T-Tests Research Paper (ipc-global.com) -
Calling QlikView Tasks from Qlik Sense on-prem
Introduction QlikView > Qlik Sense > Qlik Cloud...Replatform is challenging and sometimes, different platforms have to coexist and interact to each ot... Show MoreIntroduction
QlikView > Qlik Sense > Qlik Cloud...
Replatform is challenging and sometimes, different platforms have to coexist and interact to each other.In this article I will show how can you call QlikView Tasks from Qlik Sense - and potentially from Qlik Cloud - using PowerShell Scripts.
Requirements
- QlikView and Qlik Sense Servers must be accessible to each other
- Qlik Sense Service User Account must have QlikView QMC rights to execute tasks
- Qlik Sense Legacy Mode enabled - More info: Disabling standard mode | Qlik Sense on Windows Help
- PowerShell installed and enabled to execute scripts
# Open Powershell as Admin and Execute the following to allow Powershell Scripts execution
# Set-ExecutionPolicy -ExecutionPolicy RemoteSigned
# Set-ExecutionPolicy Unrestricted
The PowerShell Script
The PowerShell script is simple as it shows below. It requires two parameters:
- The QlikView QMC Service URL: usually in the form http://myqlikurl:4799/QMS/Service
- The QlikView Task ID: this is a Task ID GUID number. You can get the Task ID from QlikView QMC Task Log - probably there are other ways to get this GUID too.
param (
    [Parameter(Mandatory=$true)]
    [string]$QlikViewQMCServiceUrl,
    [Parameter(Mandatory=$true)]
    [string]$TaskID
)

$service = New-WebServiceProxy -Uri $QlikViewQMCServiceUrl -Namespace QlikViewServer -UseDefaultCredential
$serviceKey = $service.GetTimeLimitedServiceKey()

$hdrs = @{}
$hdrs.Add("SOAPACTION","http://ws.qliktech.com/QMS/12/2/IQMS2/RunTask")
$hdrs.Add("Content-Type", "text/xml;charset=utf-8")
$hdrs.Add('X-Service-Key',$serviceKey)

$body = @{}
$body = '<s:Envelope xmlns:s="http://schemas.xmlsoap.org/soap/envelope/">
<s:Body>
<RunTask xmlns="http://ws.qliktech.com/QMS/12/2/">
<taskID>' + $TaskID + '</taskID>
</RunTask>
</s:Body>
</s:Envelope>'

$res = Invoke-WebRequest -Uri $QlikViewQMCServiceUrl -Method Post -Body $body -UseDefaultCredential -Headers $hdrs
Running the PowerShell Script
We can Run the PowerShell Script in multiple ways:
- CMD
- PowerShell
- Batch Files
- Qlik Sense Task
- Qlik Sense Load Script
- SQL Server Stored Procedures
- Any other platform that supports PowerShell scripts
For now, we'll run it through Qlik Sense Load Script:
EXECUTE powershell.exe -ExecutionPolicy Bypass -File "$(vTempPowerShellScriptFile)" -QlikViewQMCServiceUrl "$(vTempQlikViewQMCServiceUrl)" -TaskID "$(vRunningTask)";To call the EXECUTE statement in the Load Script you must enable the Legacy Mode in your Qlik Sense Server.
- vTempPowerShellScriptFile is the full path of the PS1 PowerShell Script file
- vTempQlikViewQMCServiceUrl is the QlikView QMC Service Url
- vRunningTask is the QlikView Task ID
That is it! Now from Qlik Sense Server we can call QlikView Tasks with minimum changes in our server environments.
Enhancing the PowerShell Script
The PowerShell Script in my example contains only the core of its functionality. I strongly recommend including log messages and error handling through try/catch/finally blocks.
What about Qlik Cloud?
I haven't tested this but here is my theory:
- Have a SQL Server on-prem with access the QlikView Server
- Create a Store Procedure with the same parameters of the PowerShell Script. The Stored Procedure will execute the PowerShell Script.
- Install and configure Qlik Data Gateway on a server with access to the SQL Server Database
- On Qlik Cloud setup a SQL Server connection based on the Qlik Data Gateway
- From Qlik Cloud, create a Qlik Sense Application that calls the Stored Procedure from the Load Script - For more info: Solved: Qlik Data Gateway with SQL Stored Procedures - Qlik Community - 2001425
That should do the magic. Please let me know if you have tried this and if it has worked.
-
Setting Up Qlik Sense to Send Email Notifications on Reload Task Failure
I spent a bunch of time on and off trying to figure how to generate an email alert when a reload fails. It's something I and I'm sure many others wish... Show MoreI spent a bunch of time on and off trying to figure how to generate an email alert when a reload fails. It's something I and I'm sure many others wish was built-in and worked out-of-the-box, but it's actually somewhat possible. There are some restrictions - for me, I sometimes get reloads that hang, even though I put in a max retry, and since they don't "fail," I never get the notification. And obviously, the email notification is generalized to the point where you have to log into the QMC to discover which app failed. But if you're a Qlik Sense admin, you're smart enough how to make customized email alerts for each reload task :).
Setting up Qlik Web Connectors
- If necessary, whitelist your Qlik Sense server’s IP in your mail relay.
- Download the QlikWebConnectors zip folder from the Qlik support site: https://us-d.demo.qlik.com/download/
- Filter down to "Qlik Connectors" and under the "Products" section, scroll down to find "Qlik Web Connectors."
- Find the most recent Initial Release and click on the name to download - March 2020 at time of writing.
- Extract that folder to the root of the C drive. Rename the folder to QlikWebConnectors if it is not already named so.
- You may notice no installation has ran yet. We will get back to that later. If you open the QlikWebConnectors folder, you can run QlikWebConnectors.exe to start the program. A window will appear in the bottom right of your screen.
- Click "open in default browser" to begin setup. Accept the license agreement.
- While you can technically write out the script directly in a Qlik Sense app, a sanitized version of which I will provide below, the following is how to set up through the SMTP Connector.
- There are a lot of Connectors available. Browse to the "Standard" tab and open "Qlik SMTP Connector." Highlight SendEmail and click Parameters.
- Set up the fields according to how your mail server requires. Mine is set up to allow anonymous authentication but only whitelisted servers are allowed. Below is how mine is set up, but yours may be different.
- SMTP Server: FQDN of your mail relay
- Port: usually 25
- SSL Mode: depends on your setup - mine is anonymous so I set to "None"
- To: email you want to receive the email alerts
- Subject: email subject
- Message: email body
- HTML: check this box so you can use HTML tags in your Qlik script
- From name: display name the email is being sent from
- From email: email address the email is being sent from
- Click "Save Inputs & Run Table." On success, the To Email you entered above will receive the email.
- Click over to the "Qlik Sense (Standard Mode)" tab. You will see some instructions and some auto-generated code. Copy it to the clipboard.
- Create a new Qlik Sense app titled something descriptive (e.g. "Send Email"), open the Data Load Editor, and paste the code into the Data Load Editor. You may get a warning that the app has no data, which is expected and can be safely ignored.
- Follow the instructions highlighted in red to set up the Web File connection. It should look as below. Give it a descriptive name as well. Make sure you create this as the Web Connector program is still running on the Qlik server.
- Make sure the variable "vQwcConnectionName" matches the name of the email connection you just created.
- Click "Load Data" to test the email and make sure it gets sent to the email you set above.
- The obvious quirk of this set up is it requires the WebConnector program to be running constantly. Luckily, QlikWebConnectors can be set up to run as a service.
- On the Qlik Sense server, browse to C:\QlikWebConnectors\BatchFiles.
- Edit "Install Service.bat" and make sure the .NET and QlikWebConnectors_SVC.exe paths are valid.
- Close Notepad and run the "Install Service.bat" as an admin. When the script has completed after a few seconds, press any key to close.
- Open Services.msc, find Qlik Web Connectors, and change the Log On to your Qlik service account. You may otherwise run into errors in the future if you try to re-setup any connectors.
- Start the service.
- Right-click, Properties, and switch to the Recovery tab. Change the "First Failure" dropdown to "Restart the service." Change "Restart service after" to zero minutes. Click Apply and OK.
- If you try to run the QlikWebConnectors.exe program again, you will get an error that the program is already running.
Setting up Task Failure Triggers
- Log into the QMC.
- Browse to Tasks either from the Dashboard or the sidebar.
- Create a new task, name it something descriptive, and select the Send Email app you created above as the app. The email sends within seconds so it is recommended to lower the default timeout and increase the retries, though this depends on your environment.
- Click the "Actions" dropdown and select "Create new task event trigger."
- Name the trigger task something descriptive relative to the app, click "Add Task," change the dropdown to "Task Failed," and select the task you want to be alerted on a failure of. You can leave the time constraint as the default, it is not relevant when a task chain is only two tasks long, as is the case now. More information here: https://help.qlik.com/en-US/sense/June2019/Subsystems/ManagementConsole/Content/Sense_QMC/create-reload-tasks-from-tasks.htm
- Repeat this process for each individual task you want to be alerted on. You can add a new Send Email app per app, new trigger event per Send email app, or new task per trigger event. I recommend the second for the sake of cleanliness and succinctness.
- Make sure this trigger event process is repeated for each new app that is published in the future.
- When you go to the Tasks page in the QMC, you will notice little chain symbols for every app that is connected to the Send Email app and vice versa. You can click on this chain symbol to view the task chains from either direction.
Editing the Notification App
As written above, the actual script that runs the SMTP Connector is complete and already published to Qlik Sense. In other words, if you ever need to edit or re-publish the app or change the SMTP settings, there is little to do. Details below:
- When you set up the SMTP Connector and run the parameters, you will be given the below line of Qlik script. Notice how hard-coded the (unredacted) bold parameters are.
- Of course, hard-coding is not best practice and the syntax is not obvious at first glance. The bold parameters are replaced by variables in the actual published Qlik Sense app.
- Variables, when placed in the URL script line, must be in the form of $(variablename). If you look closely, every parameter is simply "parameter1=$(variable1)¶meter2=$(variable2)&..." The parameters from the original script block are untouched while the hard-coded values are now variables.
- The script blocks are separated into sections, marked by comment sections. To go through them one-by-one:
- The first section is for script neatness. vQwcConnectionName pulls the webfile defined above into the script. vTimestamp is used for the email body.
- These variables are the content that you will edit. The two "...Input" variables define the content of the email body and subject. More on them in the next section. The rest of the variables are what they sound like.
- I would strongly recommend never touching these lines. The URL script line in Qlik Sense requires plus signs in the place of spaces for each value. These two lines replace the spaces with plus signs for you so editing the value is easier.
- The first section is for script neatness. vQwcConnectionName pulls the webfile defined above into the script. vTimestamp is used for the email body.
[Redacted] QS Script for Send Email app
/**** you shouldn't have to modify these after setup ****/ let vQwcConnectionName = '[web file connector]'; let vTimestamp = timestamp(now()); /**** Edit these variables to change the email contents. ****/ let vMessageInput = 'Qlik Sense Task Failure at ' & '$(vTimestamp)' & '.<br><br>To Review, <a href="https://[Qlik Sense URL].com/qmc">go to the QMC.</a>'; let vSubjectInput = 'Qlik Sense Task Failure'; let vSMTPserver = ' '; let vFromName = ' '; let vSMTPPort = '25'; /**** use %40 in place of the @ symbol ****/ let vToEmail = ''; let vFromEmail = ''; /**** DO NOT EDIT ****/ /**** These variable text strings properly encode the text in the "input" variables ****/ /**** Replaces all spaces with plus signs in the message string above ****/ let vMessage = replace('$(vMessageInput)',' ','+'); let vSubject = replace('$(vSubjectInput)',' ','+'); /**** DO NOT EDIT ****/ SMTPConnector_SendEmail: LOAD status as SendEmail_status, result as SendEmail_result, filesattached as SendEmail_filesattached FROM [$(vQwcConnectionName)] (URL IS [http://localhost:5555/data?connectorID=SMTPConnector&table=SendEmail&SMTPServer=$(vSMTPserver)&Port=$(vSMTPPort)&SSLmode=None&to=$(vToEmail)&subject=$(vSubject)&message=$(vMessage)&html=True&fromName=$(vFromName)&fromEmail=$(vFromEmail)&delayInSeconds=0&ignoreProxy=False&appID=], qvx); // IMPORTANT: If, when loading the above script, you receive a 'Script Error' Dialog box with a 'Field Not Found' // (or other) error, the first thing you should do is copy and paste the full request URL (i.e. the URL between the square [...] // brackets IN THE QLIKVIEW / QLIK SENSE SCRIPT ERROR DIALOG) into a browser address bar and check the response. -
Framingham Heart Study
I use this app to explore different features in the Qlik Cloud: hypothesis testing, integration with Python, AutoML, Glossary, Open AI using Rest API... Show More -
Loading Image files stored in database into a Qlik Sense App
You can load images stored in a database in BLOB format into Qlik Sense by converting to Base64 encoded format in the SQL load script. Further more, ... Show MoreYou can load images stored in a database in BLOB format into Qlik Sense by converting to Base64 encoded format in the SQL load script.
Further more, you can render the image in the Sense UI using the native Qlik Sense Map object. This supported object supports expression based sourcing / displaying of the image both as a data field and as a URL to a HTTP accessible image.
The attached example walks through the setup using the sample AdventureWorksDW SQL database (which contains image files stored as BLOBs) along with both Qlik Sense and NPrinting.
This technique provides a similar alternative to the BUNDLE load technique which was available in QlikView.

-
Splitting up GeoAnalytics connector operations
Many of the GeoAnalytics can be executed with a split input of the indata table. This article explains which and how to modify the code that the conn... Show More
-
Creating an Anthropic (Amazon Bedrock) Connector
The purpose of the attached document is to help you understand the options and be able to configure and test the Anthropic (Amazon Bedrock) connector.... Show MoreThe purpose of the attached document is to help you understand the options and be able to configure and test the Anthropic (Amazon Bedrock) connector. For the purposes of the document assume that our goal is to create a connection that we could utilize to ask questions of the data that we pass to Amazon Bedrock. Within this document we will only get your connection tested, but the accompanying Amazon Bedrock Tutorial application will allow you to pass sample data and ask questions of it so that you can test that functionality as well.
Bonus
Reading is one thing, but there is nothing like seeing it in action and getting your hands on. To that end, the attached Amazon Bedrock Tutorial application will let you create a connection, using the guide, and then step through learning exercises to fully understand how you would pass data from within Qlik Sense to Amazon Bedrock and ask questions of it.
-
Creating an Azure OpenAI Connector
The purpose of the attached document is to help you understand the options and be able to configure and test the Azure OpenAI connector. For the purpo... Show MoreThe purpose of the attached document is to help you understand the options and be able to configure and test the Azure OpenAI connector. For the purposes of the document assume that our goal is to create a connection that we could utilize to ask questions of the data that we pass to Azure OpenAI. Within this document we will only get your connection tested, but the accompanying Azure OpenAI Tutorial application will allow you to pass sample data and ask questions of it so that you can test that functionality as well.
As the Azure OpenAI Connector will require several parameters that you have to input by hand, the document starts by helping you understand how to know which values to use.
🏆Bonus 🏆
Reading is one thing, but there is nothing like seeing it in action and getting your hands on. To that end, the attached Azure OpenAI Tutorial application will let you create a connection, using the guide, and then step through learning exercises to fully understand how you would pass data from within Qlik Sense to Azure OpenAI and ask questions of it.
-
Show/Hide Sheets in Qlik Sense Cloud and Profile User Login
QUESTION: How to display or hide one or more internal sheets of a one o more Qlik Sense App. ANSWER:For convenience, I use a simple INLINE table that ... Show MoreQUESTION:
How to display or hide one or more internal sheets of a one o more Qlik Sense App.
ANSWER:
For convenience, I use a simple INLINE table that reproduces 2 fields necessary for dynamic matching when opening the sheet: USER ID and SHEET IDSA_SHEET:
LOAD * INLINE [
UTENTE,SHEET
55ad8d29ed671d80ecac0d1b4594546e8f88d730d23a63b4da55f51ed77f4ffb,8f3e7e83-00ef-4c34-9458-54ba3840c123
55ad8d29ed671d80ecac0d1b4594546e8f88d730d23a63b4da55f51ed77f4ffa,0af346e4-b0b3-4a20-b2ee-bf9e869412e2
];// the green color is the correct record to match (ID USER and ID SHEET)
Add 3 variables:
the first in the load script;
LET USER = SUBFIELD(OSUSER(),'|',-1); // Extract the User ID session login ( one value only)
the second in variable editor:
ObjectId('sheet') // One value for each sheet in app
the third variable in the visualization condition of sheet properties:
=index(concat( {< UTENTE = {"$(USER)"} >} distinct SHEET,' '),$(vSHEET_ID))
the result will be that when the user ID and the sheet ID are equal to the user of the current session who opens the sheet within the App, the formula returns a value greater than zero, enabling the sheet.
These variables can be inserted more conveniently in an TXT file and loaded with an INCLUDE instruction so as to be able to quickly insert the code into all the published APPs (maximum efficiency) as for the INLINE table which can be included in the loading loads by hooking it if present , to that of ECTION acces for data profiling. Seeing is believing.
Good work
Valerio Fatatis wrote
-
Gradient color palette with the ColorMix2() function
Hi qlik community members, 👋 Check out this solution to create your own gradient color palette with the ColorMix2() function. Resolution in stages Le... Show MoreHi qlik community members, 👋
Check out this solution to create your own gradient color palette with the ColorMix2() function.
Resolution in stages
Let's see how we can achieve this result, in a simple data model.
1 – Find the largest and smallest value of your measurement.
max(total aggr(Sum([Total value]),Customer))

min(total aggr(Sum([Total value]),Customer))
2 – Calculate the difference between these values
max(total aggr(Sum([Total value]),Customer))
-
min(total aggr(Sum([Total value]),Customer))
3 – Now we will create a range, where we will identify positions 0 and 1 of the indices, or basically the values from 0% to 100%.
(sum([Total amount])
-
min(total aggr(Sum([Total amount]),Customer)))

/

(max(total aggr(Sum([Total amount]),Customer))
-
min(total aggr(Sum([Total amount]),Customer)))
4 – To apply the gradient, in your graph go to the Presentation window -> Colors and Legend -> Colors Customize by expression. In the check box, leave the option selected as shown below:5 – Finally, in the expression insert your calculation within the ColorMix2() function.
ColorMix2((sum([Total amount])
      -
min(total aggr(Sum([Total amount]),Customer)))

/
(max(total aggr(Sum([Total amount]),Customer))
-
min(total aggr(Sum([Total amount]),Customer))),red(),blue(),yellow())
For more details see this and other color functions in the qlik help.
https://help.qlik.com/en-US/sense/November2023/Subsystems/Hub/Content/Sense_Hub/ChartFunctions/ColorFunctions/color-functions-charts.htmI hope you like it! 🙂
Attached is the qvf for anyone who wants to see the example model exposed.
Yours sincerely, Matheus -
Field selections AND-mode for Market Basket Analysis
Qlik Sense is an awesome tool when it comes to Data Discovery. However, in some situations there is no straightforward solution and one must perform a... Show MoreQlik Sense is an awesome tool when it comes to Data Discovery. However, in some situations there is no straightforward solution and one must perform a little magic with associative data model.
One such situation is creating Market Basket Analysis. Challenge is to enable AND functionality for user selections instead of the standard OR. What do I mean?
Let’s use a simple sales data example. A customer buys either one product, or two or more. When we load all data it’s easy to filter orders by products.
When one product is selected, we get something like this:

When two products are selected, we get:

Selecting 2 or more products will result in logical OR condition, so we get all sales records with first or second product.
Data analysts working with similar (albeit much more complex) sales data are often interested in combination of products on sales orders. They need a logical AND selection to get only those records where first as well as the second product was sold.
How to achieve this behavior in Qlik Sense?
Starting is quite easy and without any need for scripting. Using the incredible Aggr() function we can create a calculated dimension, which will count all different products sold on each order.

When we place this dimension into a bar chart, we get a nice overview. Moreover, selecting a particular value will give us all orders where that particular count of distinct products happened.

This simple approach can help to reveal business insights which would remain hidden with standard selections in product dimension.
But, let’s go a bit further. What if we want to start from a specific product and see all different sales combinations that happened?
Field Selection AND-mode
We’ll have to do a bit of scripting, but all operations will be quite basic. There are two main approaches I use.
First approach is really simple, flexible and great for data discovery, because all associations are nicely revealed with Qlik’s green, white and grey. One drawback is that the resulting table can grow to massive proportions with really large datasets.
1. Load all orders and products again into a separate table and name the product field differently
2. Join the same table to the previous one and repeat it as many times as many AND selections you want. Beware that this is a cross join of products on order so think carefully about the scale of data and go step by step to see the impact on memory. I join two times in this example.

3. It’s good to clean the resulting table a bit with a few conditional operations in order to dispose of irrelevant or duplicate combinations (example script is in the attached document)
4. (optional) If we use IDs instead of names in previous scripts (which is recommended), then we load the product dimension (along with some categories and types for more analytical options) to a separate table for each AND field.
Now we can filter Orders by product combinations and also see the next associative options:

Second Approach and it's variation using SET analysis
This one is much less memory demanding, but it doesn’t provide such a nice associative experience. It’s used when working with really large datasets (100s millions of rows) along with small number of distinct entities (e.g. up to 10 products on one order), or when the sequence of entities is relevant (accounting, production, service desk etc.).
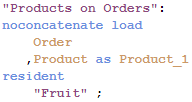
1. Concatenate all different products on one order to one line

2. Use SubField() function to put each product to a separate field. (Create this script with a FOR...Each loop if the maximum number of distinct products on order is not known beforehand.)

3. (optional) As with the previous approach it's recommended to use IDs and load separate product dimensions for each AND field.
If all scripts were executed successfully we get the desired AND-mode for selections in both cases.
All would be well, but there is one more requirement which is quite common – AND NOT mode. First approach will not help us with this but nothing is ever lost with Qlik. We can utilize variables and expression SET analysis along with the second approach. This basically creates a third approach > dynamic search in a list.
1. Create a concatenated field for all distinct products on order as with the second approach
2. Load product dimension again into separate tables. In our example we will have a selection for initial product(s), AND product(s) and AND NOT products.

3. Create variables that will be used to construct the SET analysis in expression.
- for initial products

- for AND products

- for AND-NOT products

4. Finally put all variables into SET analysis of the expression used in the chart

This will enable AND-mode as well as AND-NOT-mode in selections.

Check the attached file to see all 3 approaches in action. I've been successfully using these approaches in my projects, but I’m looking forward to hearing any comments and suggestions.
Radovan
PS: Thanks to Mária Šándorová ( @JaMajka1 ) for suggestions.
PPS: All challenges always have multiple solutions with Qlik. Similar functionality can be also achieved with P() and E() set functions, as described for example in this post - https://community.qlik.com/t5/Qlik-Design-Blog/Visualizing-comorbidity-Set-analysis-element-function-P/bc-p/1468751#M3621

-
Again - Qlik Sense - Text&Image objs flash several times before becoming steady
We've upgraded a Qlik Sense customer site to May 2023 Patch 6 (from a previous 2021 release) and Text&Image objects flash several times before becom... Show More
-
How to read .json files with Qlik Sense
Before you start reading: The way to import .json with Qlik Sense script is undocumented and may still change at any time without notice. Qlik scrip... Show MoreBefore you start reading: The way to import .json with Qlik Sense script is undocumented and may still change at any time without notice.
Qlik script natively reads JSON (JavaScript Object Notation), it is a bit tricky and slower for large files - and an import wizard is missing, which would create the script blocks.
When you click on Add data in the connection pane, the file dialog for the folder will show no specific filter for .json files:
Choose "All files" and then select your .json file. Next you will see, that the wizard attempts to interpret it as csv. Pointless, but at least you get the FROM construct properly filled. Forget the rest, as we will replace it in a minute.
Just hit "Insert script" and then put LOAD * in front of FROM, and instead of (txt ...) put (json):
data:
LOAD *
FROM [lib://:Google_Drive/119UHVSR9_JjkT9o-mz2NAO1xyS1xU56f/01.json]
(json);
Not too complicated so far. If your .json file only has one root object (or one root array of objects) and you will already get the keys from the top level. You are already done.
Now lets learn more about the parsing!
Simple JSON Object
A singe json file containing only one object ...
{"key1": 123, "key2": "abc", "key3": true, "arr": [], "obj": {} }... will result in one line of data.
- Keys with simple values will be 1:1 loaded into a Qlik Sense field
- arrays and sub-objects will get a 16 char hash-value (I will explain below)
Multi-elements JSON File
If the json file has multiple "rows" (objects in an outer array [ ... ]) you automatically will get multiple rows in Qlik.
[
  {"key1": 123, "key2": "abc", "key3": true}
, {"key1": 234, "key2": "def", "arr": [5,6,7]}
]
The arrays can have different keys. Common keys will concatenate in the same field, whereas keys missed out in a given 'row' will read "null" (unfortunately as text, not as Null()) in the result.
Now lets look, how to deal with sub-objects and arrays? For this we need understand the table is construct and the hash values.
- The root element has the pseudo-table name "Root"
- Every element in an array has an offset, starting with 0, even the outmost array. Hence, the first "row" above you would get with "Root/0"
- An object or an array will come back as a hash-value
- To get the object or array contents itself, alter the "table is" construct to address this key, e.g. in above example "Root/1/arr"
- If it is an array, you need to use the Pseudo key NoName to get the value and the key itself to get the hash value to link it to its parent
Importing JSON sub-arrays
That is fine for one row, but if you have a json file with many rows, you don't want to call every line with "Root/0/arr", "Root/1/arr", "Root/2/arr" ...
The good thing: You don't have to do it yourself. This article is explaining how to load .json by hand. If you want a quick solution, this one is for you: https://github.com/ChristofSchwarz/QlikScripts/tree/master/json
Assuming a .json file with this content
[
    {"name": "Alex"  , "age": 50, "kidsAge": [25,23,7,4] }
  , {"name": "Dhruv" , "age": 27, "kidsAge": [1] }
  , {"name": "Eyal"  , "age": 35, "kidsAge": [] }
  , {"name": "Chris" , "age": 49, "kidsAge": [17,19] }
]
We will introduce a FOR loop now. Note, if an array is empty [] or is null, the LOAD command inside the Loop would fail on that "row", so we set ErrorMode to 0 (=continue script upon error) and reset it to the default 1 (=fail on error) after the NEXT command
SET vFile = [lib://.../filename.json];

root:
LOAD
    name, age, kidsAge AS %kidsAge
FROM [$(vFile)] (json, table is 'Root');

SET ErrorMode = 0;
FOR v = 0 TO NoOfRows('root') - 1
    kidsAge:
    LOAD DISTINCT
        kidsAge AS %kidsAge,
        NoName AS kidsAge
    FROM [$(vFile)] (json, table is 'Root/$(v)/kidsAge');
NEXT v
SET ErrorMode = 1;
The result is a nice 1:N relation resolved.
The fieldname "kidsAge" also exists on the inner LOAD (next to "NoName") and it returns - yes - the same hashvalue as in the outer, first LOAD.
Importing Json sub-objects
Last example is for a sub-object (instead of the sub-array): Similarily, you get hashes on the parent level and the content itself when addressing it right with the "table is" position. A FOR loop will ease things again, plus some more logic.
In this .json file we have one row where "kids" is null and the subobject doesn't always contain the key "happy"
[
    {"name": "Alex"  , "age": 50, "kids": {"count": 4, "happy": true } }
  , {"name": "Dhruv" , "age": 27, "kids": {"count": 1, "happy": true } }
  , {"name": "Eyal"  , "age": 35, "kids": null}
  , {"name": "Chris" , "age": 49, "kids": {"count": 2 } }
]
We can't count on auto-concatenate any more for the sub-objects (row 4 would end up in a different table than rows 1 and 2). Also, without error-tolerance, the 3rd row import would fail. So we go for this script, where we create an empty table for the "kids" and then explicitly concatenate into it. We have to use the LOAD * functionality, because the structure of the subobjects is not identical throughout the main array. (Assuming you set the vFile yourself)
SET vFile = [lib://..../filename.json];

t_Root:
LOAD   // outer load
    *
FROM [$(vFile)] (json, table is 'Root');

SET ErrorMode = 0;
t_Kids: LOAD * INLINE [kids]; // start empty table

FOR v = 0 TO NoOfRows('t_Root') - 1
    CONCATENATE(t_Kids)
    LOAD DISTINCT   // inner load
        *
    FROM [$(vFile)] (json, table is 'Root/$(v)/kids');
NEXT v
SET ErrorMode = 1;
We will get now two tables, that are 1:1 related (or 1:1 or 0, to be precise)
Note: the inner LOAD * will return the "kids" as a field, too, containing the hash that links to the first table
The result can easily be used now in the Client
Uff, it can get tricky, but next week I will show you that all the manual steps (loop, field aliasing, concatenating) could be solved by a recursive SUB.
I hope though, that Qlik will also finish a wizard, that does that parsing on import like we have it for JSON objects received via the REST Connection or, likewise, as XML files are parsed.
Conclusion
Pros
- A surprise and already a good starting point for importing .json natively
- Everything can be imported using "table is" directive
Cons
- Quite some script logic needed to parse nested JSON objects
- Can be slow
- Still undocumented and may change in future
-
Mask or de-identify data for certain users using Section Access
In many industries including education and healthcare, it is necessary to mask or de-identify certain sensitive fields for certain user groups but als... Show MoreIn many industries including education and healthcare, it is necessary to mask or de-identify certain sensitive fields for certain user groups but also be able to see the data in total for the purposes of comparison or benchmarking.
This can be achieved by setting a flag in the section access table for users to determine whether they should see the real data or a masked version of the sensitive fields. In the example below, the code is restricting some fields for users at the individual school level but allowing schools to compare their results to the rest of the schools in the data set.
Please refer to the attached QVF and remember that Section Access does not function in Qlik Sense Desktop and must be deployed to a Qlik Sense Server environment. I've also attached the QVW for the QlikView solution.
Notes
- Uncomment the commented section of the code
- Change userA, userB and adminUser to users in your environment
- The solution works for both QlikView and Qlik Sense.
- Consider aggregating the de-identified facts to reduce the number of records in the app.
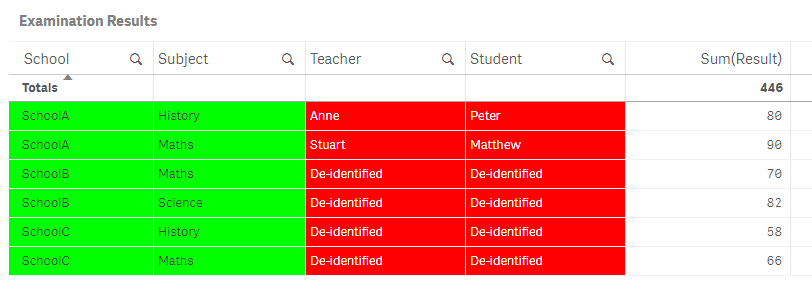
userA from SchoolA will see just Teacher and Student for School A records ONLY. All other schools will have the words De-identified in the Teacher and Student columns:
Credit to my colleague Yaniv Feldman yfe for this solution.
Matt Nunn
Qlik Consulting


