Unlock a world of possibilities! Login now and discover the exclusive benefits awaiting you.
- Qlik Community
- :
- All Forums
- :
- QlikView App Dev
- :
- Re: Block chart with equal segment heights/widths
- Subscribe to RSS Feed
- Mark Topic as New
- Mark Topic as Read
- Float this Topic for Current User
- Bookmark
- Subscribe
- Mute
- Printer Friendly Page
- Mark as New
- Bookmark
- Subscribe
- Mute
- Subscribe to RSS Feed
- Permalink
- Report Inappropriate Content
Block chart with equal segment heights/widths
Gurus,
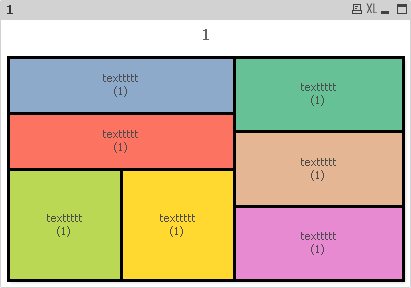
I want to create block chart with equal height/width irrespective of the proportional of data. I want to have the block in equal sizes.
Regards
Imran
- Mark as New
- Bookmark
- Subscribe
- Mute
- Subscribe to RSS Feed
- Permalink
- Report Inappropriate Content
You could try it with an expression like: dual(num(YourExpression, Format), 1)
- Marcus
- Mark as New
- Bookmark
- Subscribe
- Mute
- Subscribe to RSS Feed
- Permalink
- Report Inappropriate Content
Hi Khan,
If the below table is also ok for you :
You can try to use Funnel Chart, the setting is like below:
Important thing is Tip Width% = 99 and Equal Segment Heights.
You can see my attachment.
Thanks.
Aiolos
- Mark as New
- Bookmark
- Subscribe
- Mute
- Subscribe to RSS Feed
- Permalink
- Report Inappropriate Content
This solves my problem but now an additional 0(0) is coming which is not in the data.
- Mark as New
- Bookmark
- Subscribe
- Mute
- Subscribe to RSS Feed
- Permalink
- Report Inappropriate Content
Go to the tab dimensions and enable the surpressing of null-values for your dimension.
- Marcus
- Mark as New
- Bookmark
- Subscribe
- Mute
- Subscribe to RSS Feed
- Permalink
- Report Inappropriate Content
I have already marked this checkbox but still it is displaying zero.
Thanks & Regards
- Mark as New
- Bookmark
- Subscribe
- Mute
- Subscribe to RSS Feed
- Permalink
- Report Inappropriate Content
Then you could try to NULL it either with a condition within your origin expression or by checking their result, maybe with something like this:
dual(num(YourExpression, Format), if(YourExpression= 0, null(), 1))
- Marcus
- Mark as New
- Bookmark
- Subscribe
- Mute
- Subscribe to RSS Feed
- Permalink
- Report Inappropriate Content
Now it solves the problem but new problem arise. Now text is not coming complete.
Thanks & Regards
- Mark as New
- Bookmark
- Subscribe
- Mute
- Subscribe to RSS Feed
- Permalink
- Report Inappropriate Content
sorry Text is coming Incomplete.
- Mark as New
- Bookmark
- Subscribe
- Mute
- Subscribe to RSS Feed
- Permalink
- Report Inappropriate Content
It is just meaning that there is not enough space to display the complete text. I don't know if there is any way to force in which way the blocks are displayed in regard to their lengths and heights but I doubt that it will be possible.
So the simplest way would be to size the chart a bit larger so that it fits to lengths of the text. If not you could try to move the expression to the dimension and using then just 1 as expression - here an example what is meant:
=dual('texttttt ' & chr(10) & '(' & aggr(count(RowNo), RowNo) & ')', RowNo)
and in tab presenation only enabling to display the dimension-values resulted in a complete configurable string like:

- Marcus