Unlock a world of possibilities! Login now and discover the exclusive benefits awaiting you.
- Qlik Community
- :
- All Forums
- :
- QlikView App Dev
- :
- Count Distinct If
- Subscribe to RSS Feed
- Mark Topic as New
- Mark Topic as Read
- Float this Topic for Current User
- Bookmark
- Subscribe
- Mute
- Printer Friendly Page
- Mark as New
- Bookmark
- Subscribe
- Mute
- Subscribe to RSS Feed
- Permalink
- Report Inappropriate Content
Count Distinct If
Hi all,
I'm struggling with an expression from yesterday about count distinct. I'm quite sure there is a simple solution for my problem, but I'm not able to find it.
I've these data:
| ID | Sub_ID | value | target |
| 74 | 55,0000 | 50 | |
| 77 | 86,0000 | 90 | |
| 79 | 0 | 94,0000 | 95 |
| 79 | 1 | 91,0000 | 95 |
| 79 | 2 | 97,0000 | 95 |
| 105 | 6 | 11,4422 | 35 |
| 105 | 9 | 36,0000 | 35 |
| 105 | 2 | 123,0644 | 35 |
and I need to find the number of distinct ID for which the avg(value)>avg(target) - in this example the number is 2, because for ID 74 e 105 avg(value)>avg(target).
I tried with this expression:
Count(DISTINCT
IF( avg(valore)>avg([target]),
ID))
but it doesn't work because of avg function.
If I remove the avg function, using the following expression:
Count(DISTINCT
IF( (valore)>([target]),
ID))
I get a wrong result, in fact for example ID=79 is considered because there is at least one line where value is greater than target, even if avg(value) (94) is less than avg(target) (95) and it should not be considered.
Please, let me know if you have any suggestion.
Thanks in advance and best regards.
Accepted Solutions
- Mark as New
- Bookmark
- Subscribe
- Mute
- Subscribe to RSS Feed
- Permalink
- Report Inappropriate Content
When you nest aggregation functions you need to use the aggr function:
=Count(DISTINCT
IF( aggr( avg(value),ID) >aggr(avg([target]),ID),
ID))
talk is cheap, supply exceeds demand
- Mark as New
- Bookmark
- Subscribe
- Mute
- Subscribe to RSS Feed
- Permalink
- Report Inappropriate Content
When you nest aggregation functions you need to use the aggr function:
=Count(DISTINCT
IF( aggr( avg(value),ID) >aggr(avg([target]),ID),
ID))
talk is cheap, supply exceeds demand
- Mark as New
- Bookmark
- Subscribe
- Mute
- Subscribe to RSS Feed
- Permalink
- Report Inappropriate Content
Thanks a lot! It's perfect!
- Mark as New
- Bookmark
- Subscribe
- Mute
- Subscribe to RSS Feed
- Permalink
- Report Inappropriate Content
Hi Gysbert,
I've another doubt related to this topic and I try to expose it using an example.
I've this simple script:
Catalog:
LOAD * INLINE [
ID, Target
1,10
2,5
3,100
4,8
5,20
];
Values:
LOAD * INLINE [
ID,subID,DATE, Value
1, 1, 01/01/2014, 11
2, 1, 01/01/2014, 6
3, 1, 01/01/2014, 90
3, 2, 01/01/2014, 93
4, 1, 01/01/2014, 30
5, 1, 01/01/2014, 11
5, 2, 01/01/2014, 8
2, 1, 01/02/2014, 8
2, 2, 01/02/2014, 7
5, 1, 01/02/2014, 118
5, 2, 01/02/2014, 115
];
My goal is to find how many IDs have average values greater than target, for the selected month and the previous month.
Basically, with this sample data I've this situation:
| 01/01/2014 | 01/02/2014 | ||||
| ID | Target | =avg(Value) | On Target | =avg(Value) | On Target |
| 1 | 10 | 11 | Y | - | - |
| 2 | 5 | 6 | Y | 7,5 | Y |
| 3 | 100 | 91,5 | N | - | - |
| 4 | 8 | 30 | Y | - | - |
| 5 | 20 | 9,5 | N | 116,5 | Y |
Therefore I've 3 IDs On Target in January and 2 IDs On Target in February.
To calculate ID on target in selected month and in previous month I use this two expressions:
- Current Month:
=Count(DISTINCT
IF( aggr(avg(Value),ID)>Target,
ID)
)
- Previous Month:
=Count( DISTINCT
IF( aggr(avg({$<[DATE] = {"$(=(AddMonths(Date([DATE]),-1)))"}>} Value),ID)>Target,
ID)
)
The problem is that when I select February, I got a wrong result for IDs on Target in previous month. With this expression I got only 1 IDs for January but the correct result is 3.
I guess that the problem is because when I select february only ID 2 and 5 are considered, and therefore in January only one of this two is on target.
Do you have any suggestion on how can I consider all IDs with the previous expression?
- Mark as New
- Bookmark
- Subscribe
- Mute
- Subscribe to RSS Feed
- Permalink
- Report Inappropriate Content
Try adding the set modifier to the outer COUNT aggregation function too.
talk is cheap, supply exceeds demand
- Mark as New
- Bookmark
- Subscribe
- Mute
- Subscribe to RSS Feed
- Permalink
- Report Inappropriate Content
It works! Thanks again! You're a great EXPERT!
- Mark as New
- Bookmark
- Subscribe
- Mute
- Subscribe to RSS Feed
- Permalink
- Report Inappropriate Content
Hi Gysbert,
I was reading your post Calculating rolling n-period totals, averages or other aggregations but I'm not able to use it on my example.
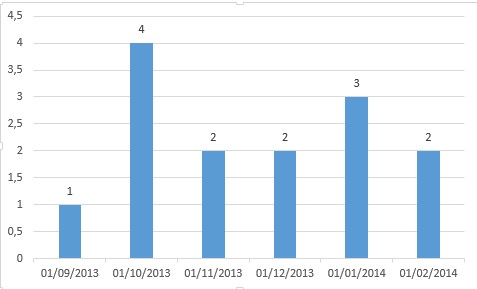
Basically I want to display this measure:
=Count(DISTINCT
IF( aggr(avg(Value),ID)>Target,
ID)
)
in a bar chart with last six motnhs in X axis (without considering the selected month). Here below an example usign previous sample data (with further data for additional months).
I've tryed with this expression:
=Count( {$<[DATE] = {">$(=(AddMonths(Date(Max([DATE])),-6)))"}>} DISTINCT
IF( aggr(avg({$<[DATE] = {">$(=(AddMonths(Date(Max([DATE])),-6)))"}>}Value),ID)>Target,
ID)
)
but it doesn't work.
I hope you can help me once again to find the correct solution.
Thanks in advance!
- Mark as New
- Bookmark
- Subscribe
- Mute
- Subscribe to RSS Feed
- Permalink
- Report Inappropriate Content
I was missing [DATE] parameter for the aggr() function.
The correct expression is as follow:
=Count( {$<[DATE] = {">$(=(AddMonths(Date(Max([DATE])),-6)))"}>} DISTINCT
IF( aggr(avg({$<[DATE] = {">$(=(AddMonths(Date(Max([DATE])),-6)))"}>}Value),[DATE],ID)>Target,
ID)
)