Unlock a world of possibilities! Login now and discover the exclusive benefits awaiting you.
- Qlik Community
- :
- All Forums
- :
- QlikView App Dev
- :
- Re: Dynamically finding correlations
- Subscribe to RSS Feed
- Mark Topic as New
- Mark Topic as Read
- Float this Topic for Current User
- Bookmark
- Subscribe
- Mute
- Printer Friendly Page
- Mark as New
- Bookmark
- Subscribe
- Mute
- Subscribe to RSS Feed
- Permalink
- Report Inappropriate Content
Dynamically finding correlations
Hello all,
I'm trying to figure out a way to dynamically show correlations between metrics. The metric names are grouped together in 1 field with another field showing the values. I'm changed this table in the script so that each metric is now it's own field associated with a value. I've kept the original table as well.
I'm trying to use the Correl function to show correlations between each metrics, however, there are nearly 80 metrics so making a correl function for each combination isn't really feasible. (ex: Correl(Metric1,Metric2), Correl(Metric1,Metric3), Correl(Metric2,Metric3), etc.)
Is there a way to make it dynamic to show correlation percentages for a selected metric? I.E. if Metric1 is selected, the chart would show all correlation values for Metric1)
Here's an example of the tables:
My original table looks like this:
| Account | Metric | Value |
|---|---|---|
| Account1 | Metric1 | 832 |
| Account1 | Metric2 | 1032 |
| Account1 | Metric3 | 213 |
| Account2 | Metric1 | 3213 |
| Account2 | Metric2 | 3432 |
| Account2 | Metric3 | 7689 |
| Account3 | Metric1 | 1034 |
| Account3 | Metric2 | 1340 |
| Account3 | Metric3 | 8903 |
I took this table and pivoted it in the script so that I have a 2nd table like this:
| Account | Metric1 | Metric2 | Metric3 |
|---|---|---|---|
| Account1 | 832 | 1032 | 213 |
| Account2 | 3213 | 3432 | 7689 |
| Account3 | 1034 | 1340 | 8903 |
Accepted Solutions
- Mark as New
- Bookmark
- Subscribe
- Mute
- Subscribe to RSS Feed
- Permalink
- Report Inappropriate Content
Actually try this:
If(GetSelectedCount(Metric) > 0, Correl({<_Metric = e(Metric)>}Value, _Value), Correl(Value, _Value))
- Mark as New
- Bookmark
- Subscribe
- Mute
- Subscribe to RSS Feed
- Permalink
- Report Inappropriate Content
Would you be able to share what you have? In like a qvw file and may be we can take it forward? and also share some information about the expected output?
- Mark as New
- Bookmark
- Subscribe
- Mute
- Subscribe to RSS Feed
- Permalink
- Report Inappropriate Content
Thank you for the reply Sunny.
I'm working on getting a sample QVW up. The expected output would be to have the metrics as the dimension (all metrics except the one selected) with the correlation percentage as the expression.
So for instance, if Metric1 is selected, the output would be something like this:
| Metric | Correlation |
|---|---|
| Metric2 | 80% |
| Metric3 | 50% |
| Metric4 | 3% |
| Metric5 | 68% |
Edit:
Or if Metric2 is selected:
| Metric | Correlation |
|---|---|
| Metric1 | 80% |
| Metric3 | 41% |
| Metric4 | 23% |
| Metric5 | 69% |
- Mark as New
- Bookmark
- Subscribe
- Mute
- Subscribe to RSS Feed
- Permalink
- Report Inappropriate Content
I've attached a sample QVW
- Mark as New
- Bookmark
- Subscribe
- Mute
- Subscribe to RSS Feed
- Permalink
- Report Inappropriate Content
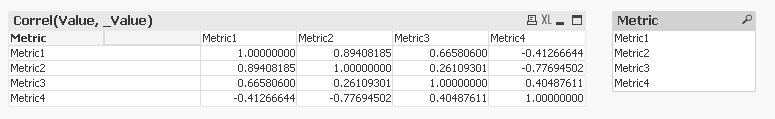
This is what you need?
No selection
- Mark as New
- Bookmark
- Subscribe
- Mute
- Subscribe to RSS Feed
- Permalink
- Report Inappropriate Content
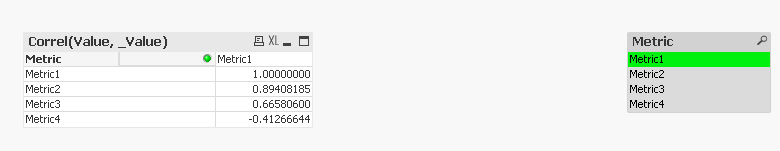
I feel like it's very close.
When you select a metric though I would not want to show that same metric in the dimension. For instance when you select Metric1, Metric1 would not appear on the chart since it will always have a correlation with itself if that makes sense.
I also don't want to use conditional shows for expressions since I will have so many combinations, it will be incredibly cumbersome.
- Mark as New
- Bookmark
- Subscribe
- Mute
- Subscribe to RSS Feed
- Permalink
- Report Inappropriate Content
Try this:
Correl({<_Metric = e(Metric)>}Value, _Value)
- Mark as New
- Bookmark
- Subscribe
- Mute
- Subscribe to RSS Feed
- Permalink
- Report Inappropriate Content
Actually try this:
If(GetSelectedCount(Metric) > 0, Correl({<_Metric = e(Metric)>}Value, _Value), Correl(Value, _Value))
- Mark as New
- Bookmark
- Subscribe
- Mute
- Subscribe to RSS Feed
- Permalink
- Report Inappropriate Content
That works! Thank you so much Sunny!! You saved me a lot of script load time as well by eliminating the reverse-crosstable!