Unlock a world of possibilities! Login now and discover the exclusive benefits awaiting you.
- Qlik Community
- :
- All Forums
- :
- QlikView App Dev
- :
- Re: Formula does not work
- Subscribe to RSS Feed
- Mark Topic as New
- Mark Topic as Read
- Float this Topic for Current User
- Bookmark
- Subscribe
- Mute
- Printer Friendly Page
- Mark as New
- Bookmark
- Subscribe
- Mute
- Subscribe to RSS Feed
- Permalink
- Report Inappropriate Content
Formula does not work
Hello,
Can anyone help me on that ? I have a Bar Chart where I want to show the evolution of the hardware units but in each column (so in each month) I want to show the delta of units from the current month vs the previous one.
As an example, if I have: January 22units sold / Februrary 32 units sold / March 15 units sold. Then I want the columns to show a bar as follows: February a total of +10units (this is 32-22 units) and March a total of -17units (this is 15-32 units).
I'm using the following formula but it does not work...
=num(sum({<Product={'Hardware'},Month={$(=Month)}>}Units) - sum({<Product={'Hardware'},Month={$(=(Month)-1)}>}Units))
Thanks!
dani
- Tags:
- new_to_qlikview
Accepted Solutions
- Mark as New
- Bookmark
- Subscribe
- Mute
- Subscribe to RSS Feed
- Permalink
- Report Inappropriate Content
Hi
As others have said, you cannot use set analysis in this context, but Above() may be what you need if you want to do the calculation in an expression and not in script. Something like this
=sum({<Product={'Hardware'}>}Units) - Above(sum({<Product={'Hardware'}>}Units))
(Above(TOTAL ...) if you have multiple dimensions)
HTH
Jonathan
- Mark as New
- Bookmark
- Subscribe
- Mute
- Subscribe to RSS Feed
- Permalink
- Report Inappropriate Content
Hi,
in set analysis it will not work.
you can calculate one more field at script level which will show the value after subtraction.
-Nilesh
- Mark as New
- Bookmark
- Subscribe
- Mute
- Subscribe to RSS Feed
- Permalink
- Report Inappropriate Content
You are not able to use set analysis in this case.
Either
1. Handle in load script level.
2. Create another expression and make it invisible.
Invisible Express (Helper): sum({<Product={'Hardware'}>}Units)
Actual Express for bar chart: =Helper - Above(Helper)
- Mark as New
- Bookmark
- Subscribe
- Mute
- Subscribe to RSS Feed
- Permalink
- Report Inappropriate Content
Dani,
Set Analysis are computed ONCE per chart. They cannot return different values according to the row or column of the chart. So, it will certainly not work.
If you want different result per line/row:
You will need to use functions like above() or before()
You will need to modify your model. See a doc I have written on that topic: http://community.qlik.com/docs/DOC-4821
Fabrice
- Mark as New
- Bookmark
- Subscribe
- Mute
- Subscribe to RSS Feed
- Permalink
- Report Inappropriate Content
Hi Dani, why don't you calculate the shift in the script and use the simple expression (Units Sold - Shift) in your bar chart.
See example below: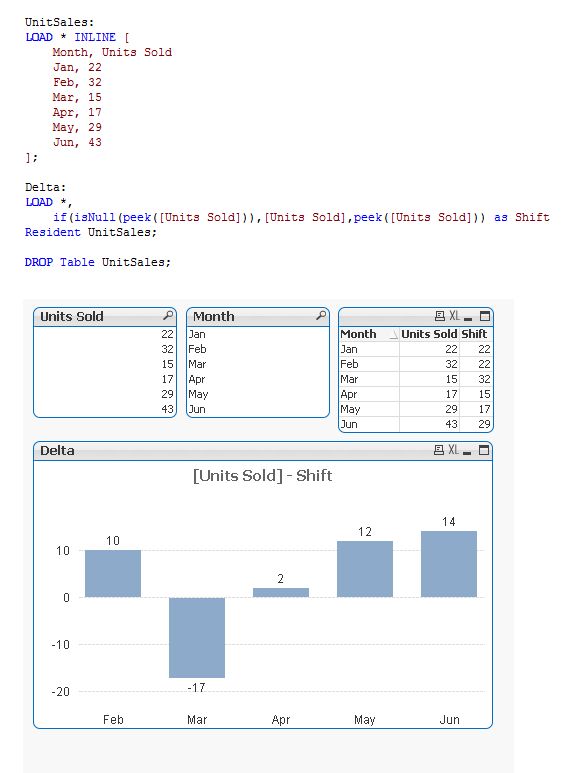
- Mark as New
- Bookmark
- Subscribe
- Mute
- Subscribe to RSS Feed
- Permalink
- Report Inappropriate Content
Hi,
try this
=num(sum({<Product={'Hardware'},Month={'$(=Month)'}>}Units)) - num(sum({<Product={'Hardware'},Month={$(=Month(MonthStart(Max(Date))-1))}>}Units))
Please appreciate our Qlik community members by giving Kudos for sharing their time for your query. If your query is answered, please mark the topic as resolved 🙂
- Mark as New
- Bookmark
- Subscribe
- Mute
- Subscribe to RSS Feed
- Permalink
- Report Inappropriate Content
Hi
As others have said, you cannot use set analysis in this context, but Above() may be what you need if you want to do the calculation in an expression and not in script. Something like this
=sum({<Product={'Hardware'}>}Units) - Above(sum({<Product={'Hardware'}>}Units))
(Above(TOTAL ...) if you have multiple dimensions)
HTH
Jonathan
- Mark as New
- Bookmark
- Subscribe
- Mute
- Subscribe to RSS Feed
- Permalink
- Report Inappropriate Content
many thanks all !!! issue resolved 