Unlock a world of possibilities! Login now and discover the exclusive benefits awaiting you.
- Qlik Community
- :
- All Forums
- :
- QlikView App Dev
- :
- Generate a line Chart
- Subscribe to RSS Feed
- Mark Topic as New
- Mark Topic as Read
- Float this Topic for Current User
- Bookmark
- Subscribe
- Mute
- Printer Friendly Page
- Mark as New
- Bookmark
- Subscribe
- Mute
- Subscribe to RSS Feed
- Permalink
- Report Inappropriate Content
Generate a line Chart
Hello Together,
unfortunately, I could find nothing in the forum and need some help.
Given:
The field [date] has, for example, 4 records. To every [date] there is n [values].
To every [date] there is in the field n [values].
For example:
5/5/2010-> 10; 10 ; 13 sum= 33
5/6/2010-> 8; 9 sum= 17
5/7/2010-> 12 sum= 12
5/8/2010-> 5; 8; 10 sum= 23
the goal:
I want a line chart. The X-axis should indicate the available [date], e.g., 5/5/2010, 5/6/2010 5/7/2010 ...
For the date 5/5/2010 the sum 33 = 33 should be associated. y = 33
For the date 5/6/2010 the sum 33 + 17 = 50 should be associated. y = 50
For the date 5/7/2010 the sum 33+17+12 = 62 should be associated. y = 62
For the date 5/8/2010 the sum 33+17+12+ 23 = 85 should be associated. y = 85
How I do make this? How must the formula look in the chart? Thank you very much !
- Tags:
- full_accumulation
- Mark as New
- Bookmark
- Subscribe
- Mute
- Subscribe to RSS Feed
- Permalink
- Report Inappropriate Content
Please read this
- Mark as New
- Bookmark
- Subscribe
- Mute
- Subscribe to RSS Feed
- Permalink
- Report Inappropriate Content
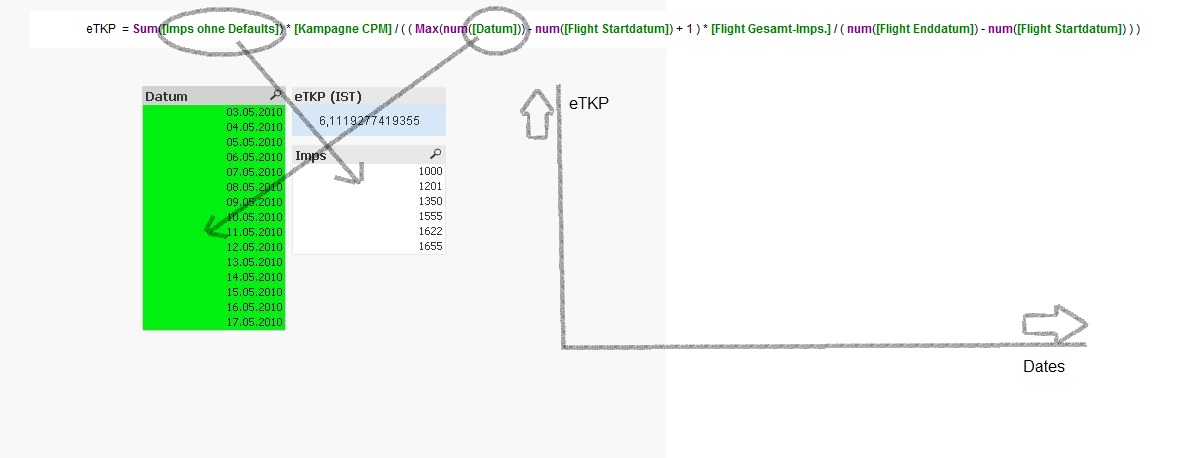
In the line chart the date fields [Datum] should stand in X axes.
In the Y axis the respective values eTKP
Here the value pairs (X, Y):
(03.05.2010 ; 7,018623737213 )
(04.05.2010 ; 6,806580684582 )
(05.05.2010 ; 6,735899667585 )
(06.05.2010 ; 6,700559159188 )
(07.05.2010 ; 6,679354854183 )
I owe you one !
- Mark as New
- Bookmark
- Subscribe
- Mute
- Subscribe to RSS Feed
- Permalink
- Report Inappropriate Content
thank you
- Mark as New
- Bookmark
- Subscribe
- Mute
- Subscribe to RSS Feed
- Permalink
- Report Inappropriate Content
Hi
On the Expression tab of chart, click on check box full accumaltion and values on data points and i think you should get what you are expecting. If not please post the expected result as you mention in first post.
Thank you
- Mark as New
- Bookmark
- Subscribe
- Mute
- Subscribe to RSS Feed
- Permalink
- Report Inappropriate Content
Hi devang,
sorry, but the full accumulate dont show me the expected values.
I want a graph with the posted values.
Look at the eTKP value for each date.
Please help.
- Mark as New
- Bookmark
- Subscribe
- Mute
- Subscribe to RSS Feed
- Permalink
- Report Inappropriate Content
Hi There,
can somebody help me ?
Thank You
- Mark as New
- Bookmark
- Subscribe
- Mute
- Subscribe to RSS Feed
- Permalink
- Report Inappropriate Content
Try switching on Full Acumulation for the expression in the line chart, this should answer it for you and is the easiest way to do it.
- Mark as New
- Bookmark
- Subscribe
- Mute
- Subscribe to RSS Feed
- Permalink
- Report Inappropriate Content
Hello,
unfortunately, this does not help me. The result with full accumulation, accumulates all y values.
And thats not what i am searching for. I have made some screenshots. I hope. it is now unequivocal what I want to do.
Many greetings,
honour
- Mark as New
- Bookmark
- Subscribe
- Mute
- Subscribe to RSS Feed
- Permalink
- Report Inappropriate Content
1.
- Mark as New
- Bookmark
- Subscribe
- Mute
- Subscribe to RSS Feed
- Permalink
- Report Inappropriate Content
2.