Unlock a world of possibilities! Login now and discover the exclusive benefits awaiting you.
- Qlik Community
- :
- All Forums
- :
- QlikView App Dev
- :
- Re: How can I add values on Y axis?
- Subscribe to RSS Feed
- Mark Topic as New
- Mark Topic as Read
- Float this Topic for Current User
- Bookmark
- Subscribe
- Mute
- Printer Friendly Page
- Mark as New
- Bookmark
- Subscribe
- Mute
- Subscribe to RSS Feed
- Permalink
- Report Inappropriate Content
How can I add values on Y axis?

Accepted Solutions
- Mark as New
- Bookmark
- Subscribe
- Mute
- Subscribe to RSS Feed
- Permalink
- Report Inappropriate Content
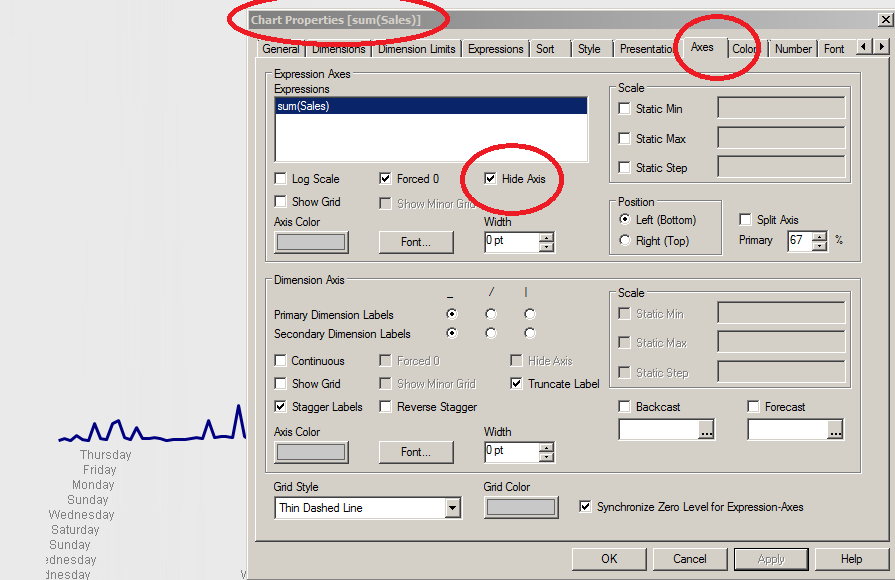
Ok. I think you are saying that you would like to see the axis but that you cannot. If that is the case, it sounds like you inherited this QVW from someone has hidden the axis and you aren't aware how that was done. Can you confirm if this is the scenario you are encountering ?
Other ways to hide the axis is to change the font to be transparent , change axis color to be transparent and change axis width to be 0pt. Is any of this the case ? All 3 of these properties are visible from the screenshot above (axis tab).
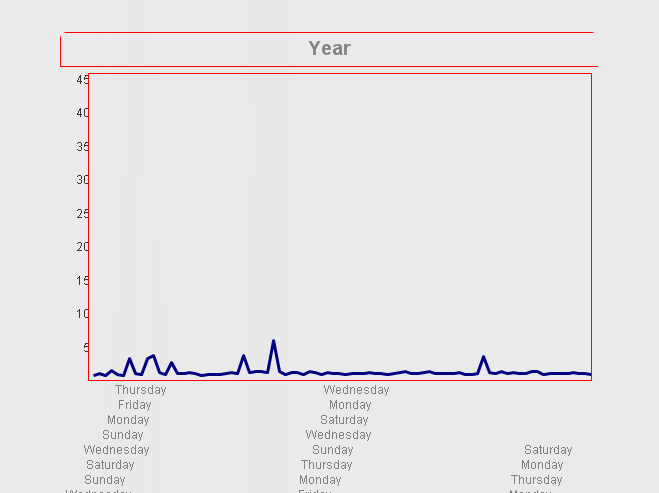
Also , the chart may have been sized to hide the objects, if you hold down the CTRL and SHIFT keys and click in your chart, you can resize the chart objects by moving the red bars. See below how i resized to partially obscure the axis... you can completely obscure using this approach so check that as well

- Mark as New
- Bookmark
- Subscribe
- Mute
- Subscribe to RSS Feed
- Permalink
- Report Inappropriate Content
Is your axis hidden ? See below 
- Mark as New
- Bookmark
- Subscribe
- Mute
- Subscribe to RSS Feed
- Permalink
- Report Inappropriate Content
No it is not.
- Mark as New
- Bookmark
- Subscribe
- Mute
- Subscribe to RSS Feed
- Permalink
- Report Inappropriate Content
Ok. I think you are saying that you would like to see the axis but that you cannot. If that is the case, it sounds like you inherited this QVW from someone has hidden the axis and you aren't aware how that was done. Can you confirm if this is the scenario you are encountering ?
Other ways to hide the axis is to change the font to be transparent , change axis color to be transparent and change axis width to be 0pt. Is any of this the case ? All 3 of these properties are visible from the screenshot above (axis tab).
Also , the chart may have been sized to hide the objects, if you hold down the CTRL and SHIFT keys and click in your chart, you can resize the chart objects by moving the red bars. See below how i resized to partially obscure the axis... you can completely obscure using this approach so check that as well
