Unlock a world of possibilities! Login now and discover the exclusive benefits awaiting you.
- Qlik Community
- :
- All Forums
- :
- QlikView App Dev
- :
- Re: How to only select values beloning to the spec...
- Subscribe to RSS Feed
- Mark Topic as New
- Mark Topic as Read
- Float this Topic for Current User
- Bookmark
- Subscribe
- Mute
- Printer Friendly Page
- Mark as New
- Bookmark
- Subscribe
- Mute
- Subscribe to RSS Feed
- Permalink
- Report Inappropriate Content
How to only select values beloning to the specific month?
Hi,
In my application I'm using a Master Calendar which works just fine.
Now I've got an Excel sheet with values for every month and every quarter, live this:
| Number | January | February | Q1 |
|---|---|---|---|
| 3.1 | 250 | 100 | 200 |
| 3.2 | 900 | 100 | 299 |
| 3.3 | 400 | 700 | 400 |
This is for all the months of the year and for all quarters.
What I want to achieve is the following.
A bar chart where all the values are displayed for each month.
So basically the Month field from the calendar is the dimension. For each month it has to display the corresponding value from the sheet. How can I achieve this? The same applies for when I use Quarter as a dimension.
For example:
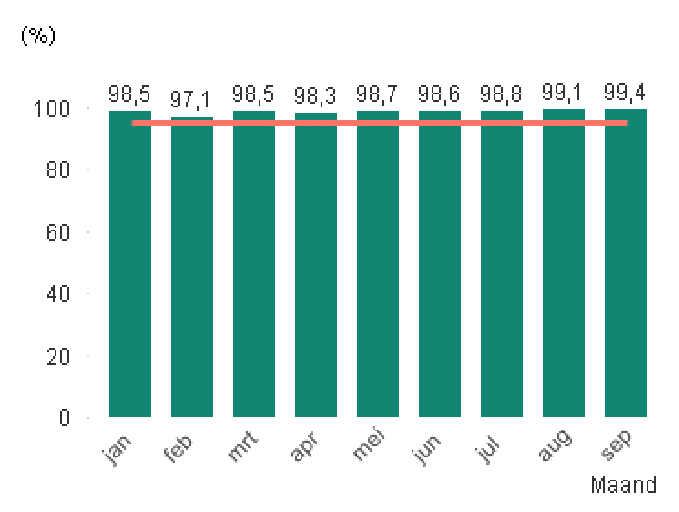
I want to create a bar chart like this (dont mind the red line).
So in stead of the values above, I get the following:
January: 250
Februari: 100
etc. etc.
Message was edited by: Nazeem Soeltan
Added excel sheet.
- Mark as New
- Bookmark
- Subscribe
- Mute
- Subscribe to RSS Feed
- Permalink
- Report Inappropriate Content
Can you explain little more with an example please... Didn't understand from your question itself.. Thanks
- Mark as New
- Bookmark
- Subscribe
- Mute
- Subscribe to RSS Feed
- Permalink
- Report Inappropriate Content
Hi i've added an example in the first post.
- Mark as New
- Bookmark
- Subscribe
- Mute
- Subscribe to RSS Feed
- Permalink
- Report Inappropriate Content
Not sure if I understand the requirement. Data Model wise I would turn this crosstab table into a longer table.
The data is much easier to work with like this:
Number | Month | Value |
| 3.1 | Jan | 250 |
| 3.2 | Jan | 900 |
| 3.3 | Jan | 400 |
| 3.1 | Feb | 100 |
| 3.2 | Feb | 100 |
| 3.3 | Feb | 700 |
Do the monthly numbers not aggregate to the quarter numbers?
If that is the case you might want to change the month column to a Time Period Column.
I am not the best modeler, but this is how I would approach it, it just seems easier to consume in QV to me.
- Mark as New
- Bookmark
- Subscribe
- Mute
- Subscribe to RSS Feed
- Permalink
- Report Inappropriate Content
That seems a good solution. Any idea how I can make this in the script?
I've added the QVW file in the first post. The table: KPI contains the excel import.
The Master Calendar is to be found in Kalender table.
- Mark as New
- Bookmark
- Subscribe
- Mute
- Subscribe to RSS Feed
- Permalink
- Report Inappropriate Content
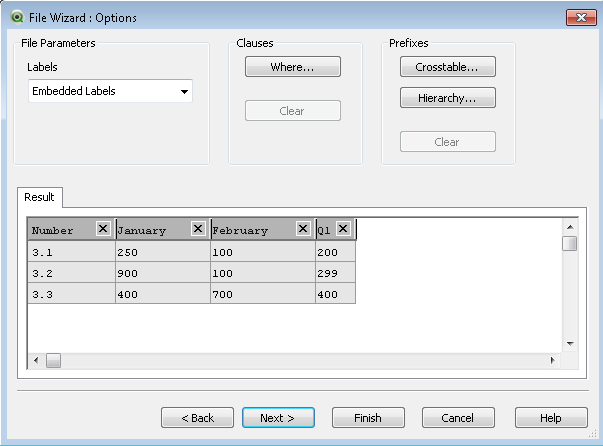
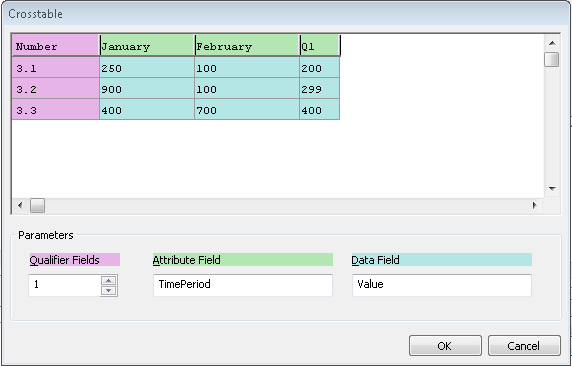
This is the third screen of the table wizard. There you select CrossTable.
After you hit next you need to fill it out like this:
I use this a lot for Excel files my users give me, because having a dimension across the columns is pretty common in Excel. Your measures need to be at the end, but they usually are.
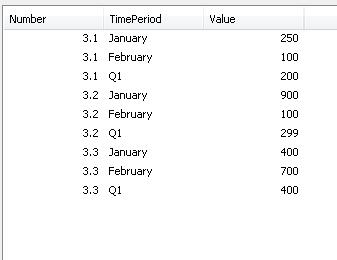
The Table looks like this:
- Mark as New
- Bookmark
- Subscribe
- Mute
- Subscribe to RSS Feed
- Permalink
- Report Inappropriate Content
Wow, thank you so much!
Do you know how to make the link between the fields from the Master Calendar?
For example, if I use Calendar.Month, that only Jan - Dec is selected?
- Mark as New
- Bookmark
- Subscribe
- Mute
- Subscribe to RSS Feed
- Permalink
- Report Inappropriate Content
Since the quarters aren't cumulative, I am not 100% sure how I would set that up.
I could get you to the months by changnig the column name. I would probably do some manipulation and maybe create either a second table for the Quarter KPIS or a field IDing the other Periods.
It is a little sloppy, but I think you could do:
Number, Month, Quarter, Year, Value
Then just have null values for the attributes you aren't using.
- Mark as New
- Bookmark
- Subscribe
- Mute
- Subscribe to RSS Feed
- Permalink
- Report Inappropriate Content
I'm sorry do you have an example, as this isn't my strongest point..
But your solution seems reasonable.
CrossTable(KPI.Tijdsperiode, KPI.Waarde, 6)
LOAD Perceel as KPI.Perceel,
Nummer as KPI.Nummer,
Omschrijving as KPI.Omschrijving,
[Norm per jaar] as [KPI.Norm per jaar],
[Norm per kwartaal] as [KPI.Norm per kwartaal],
[Norm per maand] as [KPI.Norm per maand],
Jan,
Feb,
Mrt,
Apr,
Mei,
Juni,
Juli,
Aug,
Sept,
Okt,
Nov,
Dec,
Q1,
Q2,
Q3,
Q4
FROM
(ooxml, embedded labels, table is [Normen en vaste waardes]);
THis is what i've got.
KPI.Tijdsperiode = TimePeriod.
KPI.Waarde = Value.
- Mark as New
- Bookmark
- Subscribe
- Mute
- Subscribe to RSS Feed
- Permalink
- Report Inappropriate Content
I attached a version of what I am suggesting. It is really sloppy, and I am not 100% sure it will work.
You could also do something similar and create a second table. Someone else might suggest something more standard data model wise, I think mine might not be perfect.
Good luck. I won't be back for a few days.