Unlock a world of possibilities! Login now and discover the exclusive benefits awaiting you.
- Qlik Community
- :
- All Forums
- :
- QlikView App Dev
- :
- Re: How we will go from text object to Chart in th...
- Subscribe to RSS Feed
- Mark Topic as New
- Mark Topic as Read
- Float this Topic for Current User
- Bookmark
- Subscribe
- Mute
- Printer Friendly Page
- Mark as New
- Bookmark
- Subscribe
- Mute
- Subscribe to RSS Feed
- Permalink
- Report Inappropriate Content
How we will go from text object to Chart in the below scenario
Hi All,
Can you please find the below attached QVW which is there in installation folders--Examples->
is this container for text objects or what?
Please let me know..
- Mark as New
- Bookmark
- Subscribe
- Mute
- Subscribe to RSS Feed
- Permalink
- Report Inappropriate Content
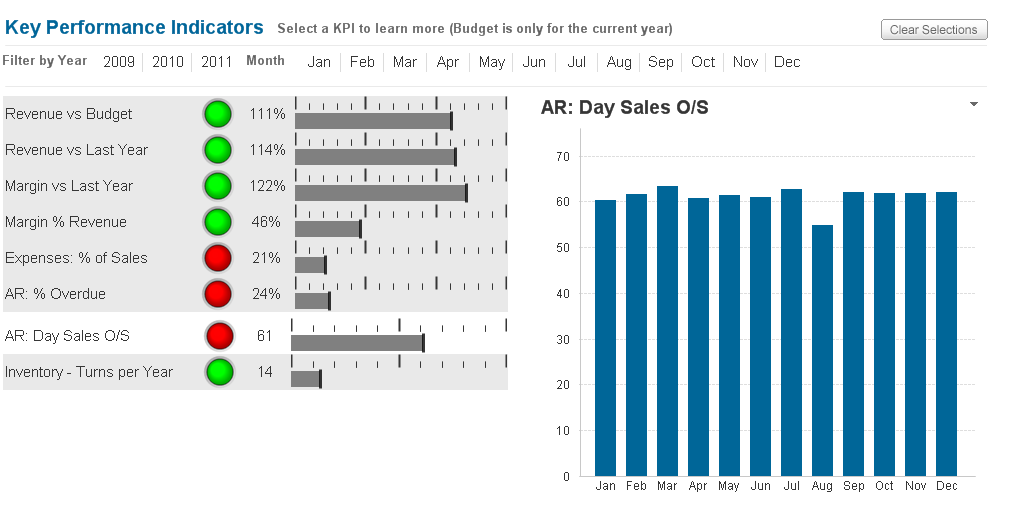
The left part of the screen contains a straight table with probably 1 dimension and three expressions. The first one has Image as representation setting, the second Text and the third Linear Gauge.
talk is cheap, supply exceeds demand
- Mark as New
- Bookmark
- Subscribe
- Mute
- Subscribe to RSS Feed
- Permalink
- Report Inappropriate Content
It's a series of text box overlaying straight table charts, switch on the design grid, so you can see the elements and just experiment by right clicking, just like I did!
HTH
Andy
- Mark as New
- Bookmark
- Subscribe
- Mute
- Subscribe to RSS Feed
- Permalink
- Report Inappropriate Content
Yeah i have seen that expressions and dimension over there
But am not understanding how can it hide and show when am selecting the text objects
Regards
Sonysree
- Mark as New
- Bookmark
- Subscribe
- Mute
- Subscribe to RSS Feed
- Permalink
- Report Inappropriate Content
The text boxes have actions assigned to them that change the value of a variable. Right click a text box, choose Properties and check out the Actions tab. The variable is used by the charts to show/hide themselves. Look at the Conditional expression on the Layout tab of the properties window of the charts.
talk is cheap, supply exceeds demand
- Mark as New
- Bookmark
- Subscribe
- Mute
- Subscribe to RSS Feed
- Permalink
- Report Inappropriate Content
Can you please share any Qliksense Document to explore some thing.