Unlock a world of possibilities! Login now and discover the exclusive benefits awaiting you.
- Qlik Community
- :
- All Forums
- :
- QlikView App Dev
- :
- Re: Incorrect number of rows when exporting a char...
- Subscribe to RSS Feed
- Mark Topic as New
- Mark Topic as Read
- Float this Topic for Current User
- Bookmark
- Subscribe
- Mute
- Printer Friendly Page
- Mark as New
- Bookmark
- Subscribe
- Mute
- Subscribe to RSS Feed
- Permalink
- Report Inappropriate Content
Incorrect number of rows when exporting a chart to excel
Hi,
I am trying to export a straight table to excel. When in QlikView, the number of rows is 4,661 rows but when I export it to an excel sheet the number of rows decrease to 4,006. I am not sure why this inconsistency?
Thanks.
Regards,
Deepti Singh
- « Previous Replies
-
- 1
- 2
- Next Replies »
- Mark as New
- Bookmark
- Subscribe
- Mute
- Subscribe to RSS Feed
- Permalink
- Report Inappropriate Content
HI deepti,
Please share your qvw and also your excel sheet that time we will understood what is the reason behind that,
try also autonumber().
Regards,
Gireesh.
- Mark as New
- Bookmark
- Subscribe
- Mute
- Subscribe to RSS Feed
- Permalink
- Report Inappropriate Content
deepti,
I'm pretty sure that QlikView is taking rows that are duplicates and displaying them once in your chart. This is normal QV behavior. If you have a field that is a uniqu identifier for each record (RowNo() as LineNo in script), and you include that field in the chart, the duplicate records will all be displayed.
- Mark as New
- Bookmark
- Subscribe
- Mute
- Subscribe to RSS Feed
- Permalink
- Report Inappropriate Content
Hi,
Don't understand why scrambling doesn't help. If you scramble all the fields the data is just junk.
Bill
To help users find verified answers, please don't forget to use the "Accept as Solution" button on any posts that helped you resolve your problem or question.
- Mark as New
- Bookmark
- Subscribe
- Mute
- Subscribe to RSS Feed
- Permalink
- Report Inappropriate Content
Ramon,
Never mind. I changed the settings.
View>>Statusbar when I enable this I can see the row count at the bottom. And the row count is 4006 and that's what the excel is showing.
There is another thing that I noticed, when I disable the Suppress Zero-Values and Suppress Missing in the Properties then the row count in the chart remains the same 4,661 but the excel count increases to 4,279. There are still 382 rows missing in the excel.
- Mark as New
- Bookmark
- Subscribe
- Mute
- Subscribe to RSS Feed
- Permalink
- Report Inappropriate Content
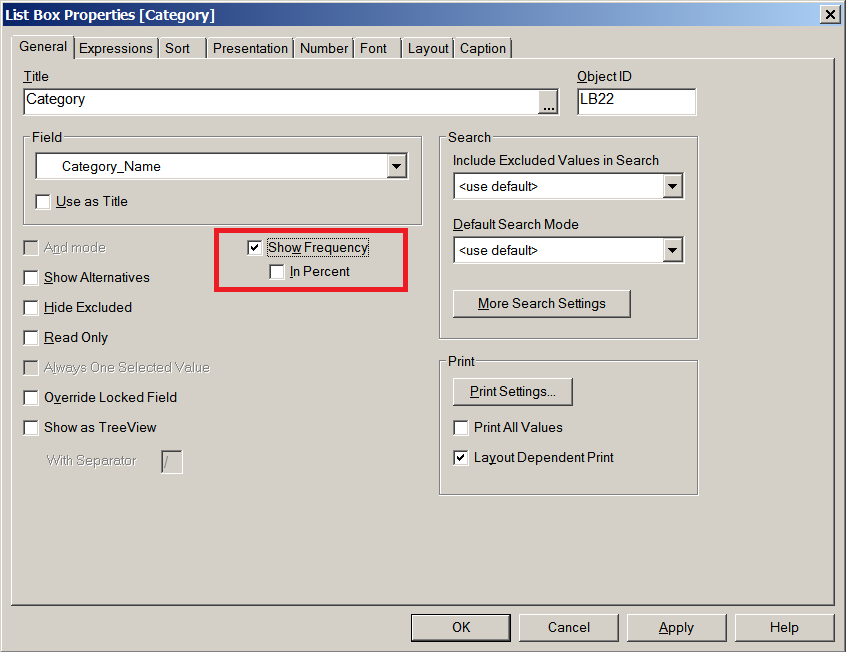
You will have to look at the fields in the table. Create list box for each and set show frequency and see what that looks like.
Bill
To help users find verified answers, please don't forget to use the "Accept as Solution" button on any posts that helped you resolve your problem or question.
- Mark as New
- Bookmark
- Subscribe
- Mute
- Subscribe to RSS Feed
- Permalink
- Report Inappropriate Content
Mike,
I did that and it worked. The field ID that I used in the expression (num(count($(=estrTradeRanges) DISTINCT ID), '#,##0') & ' rows' ) was not included in the chart, but when I included in the chart, The rows matched in all the three places i.e., the chart, the row count at the bottom and while exporting to excel.
Thanks.
Regards,
Deepti Singh.
- Mark as New
- Bookmark
- Subscribe
- Mute
- Subscribe to RSS Feed
- Permalink
- Report Inappropriate Content
I have a similar issue with an app where when picking a range of years and months as well as apps to review usage on, when the chart is first exported I do not get all the rows of data but the second export of the same data set I do get all of the rows. We are using Excel 2010 and QV 11.2 SR12. Any ideas on this one anyone??
Thank you,
Craig Leite
- « Previous Replies
-
- 1
- 2
- Next Replies »