Unlock a world of possibilities! Login now and discover the exclusive benefits awaiting you.
- Qlik Community
- :
- All Forums
- :
- QlikView App Dev
- :
- Re: Problem filling values in empty fields
- Subscribe to RSS Feed
- Mark Topic as New
- Mark Topic as Read
- Float this Topic for Current User
- Bookmark
- Subscribe
- Mute
- Printer Friendly Page
- Mark as New
- Bookmark
- Subscribe
- Mute
- Subscribe to RSS Feed
- Permalink
- Report Inappropriate Content
Problem filling values in empty fields
Hi all,
I'm pretty new to scripting in Qlikview and am having trouble bring together data from two tables to show new customer run-off.
My company sells to new customers who sign up for our service and we want to follow up on the drop-off rates as time goes by. So in one table i have the original number of customers signed up and in the second table I have the number of customers remaining from the original sales month.
So far so good but I need to add the original sales number even to those months that there is no customers left. So if we sell to 100 customers in Jan, and the remaining customers number is 100 in Jan, 80 in Feb, 60 in Mar & 0 in April I need to connect the original sales number to April despite having a null value for April.
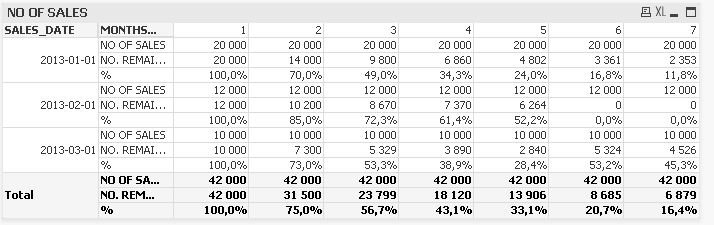
I've created an example where sales from Feb 2013 have no remaining customers in after 6 or 7 months for Product A in Country Y.
| SALES_DATE | MONTHS_SINCE_SALES | 1 | 2 | 3 | 4 | 5 | 6 | 7 |
| 2013-02-01 | NO OF SALES | 12 000 | 12 000 | 12 000 | 12 000 | 12 000 | - | - |
| 2013-02-01 | NO. REMAINING | 12 000 | 10 200 | 8 670 | 7 370 | 6 264 | - | - |
| 2013-02-01 | % | 100,0% | 85,0% | 72,3% | 61,4% | 52,2% | - | - |
This should look like this:
| SALES_DATE | MONTHS_SINCE_SALES | 1 | 2 | 3 | 4 | 5 | 6 | 7 |
| 2013-02-01 | NO OF SALES | 12 000 | 12 000 | 12 000 | 12 000 | 12 000 | 12 000 | 12 000 |
| 2013-02-01 | NO. REMAINING | 12 000 | 10 200 | 8 670 | 7 370 | 6 264 | - | - |
| 2013-02-01 | % | 100,0% | 85,0% | 72,3% | 61,4% | 52,2% | 0,0% | 0,0% |
I've tried both Peek () and iterco() & while but am to unfamiliar with these to understand how to use it.
The goal is to be able to look at a chart which plots % remaining on the Y axis with MONTHS_SINCE_SALES on the X axis and to be able to drill down on this.
Any of you experts out there know how to help me out?
Any advice much appreciated!
- Tags:
- qlikview_scripting
- Mark as New
- Bookmark
- Subscribe
- Mute
- Subscribe to RSS Feed
- Permalink
- Report Inappropriate Content
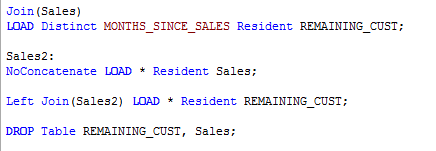
Hi Alan,
Hope I understood it right...please find a qvw file with a solution attached.
- Mark as New
- Bookmark
- Subscribe
- Mute
- Subscribe to RSS Feed
- Permalink
- Report Inappropriate Content
Hi Daniel!
Big thank you for the quick response - the solution you wrote sorted out my problem perfectly.
I realised though that i had missed part of the problem - that part when dealing with those SALES_DATE periods which are newer and where the possible age of data is less than the max for other SALES_DATE period.
eg. now in November 2014 I only have 1 month of data for sales in October 2014, 2 months of data for Sales from September 2014, etc, etc).
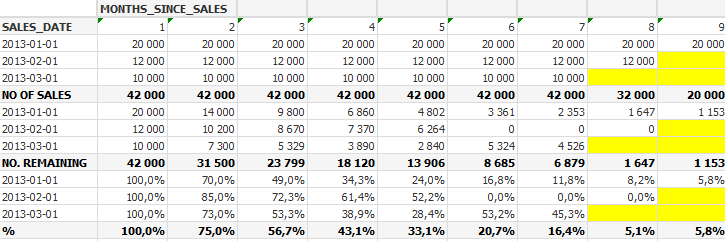
In the below example, when working out the total in MONTHS_SINCE_SALES column 8 the "base" should be 32 000 and in column 9 it should be 20 000.
Sorry for missing this from my initial question (i realise how annoying badly defined questions are!).
If you know of a quick solution to this problem it'd be great but I already appreciate the help with the initial question!
Thanks
Alan !
- Mark as New
- Bookmark
- Subscribe
- Mute
- Subscribe to RSS Feed
- Permalink
- Report Inappropriate Content
Hi Alan,
At the moment I dont see any quick solution...sorry. But it might be not too difficult. Maybe post this problem again in a new thread and with a bit more explanation - I am sure some of the experts find a solution.
If I find time this week, I will also have a look again.
Good luck
Daniel
- Mark as New
- Bookmark
- Subscribe
- Mute
- Subscribe to RSS Feed
- Permalink
- Report Inappropriate Content
Will do, Daniel! Really appreciate the quick response and the solution to my first question (it helps me extract to Excel where i can get a report of what I need)
All the best!
Alan
- Mark as New
- Bookmark
- Subscribe
- Mute
- Subscribe to RSS Feed
- Permalink
- Report Inappropriate Content
Hello,
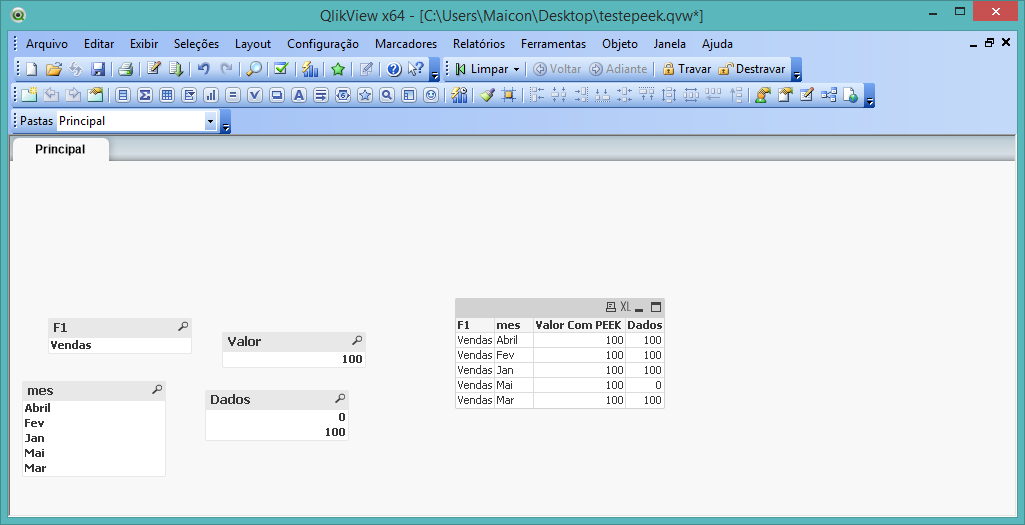
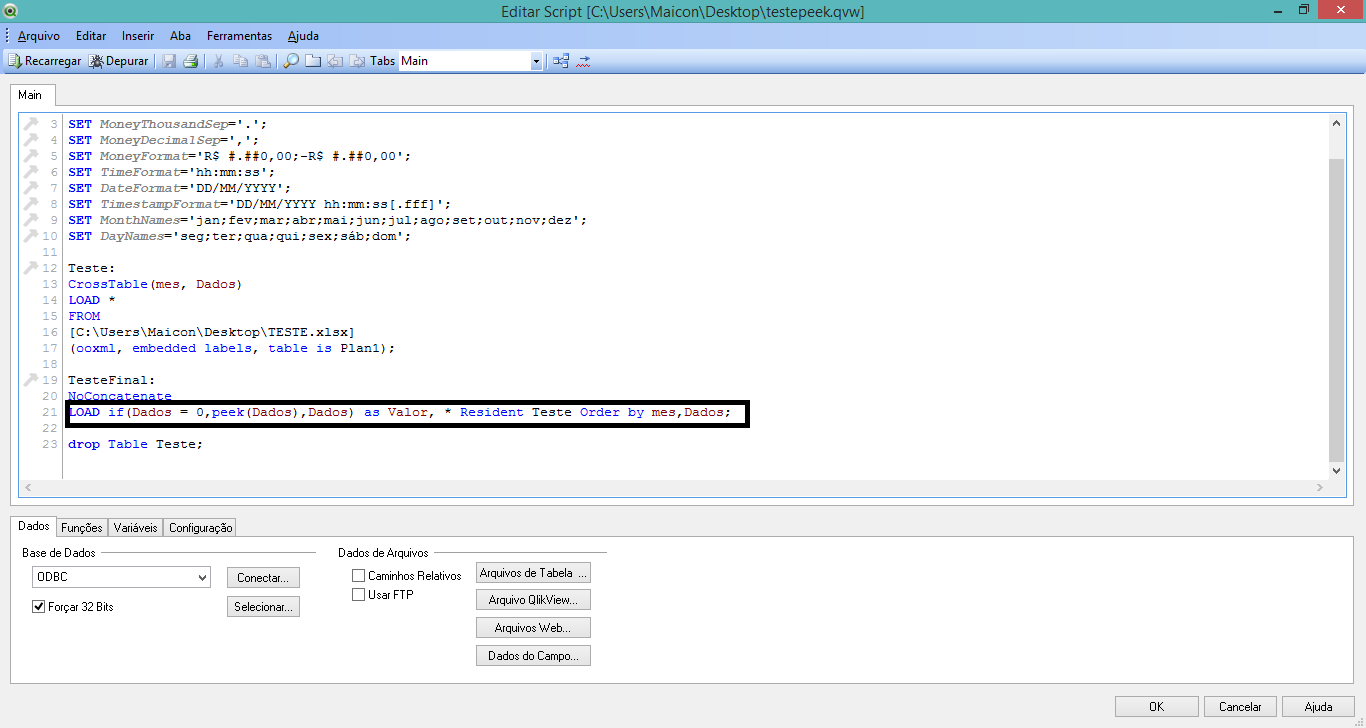
I believe this va solve your problem.
if(Dados = 0,peek(Dados),Dados) as Valor, * Resident Teste Order by mes,Dados;
The peek command must always have the order by.
Hope this helps.