Unlock a world of possibilities! Login now and discover the exclusive benefits awaiting you.
- Qlik Community
- :
- All Forums
- :
- QlikView App Dev
- :
- QlikView - change bar chart dimension label
- Subscribe to RSS Feed
- Mark Topic as New
- Mark Topic as Read
- Float this Topic for Current User
- Bookmark
- Subscribe
- Mute
- Printer Friendly Page
- Mark as New
- Bookmark
- Subscribe
- Mute
- Subscribe to RSS Feed
- Permalink
- Report Inappropriate Content
QlikView - change bar chart dimension label
Hi,
I've attached a qvw sample and its data file.
I have two questions.
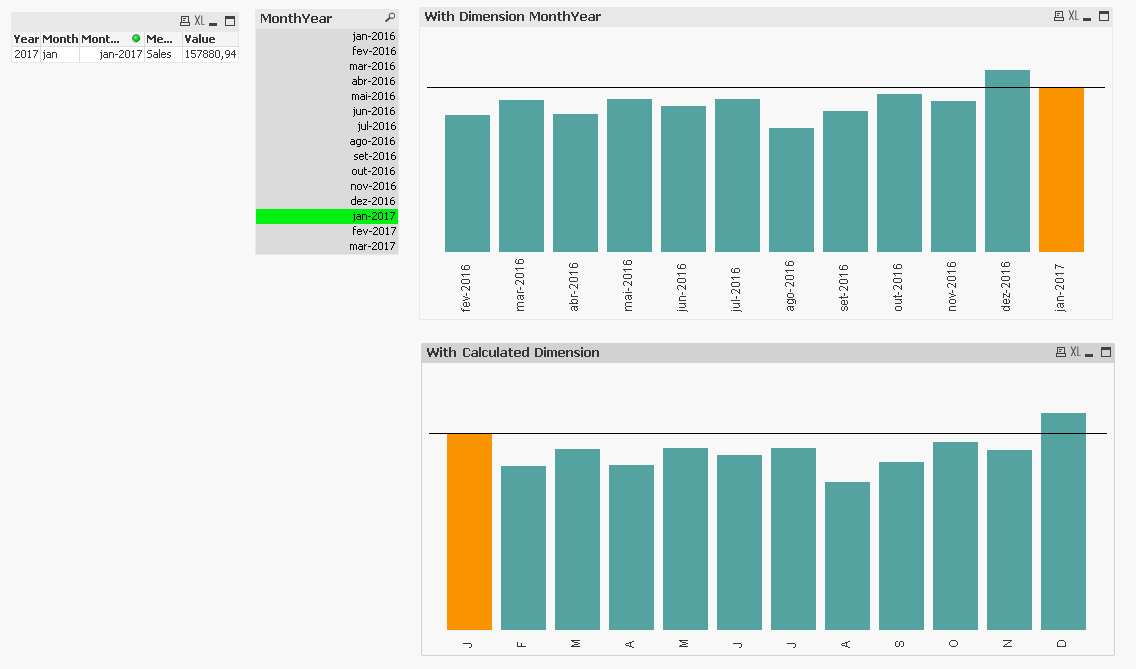
1 - How to get a YTD bar chart ?
Example:
1 - If I select jun-2016, in my chart it will show 6 bars for, jan, fev, mar, abr, mai and jun 2016.
2 - If I select fev-2017, in my chart it will show 2 bars for jan and fev 2017.
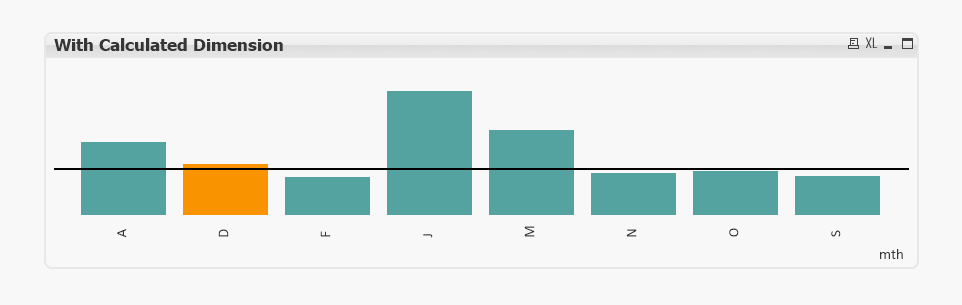
2 - How to change label for dimension?
Example:
1 - When jan show J
2 - When fev show F
3 - When mar show M
4 - When abr show A
5 - When mai show M
6 - When jun show J
7 - When jul show J
8 - When ago show A
9 - When set show S
10 - When out show O
11 - When nov show N
12 - When dez show D
Problem!!!!!!
When I do this it aggregates all the J, all the A and so on...
But I don't want it to do that, I don't want it aggregating months nor years
How can I achieve this in graph With Calculated Dimension.
Thanks in advanced,
Sílvia
Accepted Solutions
- Mark as New
- Bookmark
- Subscribe
- Mute
- Subscribe to RSS Feed
- Permalink
- Report Inappropriate Content
- Mark as New
- Bookmark
- Subscribe
- Mute
- Subscribe to RSS Feed
- Permalink
- Report Inappropriate Content
So, I was able to resolve the first question with this expression:
=Sum({<Year=, Month=, MonthYear={">=$(=Date(YearStart(Max(MonthYear)),'MMM-YYYY'))<=$(=Max(MonthYear))"}>} Value)
And using numbers instead of letters in dimension, it works. But my client really wants the letters.
Anyone?
Sílvia
- Mark as New
- Bookmark
- Subscribe
- Mute
- Subscribe to RSS Feed
- Permalink
- Report Inappropriate Content
Hi Sylvia,
you could use a mapping load to add the letter for the month, like the following:
Map:
Mapping
LOAD * INLINE [
Month, Mth
jan, J
fev, F
mar, M
abr, A
mai, M
jun, J
jul, J
ago, A
set, S
out, O
nov, N
dez, D
];
LOAD
Year,
Month,
ApplyMap ('Map', Month,) as mth,
Date(MonthYear, 'MMM-YYYY') as MonthYear,
Metric,
Value
FROM
[.\Data.xls]
Then use 'mth' as your dimension?
HTH
Best regards
Andy
- Mark as New
- Bookmark
- Subscribe
- Mute
- Subscribe to RSS Feed
- Permalink
- Report Inappropriate Content
Hi Andrew,
Thanks for your reply.
I did tried it, but it also shows the months aggregated by letter ( all the A's together, and the J's and M's too)
Sílvia
- Mark as New
- Bookmark
- Subscribe
- Mute
- Subscribe to RSS Feed
- Permalink
- Report Inappropriate Content
Check this out may be
- Mark as New
- Bookmark
- Subscribe
- Mute
- Subscribe to RSS Feed
- Permalink
- Report Inappropriate Content
Hi Salvia,
For First one u can u below
(sum({<Year ={"$(=Date(Date#(Max(MonthYear),'MMM-YYYY'),'YYYY'))"},Month=,MonthYear ={"<=$(=Date(Date#(Max(MonthYear),'MMM-YYYY'),'MMM-YYYY'))"},Metric={'Sales'}>}Value))
- Mark as New
- Bookmark
- Subscribe
- Mute
- Subscribe to RSS Feed
- Permalink
- Report Inappropriate Content
And here I was expecting a complex formula, and afterwards, simple as it is.
Thanks Sunny
- Mark as New
- Bookmark
- Subscribe
- Mute
- Subscribe to RSS Feed
- Permalink
- Report Inappropriate Content
for second use the below
LOAD
Year,
Month,
mid(Month,1,1) as MonthStart,
Date(MonthYear, 'MMM-YYYY') as MonthYear,
Metric,
Value
FROM
(biff, embedded labels, table is Sheet1$);