Unlock a world of possibilities! Login now and discover the exclusive benefits awaiting you.
- Qlik Community
- :
- All Forums
- :
- QlikView App Dev
- :
- Re: Stack bar chart : How to show values in small ...
- Subscribe to RSS Feed
- Mark Topic as New
- Mark Topic as Read
- Float this Topic for Current User
- Bookmark
- Subscribe
- Mute
- Printer Friendly Page
- Mark as New
- Bookmark
- Subscribe
- Mute
- Subscribe to RSS Feed
- Permalink
- Report Inappropriate Content
Stack bar chart : How to show values in small segment.
Hi All,
In one of the user requirement I need to plot a region wise stacked bar chart against purchase amount & sales amount. I have plotted the chart but smaller segment ( in this case purchase amount) values are not getting displayed on the chart.
I am attaching the screen shot of my stacked bar chart as below :
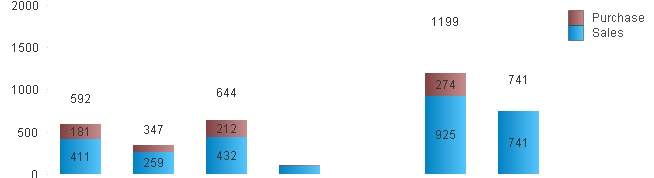
Can anyone help me with any ideas to display purchase amount value in the chart?
- Tags:
- new_to_qlikview
- Mark as New
- Bookmark
- Subscribe
- Mute
- Subscribe to RSS Feed
- Permalink
- Report Inappropriate Content
If the segments get too small the values won't be displayed by qlikview. There is no setting to change that, a work around could be to copy the expression and uncheck bar display and check Text on axis. It will display the values below the axis.
- Mark as New
- Bookmark
- Subscribe
- Mute
- Subscribe to RSS Feed
- Permalink
- Report Inappropriate Content
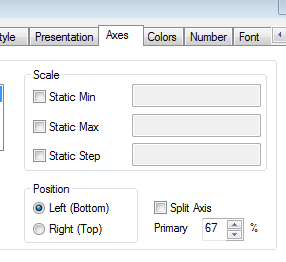
Try to adjust the scale by using the properties given below. for example try using static step as 200.
you can use the min value as 200 (you can make it data driven instead of static/hard coded) as the lowest one is 259.
- Mark as New
- Bookmark
- Subscribe
- Mute
- Subscribe to RSS Feed
- Permalink
- Report Inappropriate Content
Thanks Piet & Sudeep for quick reply.
Sudeep I have tried your approach, it helps but not completely.