Unlock a world of possibilities! Login now and discover the exclusive benefits awaiting you.
- Qlik Community
- :
- All Forums
- :
- QlikView App Dev
- :
- Transforming text in image inside data table
- Subscribe to RSS Feed
- Mark Topic as New
- Mark Topic as Read
- Float this Topic for Current User
- Bookmark
- Subscribe
- Mute
- Printer Friendly Page
- Mark as New
- Bookmark
- Subscribe
- Mute
- Subscribe to RSS Feed
- Permalink
- Report Inappropriate Content
Transforming text in image inside data table
Hello everyone,
I am new on QlikView and i am trying to make a table with large data more interesting.
My table has a field called "Status", with two distinct values: "Green" and "Red".
My idea is to display this information with colors, and not in text, as shown below:
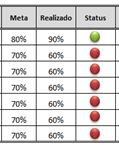
Anyone knows if it is possible to do that on QlikView?
Regards,
- Tags:
- new_to_qlikview
Accepted Solutions
- Mark as New
- Bookmark
- Subscribe
- Mute
- Subscribe to RSS Feed
- Permalink
- Report Inappropriate Content
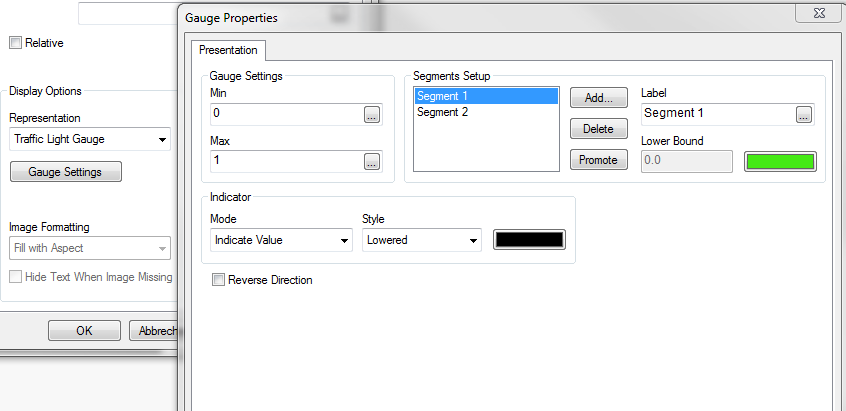
you can define the representation of your Expression as Traffic Light Gauge and define setings
- Mark as New
- Bookmark
- Subscribe
- Mute
- Subscribe to RSS Feed
- Permalink
- Report Inappropriate Content
It is possible to do this. Check this link out: Display images in straight table and this: Images as column data in straight table
- Mark as New
- Bookmark
- Subscribe
- Mute
- Subscribe to RSS Feed
- Permalink
- Report Inappropriate Content
On the Expressions tab of your Chart Properties set the expression Display Options to have a Representation of Taffic Light Gunge, and set the Gauge Setting appropriately for your needs.
- Mark as New
- Bookmark
- Subscribe
- Mute
- Subscribe to RSS Feed
- Permalink
- Report Inappropriate Content
you can define the representation of your Expression as Traffic Light Gauge and define setings
- Mark as New
- Bookmark
- Subscribe
- Mute
- Subscribe to RSS Feed
- Permalink
- Report Inappropriate Content
and to load your own images, check this out: Bundle Info Load
- Mark as New
- Bookmark
- Subscribe
- Mute
- Subscribe to RSS Feed
- Permalink
- Report Inappropriate Content
Hello,
Thanks you all for the tips.
I have made the Traffic Light Gauge as you suggested, and now i have a new problem:
All values from the field "Status" that are NULL, it shows the green light, as you can see below:
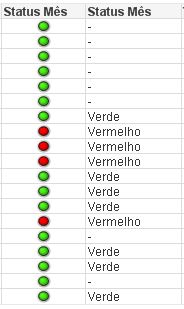
I would not like to display the green light when the value is null.
Someone, please can help me to solve this?
Regards,
- Mark as New
- Bookmark
- Subscribe
- Mute
- Subscribe to RSS Feed
- Permalink
- Report Inappropriate Content
If you want to not show green or red, you can try this:
If([Status Mes] > 0, YourExpressionForTrafficLightGauge)
- Mark as New
- Bookmark
- Subscribe
- Mute
- Subscribe to RSS Feed
- Permalink
- Report Inappropriate Content
You can create custom column in your script as expression given below and then you can use trafficlight min and max.
if(Status='Green',1,if(Status='Red',0,Null())) as StatusFlag