Unlock a world of possibilities! Login now and discover the exclusive benefits awaiting you.
- Qlik Community
- :
- All Forums
- :
- QlikView App Dev
- :
- Trending
- Subscribe to RSS Feed
- Mark Topic as New
- Mark Topic as Read
- Float this Topic for Current User
- Bookmark
- Subscribe
- Mute
- Printer Friendly Page
- Mark as New
- Bookmark
- Subscribe
- Mute
- Subscribe to RSS Feed
- Permalink
- Report Inappropriate Content
Trending
Hi all,
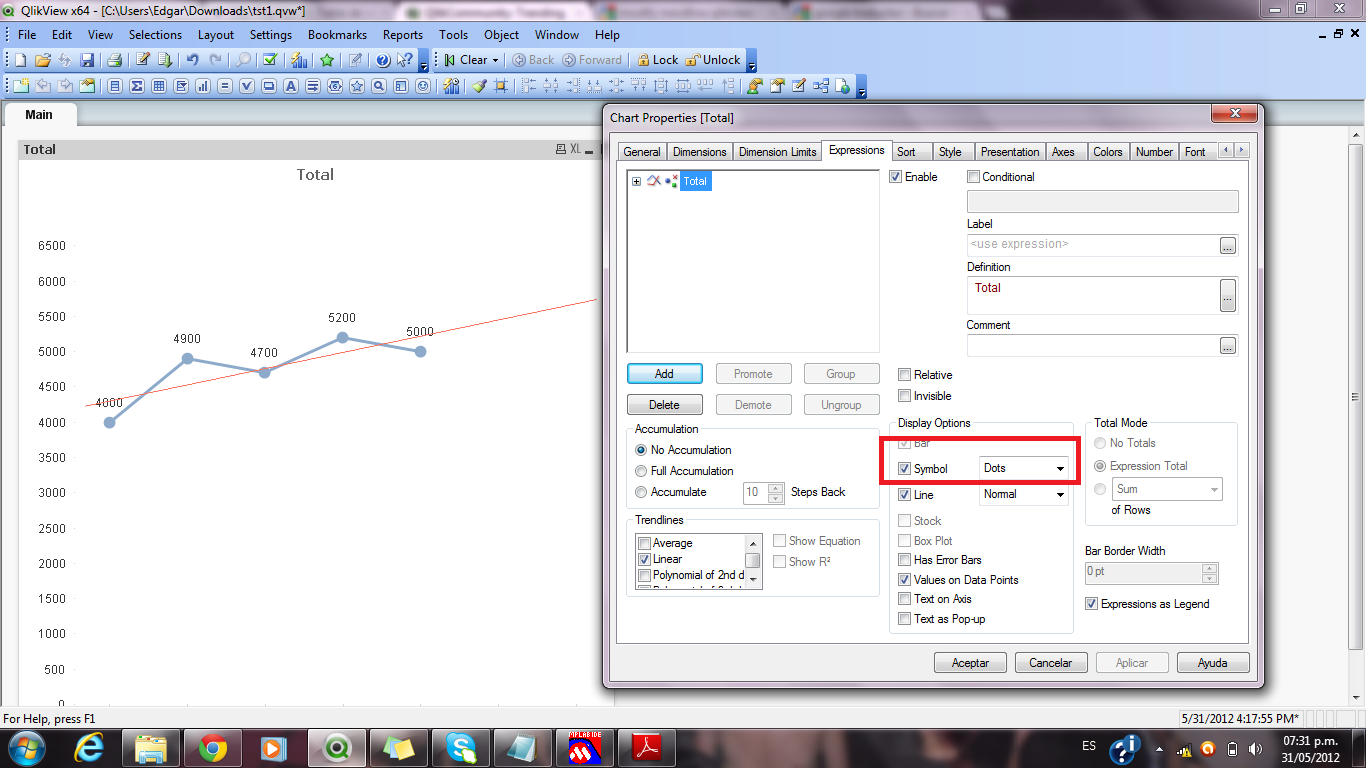
I'm trying to trend data using the qlikview Default "Trend " option in Expression and Extrapolate the data to 2 data points in the Axis.
Problem is I need to Make the Trend line 'Dotted ' or some other way to distinguish the actual line(not by color).
Attached is sample QVW
Any thoughts on this
Thanks in Advance
Accepted Solutions
- Mark as New
- Bookmark
- Subscribe
- Mute
- Subscribe to RSS Feed
- Permalink
- Report Inappropriate Content
Thanks for your response Vladimir , But that doesn't serve the purpose , i raised a ticket with Qliktech Support and the response is its not possible to change the style of Default trendline from linear .
the only options to manipulate the default trendline are the one which you mentioned in earlier post
- Mark as New
- Bookmark
- Subscribe
- Mute
- Subscribe to RSS Feed
- Permalink
- Report Inappropriate Content
I dont know if you can modify the trendline , but if you want to differentiate between the expression and the trendline, you can modify the expression line adding dots.
I hope this can help you, best regards.
- Mark as New
- Bookmark
- Subscribe
- Mute
- Subscribe to RSS Feed
- Permalink
- Report Inappropriate Content
Edgar,
Thanks for your response .
But that doesn't serve the Purpose.
PFA Updated Copy.
Here I calculated the "Trend line" using the Linear Formula (Linest_m/b) in Qlikview .
and Able to generate Using the Expression and make it "dotted".
On a high level this will be fine .. but when drilling down to Sub levels / Selecting by dimension this will not work .
Any thoughts on this
Thanks in Advance
- Mark as New
- Bookmark
- Subscribe
- Mute
- Subscribe to RSS Feed
- Permalink
- Report Inappropriate Content
I do not think you can change a trend line's style, but you can change it for your expression line(s) and keep it solid for trend line. You can also change color's options (transparency) for trend lines, and you can change Trend line's width to differ it from your expression's lines.
Hope it helps.
Regards,
Vladimir
- Mark as New
- Bookmark
- Subscribe
- Mute
- Subscribe to RSS Feed
- Permalink
- Report Inappropriate Content
I've updated your app slightly to demonstrate how it might work
- Mark as New
- Bookmark
- Subscribe
- Mute
- Subscribe to RSS Feed
- Permalink
- Report Inappropriate Content
Thanks for your response Vladimir , But that doesn't serve the purpose , i raised a ticket with Qliktech Support and the response is its not possible to change the style of Default trendline from linear .
the only options to manipulate the default trendline are the one which you mentioned in earlier post