Unlock a world of possibilities! Login now and discover the exclusive benefits awaiting you.
- Qlik Community
- :
- All Forums
- :
- QlikView App Dev
- :
- can't get the sum using count
- Subscribe to RSS Feed
- Mark Topic as New
- Mark Topic as Read
- Float this Topic for Current User
- Bookmark
- Subscribe
- Mute
- Printer Friendly Page
- Mark as New
- Bookmark
- Subscribe
- Mute
- Subscribe to RSS Feed
- Permalink
- Report Inappropriate Content
can't get the sum using count
Good afternoon,
I kindly ask some help for the following problem.
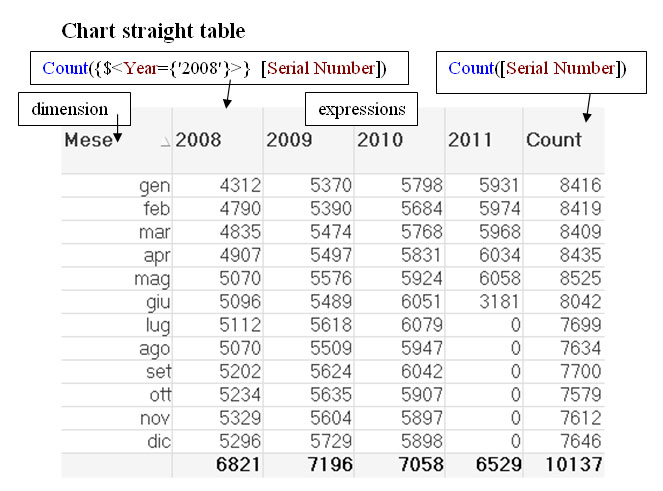
I have a chart straight table with one dimension which is the month and several expressions.
As you can see in the below picture the value in the last column, named "count", is not the total of the four columns 2008, 2009, 2010 and 2011:
I am sorry I can't manage to attached a small qvw file. I tried but I could not reproduce the problem.
When I tried on a different example it seemed to me that the last column will count only the distinct [Serial Number].
Your help is appreciated.
Thanks
Antonio
- Tags:
- count
- new_to_qlikview
- « Previous Replies
-
- 1
- 2
- Next Replies »
- Mark as New
- Bookmark
- Subscribe
- Mute
- Subscribe to RSS Feed
- Permalink
- Report Inappropriate Content
Jeroen,
Since I could not post a .qvw it took me sometime to have it working, I made my first comment when I tried
Sum( Aggr( Count( [Serial Number] ), Year ) )
that did not work in my .qvw file
then I needed to adjust it to
Sum( Aggr( Count( [Serial Number] ), Month ) )
in order to have it working fine.
From your suggestion I learnt how to use
SUM AGGR COUNT
and ,once more, how important is to try to post a .qvw file. But this time I could not manage to reduce it to a file that could be published.

Thanks
Antonio
- Mark as New
- Bookmark
- Subscribe
- Mute
- Subscribe to RSS Feed
- Permalink
- Report Inappropriate Content
Well actually, I'm still working with the personal edition, eagerly awaiting license keys. So what I do for my questions is create a tiny example with an inline dataset.
Happy to hear you understand how it works! Good luck.
- « Previous Replies
-
- 1
- 2
- Next Replies »