Unlock a world of possibilities! Login now and discover the exclusive benefits awaiting you.
- Qlik Community
- :
- All Forums
- :
- QlikView App Dev
- :
- Re: how to create a stack bar chart + with value o...
- Subscribe to RSS Feed
- Mark Topic as New
- Mark Topic as Read
- Float this Topic for Current User
- Bookmark
- Subscribe
- Mute
- Printer Friendly Page
- Mark as New
- Bookmark
- Subscribe
- Mute
- Subscribe to RSS Feed
- Permalink
- Report Inappropriate Content
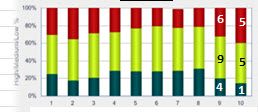
how to create a stack bar chart + with value on each of the stack.
Hi guys,
i want to create a stack bar chart that have "High, Medium. Low' and show value in each of the bar. As per this screenshot,
I have a expression as below, but it didnt work. I have attached my example as well.
count({<gr_impact={'High'}>} gr_impact) +
count({<gr_impact={'Medium'}>} gr_impact)+
count({<gr_impact={'Low'}>} gr_impact)
Rgds,
Jim
Accepted Solutions
- Mark as New
- Bookmark
- Subscribe
- Mute
- Subscribe to RSS Feed
- Permalink
- Report Inappropriate Content
Hi Jim,
My apologies I missed that part of the requirement...
On 'Presentation' tab, enable the ;Values on Data Points' option and that should work for you:
Please remember to mark this as helpful or the correct answer if I have helped you or answered your question.
- Mark as New
- Bookmark
- Subscribe
- Mute
- Subscribe to RSS Feed
- Permalink
- Report Inappropriate Content
How your dimension? Meantime, can I know expected output
- Mark as New
- Bookmark
- Subscribe
- Mute
- Subscribe to RSS Feed
- Permalink
- Report Inappropriate Content
in the sample i have attached, i used "risk_no" as my dimension. expected result as the image i have attached.
- Mark as New
- Bookmark
- Subscribe
- Mute
- Subscribe to RSS Feed
- Permalink
- Report Inappropriate Content
Hi Jim,
I am not clear on what output you expect here...
Each risk appears to only have one gr_impact assigned to it, so having risk as the x axis is never going to give you a stacked chart.
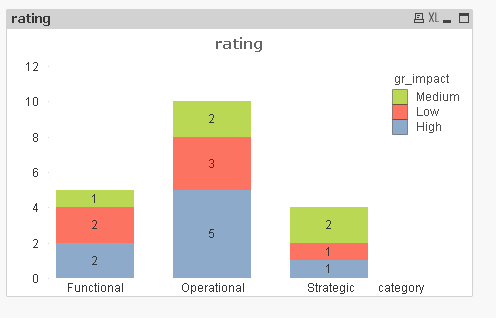
I've amended your example slightly, is this what you wanted?
Please remember to mark this as helpful or the correct answer if I have helped you or answered your question.
- Mark as New
- Bookmark
- Subscribe
- Mute
- Subscribe to RSS Feed
- Permalink
- Report Inappropriate Content
Hello Adam,
You're right. My mistake. So, how can I display numbers in each of the stack?
Rgds
Jim
- Mark as New
- Bookmark
- Subscribe
- Mute
- Subscribe to RSS Feed
- Permalink
- Report Inappropriate Content
Hi Jim,
My apologies I missed that part of the requirement...
On 'Presentation' tab, enable the ;Values on Data Points' option and that should work for you:
Please remember to mark this as helpful or the correct answer if I have helped you or answered your question.
- Mark as New
- Bookmark
- Subscribe
- Mute
- Subscribe to RSS Feed
- Permalink
- Report Inappropriate Content
thank you