Unlock a world of possibilities! Login now and discover the exclusive benefits awaiting you.
- Qlik Community
- :
- All Forums
- :
- QlikView App Dev
- :
- Re: how to display a chart based on a selected ite...
- Subscribe to RSS Feed
- Mark Topic as New
- Mark Topic as Read
- Float this Topic for Current User
- Bookmark
- Subscribe
- Mute
- Printer Friendly Page
- Mark as New
- Bookmark
- Subscribe
- Mute
- Subscribe to RSS Feed
- Permalink
- Report Inappropriate Content
how to display a chart based on a selected item in a list object
I have an excel sheets where I have three columns - say Date, StanC_IPR, Airtel_IPR;
In my Qlikview sheet, I am plotting a graph x-axis ->- Date and in y-axis --> StanC_IPR, Airtel_IPR
I am creating another list object that lists two items taken from a different excel sheet. The list contains 2 values - Stanc, Airtel.
by default, right now, my graph shows both StanC_IPR and Airtel_IPR.
I want to control the display based on what is selected in the list. that is, if the user selects, Stanc, the graph should plot - date vs StanC_IPR.
if the user selects Airtel, then the graph should plot date vs Airtel_IPR
I am not sure what to write in the 'Condition' in Graph object.
Any help is appreciated.
I understand that if i store values in the excel sheet differently, this thing will be automatically taken care by Qlikview. But unfortunately, i cannot change this.
- Mark as New
- Bookmark
- Subscribe
- Mute
- Subscribe to RSS Feed
- Permalink
- Report Inappropriate Content
Hi cmmuru123,
I would say the best approach is to use a few buttons and use a variable to switch the views based on the selections.
Regards,
Ram
- Mark as New
- Bookmark
- Subscribe
- Mute
- Subscribe to RSS Feed
- Permalink
- Report Inappropriate Content
Can you please explain in detail. moreover this is just a sample. Ideally I will have more than 50 items in the list. If i start using button for each item in the list, then I will end up adding 50 buttons +
is there a more efficient way ?
- Mark as New
- Bookmark
- Subscribe
- Mute
- Subscribe to RSS Feed
- Permalink
- Report Inappropriate Content
Hi
Try like this
Properties ->
Dimension -> Enable condition , in that give condition as per ur requirement.
Can u please post a sample, if not understand clearly
Hope it helps
Please close the thread by marking correct answer & give likes if you like the post.
- Mark as New
- Bookmark
- Subscribe
- Mute
- Subscribe to RSS Feed
- Permalink
- Report Inappropriate Content
Boss, I dont know how to write that expression. I have given a detailed example above. I have attached snapshot image.
based on what I choose in Project List, my graph should get changed. 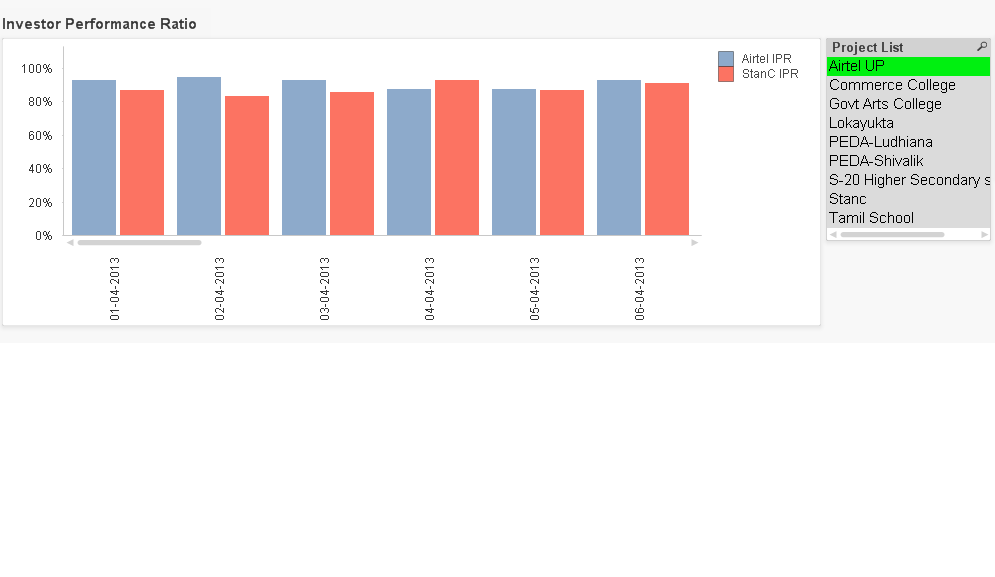
- Mark as New
- Bookmark
- Subscribe
- Mute
- Subscribe to RSS Feed
- Permalink
- Report Inappropriate Content
Hi,
Hope I understand you correctly. See the attached application. Please let me know if this is not you are expecting the result.
- Mark as New
- Bookmark
- Subscribe
- Mute
- Subscribe to RSS Feed
- Permalink
- Report Inappropriate Content
hi venugopal,
I am not getting the meaning of this field eventhough it works fine sum($(SelectInField)). I have given a snapshot here. I am not sure how to make use of your input. I have shown the properties page of the graph. Please let me know
in my case, my 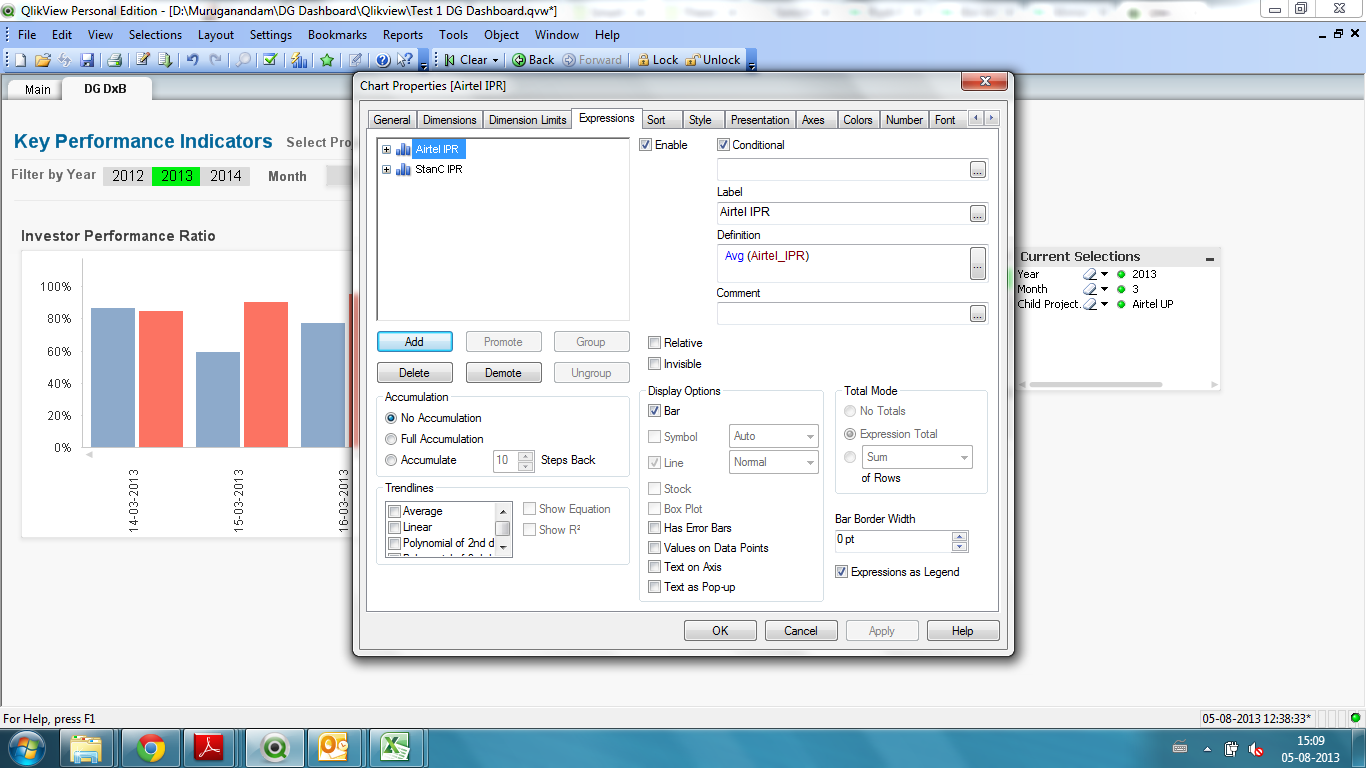
- Mark as New
- Bookmark
- Subscribe
- Mute
- Subscribe to RSS Feed
- Permalink
- Report Inappropriate Content
Hi,
Step 1: The list box is an option of "Always One selected value".
Step 2: Create a variable and use the function "GetFieldSelections". This can save the selected value to the variable. In our case, SelectInField is a variable and it stores the current selection of a field value.
Step 3: Form the chart expression, use the function Sum for value of variable. i.e. Sum($(SelectInField)).
This can summaries the values for a current selection field.
I hope, you understand now what I meant for.
- Mark as New
- Bookmark
- Subscribe
- Mute
- Subscribe to RSS Feed
- Permalink
- Report Inappropriate Content
Hi,
Pls check the Files attached.
Hope it helps.
- Mark as New
- Bookmark
- Subscribe
- Mute
- Subscribe to RSS Feed
- Permalink
- Report Inappropriate Content
Hi,
See the attched one.
Is it what you are looking for?