Unlock a world of possibilities! Login now and discover the exclusive benefits awaiting you.

Analytics & AI
Forums for Qlik Analytic solutions. Ask questions, join discussions, find solutions, and access documentation and resources.
Data Integration & Quality
Forums for Qlik Data Integration solutions. Ask questions, join discussions, find solutions, and access documentation and resources
Explore Qlik Gallery
Qlik Gallery is meant to encourage Qlikkies everywhere to share their progress – from a first Qlik app – to a favorite Qlik app – and everything in-between.
Qlik Community
Get started on Qlik Community, find How-To documents, and join general non-product related discussions.
Qlik Resources
Direct links to other resources within the Qlik ecosystem. We suggest you bookmark this page.
Qlik Academic Program
Qlik gives qualified university students, educators, and researchers free Qlik software and resources to prepare students for the data-driven workplace.
Recent Blog Posts
-
Peeking through the Window() Script Function
You might be familiar with the concept of Window functions from Excel or SQL and know just how convenient and powerful they can be. Well, Qlik has one... Show MoreYou might be familiar with the concept of Window functions from Excel or SQL and know just how convenient and powerful they can be. Well, Qlik has one that you can use right in your Load Script!
Simply put, the Window function performs calculations over multiple rows producing a value for each row separately, unlike aggregate functions that will give a single value for the group of rows aggregated together.
You can think of it as looking through a window at your dataset and only seeing a subset based on different parameters you set which we will go over in a minute.
If you wanted to calculate the average transaction_amount by customer, you could of course do this in the chart expression with something like this: aggr(avg(transaction_amount), customer_id), or if you’re in the Load Script, perform another load and use Group By as follows:
Temp:
//inline load here

Transactions:
NoConcatenate Load
transaction_id,
transaction_date,
transaction_amount,
transaction_quantity,
customer_id,
size,
color_code
Resident Temp;

Load customer_id,
Avg(transaction_amount) AS AvgAmount
Resident Transactions
Group By customer_id;
But this requires a separate load and can’t just be done on the same loaded table, and it might not be ideal for more complex use cases.
This is where the Window function comes in, and the above can be re-written as follows:
Temp:
//inline load here

Transactions:
NoConcatenate Load
transaction_id,
transaction_date,
transaction_amount,
transaction_quantity,
customer_id,
size,
color_code,
Window(Avg(transaction_amount),customer_id) as AvgCustTransaction
Resident Temp;
Much easier!
Syntax:
Let’s take a closer look at the function syntax to understand it a little more and see what other capabilities it has:
Window( input_expr, [partition1, partition2, ...], [sort_type, [sort_expr]], [filter_expr], [start_expr,end_expr] )
- input_expr
Refers to the input expression calculated and returned by the function. It must be any expression based on an aggregation, such as Median(Salary). For example:
Window(Median(Salary)) as MedianSalaryThe input can also be a field name with no aggregation applied and in that case Qlik treats it like the Only() function. For example:
Window(Salary,Department) as WSalary- Partition: [partition1, partition2, ...]
After input_expr, you can define any number of partitions. Partitions are fields that define which combinations to apply the aggregations with. The aggregation is applied separately with each partition. (Think of it as the Group By clause). Multiple partitions can be defined. For example:
Window(Avg(Salary), Unit, Department, Country) as AvgSalary- sort_type, sort_expr
The sort type and the sort expression can be specified optionally. sort_type can have one of two values ASC (Ascending sorting) or DESC (Descending sort)
If sort_type is defined, then the sorting expression must also be defined. This is an expression that decides the order of the rows within a partition.
For example:
Window(RecNo(), Department, 'ASC', Year) // results within the partition are sorted Ascendingly by year- filter_expr
The optional Filter Expression is a Boolean expression that decides whether the record should be included in the calculation or not.
This parameter can be omitted completely, and the result should be that there is no filter.
For example:
Window(avg(Salary), Department, 'ASC', Age, EmployeeID=3 Or EmployeeID=7) as wAvgSalaryIfEmpIs3or7- Sliding Window with start_expr,end_expr
Optionally, you can set the argument for sliding window functionality. A sliding window requires two arguments:
- start_expr: The number of rows prior to the current row to include in the window.
- end_expr: The number of rows after the current row to include in the window.
For example, if you want to include the 3 preceding rows, the current row, and the 2 following row:
Window(concat(Text(Salary),'-'), Department, 'ASC', Age, Year>0, -3, 2) as WSalaryDepartmentExamples:
Let’s take a look at different use case examples:
1- Adding a field containing an aggregation
Transactions:
Load
*,
Window(Avg(transaction_amount),customer_id) as AvgCustTransaction;

Load * Inline [
transaction_id, transaction_date, transaction_amount, transaction_quantity, customer_id, size, color_code
3750, 20180830, 23.56, 2, 2038593, L, Red
3751, 20180907, 556.31, 6, 203521, M, Orange
3752, 20180916, 5.75, 1, 5646471, S, Blue
3753, 20180922, 125.00, 7, 3036491, L, Black
3754, 20180922, 484.21, 13, 049681, XS, Red
3756, 20180922, 59.18, 2, 2038593, M, Blue
3757, 20180923, 177.42, 21, 203521, XL, Black
3758, 20180924, 153.42, 14, 2038593, L, Red
3759, 20180925, 7.42, 5, 203521, M, Orange
3760, 20180925, 80.12, 18, 5646471, M, Blue
3761, 20180926, 3.42, 7, 3036491, XS, Black
3763, 20180926, 63.55, 12, 049681, S, Red
3763, 20180927, 177.56, 10, 2038593, L, Blue
3764, 20180927, 325.95, 8, 203521, XL, Black
];
2- Adding a field containing an aggregation filtered for specific values
Transactions:
Load
*,
Window(Avg(transaction_amount),customer_id, color_code = 'Blue') as AvgCustTransaction;

Load * Inline [
// Table goes here
];
3- Adding a field with a sliding window
Transactions:
Load
*,
Window(Avg(transaction_amount),customer_id, 'ASC', -1, 1, 0, 1) as AvgCustTransaction;

Load * Inline [
// Table goes here
];
This concludes this post, I hope you found it helpful!
A qvf with all the scripts is attached for reference.- Thanks
-
Qlik Cloud Reporting API: Going Beyond the Tenant Interface
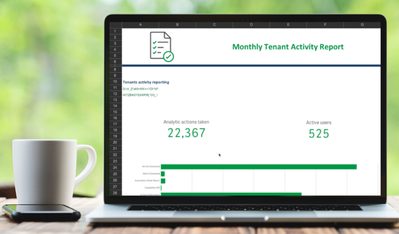
If you’re running Qlik on-premise, NPrinting is the go-to for producing highly formatted, template-based reports. It works seamlessly with QlikView an... Show MoreIf you’re running Qlik on-premise, NPrinting is the go-to for producing highly formatted, template-based reports. It works seamlessly with QlikView and Qlik Sense Enterprise on Windows, letting you design in familiar tools like Excel, Word, PowerPoint, and PixelPerfect, then deliver reports as PDFs, HTML, or Office files to folders, the NPrinting NewsStand, email recipients, or even the Qlik Sense Hub — all with scheduling, cycling, and bursting built in.
In Qlik Cloud, reporting takes a different shape. You still have built-in options for creating and delivering reports directly in the tenant interface, but you also gain something new: an API-driven approach that opens up possibilities well beyond what’s available in the UI. And that’s where the Qlik Cloud Reporting API comes in.
What You Can Do in Qlik Cloud (Inside the Interface):
Qlik Cloud Reporting allows you to create reports from apps using native templates or PixelPerfect templates, then distribute them as PDFs, Excel files, or other formats. Through the tenant interface, you can:
-
Create and edit report templates
-
Apply selections and filters
-
Schedule recurring reports
-
Deliver reports to email recipients or Qlik Cloud spaces
These capabilities are fully documented in Qlik Help, and for many users, the UI-based workflow is all they need.
Why Go Beyond the Tenant Interface?
The Reporting API enables everything above — but from outside Qlik Cloud.
That means you can:-
Trigger reports from external systems
-
Integrate reporting into your own applications
-
Automate delivery to custom destinations
-
Include Qlik reports in larger automated workflows (think: customer portals, scheduled partner updates, or triggered operational reports)
If you’ve ever wished you could generate a Qlik report as part of an end-to-end automation pipeline, the API is the key.
Reporting with Qlik Automate
Not every reporting workflow requires custom code. Qlik Automate lets you build automated reports using the Qlik Reporting Service through a low-code, drag-and-drop interface. Reports can be delivered as PDF or PowerPoint and distributed via email or cloud connectors like SharePoint, OneDrive, Dropbox, Google Cloud Storage, Amazon S3, or SFTP.
Some common use cases include:
-
Bursted reports where each recipient only sees their own data
-
Looping reports that generate one page per dimension value (e.g. region or product)
-
Cross-app reporting combining insights from multiple Qlik Sense apps
-
External delivery to recipients without Qlik Cloud accounts
Think of Automate as the middle ground — more flexible than the tenant UI, but easier to adopt than full API coding.
How the Qlik Cloud Reporting API Works
At its core, the process involves:
1- Sending a POST request to create a report generation job.
2- Polling the outputs endpoint to check when the job is complete.
3- Downloading the generated file once it’s ready.
Here’s a real example:
Step 1: Request a Report
POST https://<tenant>/api/v1/reports
Body:
{
  "type": "sense-pixel-perfect-template-1.0",
  "sensePixelPerfectTemplate": {
    "appId": "1234567-a480-43f5-bc88-825736d8842f",
    "templateId": "1a2b3c-ba56-46ee-ac74-4746dd145816",
    "templateLocation": {
      "path": "https://<tenant>/api/v1/report-templates/3de5c6c2-ba56-46ee-ac74-4746dd145816",
      "format": "url"
    },
    "selectionChain": [
      {
        "selectionType": "selectionFilter",
        "selectionFilter": {
          "selectionStrategy": "stopOnError",
          "selectionsByState": {
            "$": [
              {
                "fieldName": "Currency",
                "defaultIsNumeric": false,
                "values": [{ "text": "USD", "isNumeric": false }]
              },
              {
                "fieldName": "Year",
                "defaultIsNumeric": true,
                "values": [{ "number": 45778, "isNumeric": true }]
              }
            ]
          }
        }
      }
    ]
  },
  "output": { "type": "pdf", "outputId": "pp", "pdfOutput": {} }
}
Response:
{
  "message": "Report request has been accepted and is being processed.",
  "outputsUrl": "https://<tenant>/api/v1/reports/1234567-bed1-4024-8614-37bb898a41b0/outputs",
  "requestId": "987654321-bed1-4024-8614-37bb898a41b0"
}
Here, you’ll notice:
-
outputsUrl gives you the endpoint to poll for the report status.
-
requestId uniquely identifies the job.
Step 2: Poll for the Output
GET https://<tenant>/api/v1/reports/{requestId}/outputs
Response:
{
  "data": [
    {
      "cycleSelections": [],
      "location": "https://<tenant>/api/v1/temp-contents/2342346c185413cc5ec121b",
      "outputId": "pp",
      "sizeBytes": 382078,
      "status": "done",
      "traceId": "abc1234d2e88db9bc155d8a732132899d"
    }
  ],
  "links": {
    "self": {
      "href": "https://<tenant>/api/v1/reports/{requestId}/outputs"
    }
  }
}
Key things to look for in the response:
-
status — "done" means the report is ready.
-
location — the direct link to the generated file.
Step 3: Download the File
Once the status is "done", perform a GET to the location URL.
For example:
GET https://<tenant>/api/v1/temp-contents/2342346c185413cc5ec121b
This returns the actual PDF (or other format, depending on your request).
Where to Learn More:
You can visit these pages for full API documentation and working samples:
Qlik Cloud’s tenant interface is powerful for building and scheduling reports right inside your analytics environment — but the Reporting API takes it further. By integrating directly with your external systems, you can build modern, automated, and scalable reporting workflows that go well beyond what’s possible within the tenant.
If you’re ready to move from manual scheduling to full automation, the Reporting API is where you start.
-
-
Tabular Reporting within Qlik Cloud Analytics
Tabular reporting capabilities have been a fundamental aspect of Qlik’s reporting software dating back to QlikView. At its core, it enables users to o... Show MoreTabular reporting capabilities have been a fundamental aspect of Qlik’s reporting software dating back to QlikView. At its core, it enables users to organize and share data with stakeholders in structured table formats. There’s a reason people still love and use Excel.
So — what exactly is Tabular Reporting with Qlik Cloud? What can it be used for? What is the state of this technology today? Let’s get into it.
Customers now have the capabilities to conquer those ever-present report distribution requirements. Whether you need paginated tables of sales/transactional data or repeated sheets of departmental analysis directly within an application in Qlik Cloud, we've got you covered.
With the introduction of Tabular Reporting, report developers can create custom highly formatted XLS or PDF documents from Qlik data and visualizations.
Governed Report Tasks can burst reports to any stakeholder, ensuring that the Qlik platform serves as the source for your business decisions, customer communications, and more.
Highlights of Tabular Reporting:
Create dynamic tabular reports by combining the Qlik add-in for Microsoft Excel with report preparation features available within a Qlik Sense app.
Deliver report output by email and to folders defined in Microsoft SharePoint connections. Reports can be in .xlsx or PDF format.
Define report templates of Qlik data and visualizations and produce reports in PDF and Excel.
Share branded, presentation-ready burst reports with internal and external stakeholders, with the self-service subscription ability to set up alerts.
Manage in-app distribution lists to support burst distribution to any internal or external stakeholder.
Control with governed report task control from within an integrated report preparation experience.
Qlik Cloud Reporting capabilities will continue to expand with new features and functions that enhance collaboration and enable users to leverage insights derived from reports across their organizations.
Ready to learn how to use these collaborative and tabular reporting features and want hands-on workshops? Join us in Orlando for Qlik Connect in June. You will even get insight into future releases during our roadmap sessions.
Want to ‘keep tabs’ on Tabular Reporting and other Qlik Cloud Reporting updates on the horizon?
- Tune in on March 27th for our webinar series: ‘Do More with Qlik’ - Tabular Reporting for NPrinting Customers.
- Check out What's New for official availability notices for Q2’24.
- Visit the Tabular Reporting Page within Qlik Help to learn more.
- Youtube:
-
6 Things You Might Not Know About Qlik-cli
Qlik-cli, known on the command line simply as qlik, is a command line interface for Qlik cloud. It provides access to all public APIs through the comm... Show MoreQlik-cli, known on the command line simply as qlik, is a command line interface for Qlik cloud. It provides access to all public APIs through the command line, making it easier to perform administrative tasks.
By now, working with Qlik-cli might be an obvious choice, to enhance your experience, here are six (6) things you might not know about Qlik-cli.
1. The alias command:
The alias command is a customisable command that enables you to create short names for commands that are not easy to remember. For example, if you want to list 50 items you would call qlik item ls --limit 50 .
Instead, you can create an alias i or use any word that makes it easier for you to remember.
To create the alias i , you can call: qlik alias i item ls --limit 50Therefore, next time you want to list 50 items you simply call:qlik iTo see existing aliases you can call:
qlik alias lsFor more details call:
qlik alias --help2. The edit command:
This command fetches the resource and opens it in your integrated development environment (IDE). This is most likelythe editor defined by your 'EDITOR' environment variable or fall back to 'vi' for Linux or 'notepad' for Windows.The resource will be updated according to the changes made in the editor, upon saving.To use this command, for instance on a space, simply call:qlik space edit <spaceid>3. The Raw Command:
This is an advanced command that can be used to send HTTP API requests to Qlik Cloud.When called, this command will return the full response from the server, including pagination links.Note: The raw command can be used for any public API in Qlik Cloud, and not only the ones natively supported in qlik-cli.As an example, you can use this command to get a response from the server on items.To do this, simply call:qlik raw get v1/itemsAdditionally, query parameters are specified using the --query flag and a body can be specified using one of the body flags that is: body, body-file or body-values.4. The verbose flag:
The verbose flag can be used to get detailed information regarding a request and response. It is very similar to what you get when you use the -v flag with curl. To log more information about a command or operation simply add -v to the command.For example, you can get more information upon app creation by calling:qlik app create -vThis is the response you get:
Server-type not set, guessing "cloud"
POST https://yourtenant.qlik.com/api/v1/apps
* Establishing connection to: yourtenant.qlik.com:443
* TLS Handshake started
* TLS Handshake done (188ms), version: TLS v1.3
* Connection established (410ms)
> Host:yourtenant.qlik.com
> User-Agent: qlik-cli/2.16.0 (darwin)
> Transfer-Encoding: chunked
> Authorization: Bearer **omitted**
> Content-Type: application/json
> Referer: https://yourtenant.qlik.com
> Accept-Encoding: gzip
PAYLOAD:
{}
< Cache-Control: no-store
< Connection: keep-alive
< Content-Length: 979
< Content-Type: application/json; charset=UTF-8
< Date: Wed, 11 Jan 2023 13:48:17 GMT
< Pragma: no-cache
< Strict-Transport-Security: max-age=15724800; includeSubDomains
Response time: 2s

Status: 200 OK
{
  "attributes": {
    "_resourcetype": "app",
    "createdDate": "2023-01-11T13:48:15.996Z",
    "custom": {},
    "description": "",
    "dynamicColor": "",
    "encrypted": true,
    "hasSectionAccess": false,
    "id": "514******",
    "isDirectQueryMode": false,
    "lastReloadTime": "",
    "modifiedDate": "2023-01-11T13:48:17.373Z",
    "name": "514fffd9-bf9c-4f95-9b59-93040211d014",
    "originAppId": "",
    "owner": "auth0|e43**********",
    "ownerId": "OwnerID",
    "publishTime": "",
    "published": false,
    "thumbnail": ""
  },
  "create": [
    {
      "canCreate": true,
      "resource": "sheet"
    },
    {
      "canCreate": true,
      "resource": "bookmark"
    },
    {
      "canCreate": true,
      "resource": "snapshot"
    },
    {
      "canCreate": true,
      "resource": "story"
    },
    {
      "canCreate": true,
      "resource": "dimension"
    },
    {
      "canCreate": true,
      "resource": "measure"
    },
    {
      "canCreate": true,
      "resource": "masterobject"
    },
    {
      "canCreate": true,
      "resource": "variable"
    }
  ],
  "privileges": [
    "read",
    "update",
    "delete",
    "reload",
    "export",
    "duplicate",
    "change_space",
    "export_reduced",
    "source"
  ]
}
And this is what you get when you create an app without the verbose flag (-v):
{
  "attributes": {
    "_resourcetype": "app",
    "createdDate": "2023-01-11T13:52:39.099Z",
    "custom": {},
    "description": "",
    "dynamicColor": "",
    "encrypted": true,
    "hasSectionAccess": false,
    "id": "9d*********",
    "isDirectQueryMode": false,
    "lastReloadTime": "",
    "modifiedDate": "2023-01-11T13:52:40.044Z",
    "name": "9d4c0950-ccd7-4824-9a96-db8f04a23716",
    "originAppId": "",
    "owner": "auth0|e43*********",
    "ownerId": "63*********",
    "publishTime": "",
    "published": false,
    "thumbnail": ""
  },
  "create": [
    {
      "canCreate": true,
      "resource": "sheet"
    },
    {
      "canCreate": true,
      "resource": "bookmark"
    },
    {
      "canCreate": true,
      "resource": "snapshot"
    },
    {
      "canCreate": true,
      "resource": "story"
    },
    {
      "canCreate": true,
      "resource": "dimension"
    },
    {
      "canCreate": true,
      "resource": "measure"
    },
    {
      "canCreate": true,
      "resource": "masterobject"
    },
    {
      "canCreate": true,
      "resource": "variable"
    }
  ],
  "privileges": [
    "read",
    "update",
    "delete",
    "reload",
    "export",
    "duplicate",
    "change_space",
    "export_reduced",
    "source"
  ]
}
5. The Quiet flag:
The --quiet or -q flag is used for chaining commands. For example, to get the last updated app you can call:qlik app ls -q | head -n1 | qlik app getThe quiet flag can also be used to only return the resource IDs for an operation. For instance, if you are creating an app and only want the appId, you can call:qlik app create -q6. Autocompletion:
The autocompletion provided in Qlik-cli does not only autocomplete the known commands but can also be used to list the resource id used for a specific command. If you have configured autocompletion in your shell you can use TAB to go through space IDs for instance.
Note: Completion should be added after Qlik-cli installation. You can see this tutorial on how to add completion.
If you are just getting started with Qlik-cli, you can learn more here or watch this video for an introduction to qlik-cli
Feel free to add more cool things we should know about qlik-cli.
/Gertrude.
-
Athletics Injuries Analysis
Athletics Injuries Analysis Lupus Analitycs Uncover global patterns in athletics injuries - 15,000 cases mapped across countries ,events and bod... Show More
Athletics Injuries AnalysisLupus Analitycs Uncover global patterns in athletics injuries - 15,000 cases mapped across countries ,events and body parts.
Discoveries
The most common injuries in athletes is the Achiiles tendon
Impact
Which Injuries are most common
Audience
All intrested in sport
Data and advanced analytics
Discovery of potential risks.
-
【オンデマンド配信】銀行業界向けデータ活用の課題と Qlik による高度化
日本の銀行業界は、金融政策の転換や人口減少、フィンテック企業との競争激化といった構造的な変革期にあります。本 Web セミナーでは、これらの課題を乗り越えるための IT 戦略に焦点を当てます。具体的には、レガシーシステムの老朽化からの脱却、デジタルチャネルの最適化、サイバーセキュリティ対策、そして ... Show More日本の銀行業界は、金融政策の転換や人口減少、フィンテック企業との競争激化といった構造的な変革期にあります。
本 Web セミナーでは、これらの課題を乗り越えるための IT 戦略に焦点を当てます。具体的には、レガシーシステムの老朽化からの脱却、デジタルチャネルの最適化、サイバーセキュリティ対策、そして DX 人材の不足といった重要課題を整理します。特に、顧客接点や取引履歴、音声ログなどの非構造化データを活用しきれていない現状に対し、Qlik の ソリューションは、データを統合・分析し、生成 AI とも連携することで、パーソナライズされた提案やリスク予測の高度化を実現します。これにより、銀行は顧客体験の刷新や新たな収益モデルの構築を推進することができます。※ パソコン・タブレット・スマートフォンで、どこからでもご視聴いただけます。
今すぐ視聴する -
On Demand App Generation - Sooooooo much easier to implement! (VIDEO and samples...
Let's face it - it usually takes a bit longer for features and capabilities of any product to gain traction in an organization. We released On Deman... Show MoreLet's face it - it usually takes a bit longer for features and capabilities of any product to gain traction in an organization. We released On Demand App Generation in 2018 with our Qlik Sense client-managed edition. Frankly I don't have much insight into whom has or has not implemented it. BUT, I can tell you from those that I have spoken with over the years, many were surprised to even see this awesome feature in the product when I brought it up.
However, in older versions, in order to enable it - there were a number of requirements which involved copying data load script along with inserting bindings and variables - which at first glance could be perceived as cumbersome. Even the first time I worked with it, I was a bit overwhelmed. This was true for others as well, so much so, that some Qlik enthusiast even developed web app add-ons and extensions to simplify the process and generate the template for you.BUT....... since the release of ODAG, just like anything else, it has evolved and is now extremely simple to enable and implement. I show you this process in my latest Do More with Qlik (archive link below) session and summarize the ODAG concept in the latest Qlik Sense in 60 video embedded in this post - so please be sure to check them out. Let me know what you think in the comments below. Stay tuned to my next post where I build on what we learned about ODAG to introduce you to Dynamic Views!
On Demand App Generation - (ODAG - concept)
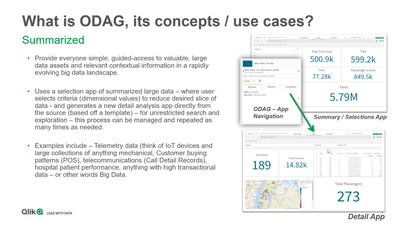
In summary, ODAG was originally developed to meet the need of analysis of very large data sets. The concept is quite simple:
- One Qlik Sense app displays summarized data with filters from the big data source.
- You select the filter values and reduce your answer set to meet a defined row count constraint.
- You click the app navigation link along the bottom to open the ODAG panel
- You click a button and a new more detailed app, dynamically built from a template, is generated directly from the source data with applied filters and defined metrics at a much more detailed level. That's it!
ODAG Requirements Summarized
- Qlik Sense base app (contains summarized measures as KPIS and desired dimension values as filters)
- Summarized data
- App Navigation link - linked to 2nd Qlik Sense template app
- Defined row count constraint
- App retention setting
- Qlik Sense template app (contains detail KPIs and detailed analysis metrics)
- Activation script with binding syntax
- WHERE conditions with odag_ binding variables added to query
Qlik Sense in 60 - On Demand App Generation (video)
(Video transcript attached)
Help Topics
Source data:
https://www1.nyc.gov/site/tlc/about/tlc-trip-record-data.page
Presentation:
Do More with Qlik Session - you may need to register to access it:
https://gateway.on24.com/wcc/experience/eliteqliktech/1910644/2395144/do-more-with-qlik-for-beginners-and-beyond
Register:https://pages.qlik.com/21Q3_QDEV_DA_GBL_DoMorewithQlikTargetpage_Registration-LP.html
Sample Apps attached - ODAG - Apps - Taxi Trips.zip - (Note you need to add your data connection and access SQL etc to your data sources)
Can't see the video? YouTube blocked by your region or organization? Download the .mp4 attached in this post to view this on your computer or mobile device.

-
【開催報告】Data Design Duel – 第 5 回 Qlik データソン
最初に、Qlik プリセールスの中嶋からの挨拶と今回の趣旨、評価基準などを説明しました。続いて、今回のアプリ審査員を務めた Qlik アナリティクス製品管理 ディレクター、Patric Nordström からのビデオメッセージをご紹介しました。流暢な日本語と英語を交え、「皆さまのアプリはとても素晴... Show More最初に、Qlik プリセールスの中嶋からの挨拶と今回の趣旨、評価基準などを説明しました。続いて、今回のアプリ審査員を務めた Qlik アナリティクス製品管理 ディレクター、Patric Nordström からのビデオメッセージをご紹介しました。流暢な日本語と英語を交え、「皆さまのアプリはとても素晴らしくて見るのが本当に楽しかったです。Qlik Analytics の新しい機能をふんだんに使ったアプリを審査する機会をいただいて光栄です。甲乙つけがたい数々の素晴らしいアプリを作成いただき、ありがとうございました。」と、参加者への感謝と労いの気持ちをお伝えしました。
■ファイナリスト発表
いよいよ全 58 のアプリを厳正に審査し、選出させていただいたファイナリストの発表です。Qlik プリセールスの鈴木から、20本のファイナリストのアプリの特徴を 1 つずつ丁寧にご紹介しました。どのアプリも力作で、他の参加者が作成したアプリのデザインを真剣な眼差しで見つめている会場の皆さんが印象的でした。
*チーム参加の場合はチーム名、個人参加の場合は個人名を記載しています。()内はアプリ名です。パートナー部門
ユーザー部門
吉野 智士さん(【Tennis】ATP Records) Inari623(HR analytics) インサイトクラン(人材管理システム) 川上 直人さん(Health Care) 上野 夏恋さん(Qlik Hue) Fujitsu DP All-Stars(日本食の世界における人気度) 久米 弘文さん(CX 分析) AI’M Qlik(HealthCheck) 杉山 奈緒さん
(ブランド比較アプリ・環境マネジメントアプリ)Data Practice Victors(MATCH COFFEE) SUZUKI(Google アナリティクスのデータ分析) 堀井 正敏さん
(宇宙(そら)からネットを見てみたら)Sayaka-Fukuhara(色彩図鑑) Under 31(CAR SELECTION) Tomo(航空会社Twitter 分析) やすぎーズ(経費管理) 老若男女
(SO Legends - Iconic Japanese Baseball Players)テクノプロジェクトデータ利活用チーム
(Qlik Facebook コネクター (コカ・コーラとペプシの FB ページ比較))YO(World Data Visualization) ■アワード受賞者発表
ついに…この瞬間がやってきました!デザイン王者の称号は誰の手に?!
Qlik の中嶋から、ユーザー部門・パートナー部門に分けて、それぞれの賞を発表しました。受賞者の皆さまには、後日、トロフィーと豪華賞品(Meta Quest 3S や Apple Watch など)を贈呈いたします。
*チーム参加の場合はチーム名、個人参加の場合は個人名を記載しています。()内はアプリ名です。パートナー部門
最優秀賞:SUZUKI(Google アナリティクスのデータ分析)
Google アナリティクスのデータを基に、レイアウトコンテナとアニメーションを組み合わせて制作しました。入口画面はインドの曼荼羅模様をイメージし、配色は赤を基調としたダークテーマという珍しい構成にしました。情報を前面に押し出すために基本はフィルターを排除し、必要な場合のみ右上から呼び出せるようにしました。ページ追加が容易になるよう設計し、SVG を活用した部品や Qlik Japan Blog の「Viz for Deck」を応用した表や地図も組み込んでいます。また、ユーザーがアクセスしたくなる仕掛けとして、おみくじが引ける機能を実装しました。結果は大吉から大凶までランダムに表示され、遊び心を加えています。優秀賞:Sayaka-Fukuhara(色彩図鑑)
業務とは関係なく、「自分の好きな色を詰め込む」ことをテーマにしました。構成は 4 シートで、1 シート目は表紙。ページを遷移する度に変わる名言を表示し、遊び心を加えています。さらに「おみくじ」機能があり、結果に応じて相性の良い色を表示します。最後の一覧ページでは、色自体やタイプ、モードで絞り込みが可能で、色相や彩度で並び替えもできます。背景色も変更でき、自分好みの色を探すことを楽しめるアプリです。審査員特別賞:久米 弘文さん(CX 分析)
「徹底的にシンプルにする」ことをテーマにしました。構成は、左側にアプリ概要のメニューと各シート上部にメニューバーを配置。画面上部にはフィルターと主要指標をまとめ、いつでも確認できるようにしています。チャートは 1 〜 2 種類に絞り、大きく表示して必要な情報をすぐ取得できる形にし、画面下部には説明を添えてガイドとして機能させています。全体を通して、他の作品とは異なるアプローチですが、シンプルさにこだわった点が特徴です。ユーザー部門
最優秀賞:川上 直人さん(Health Care)
今回のテーマは「デザイン」でしたが、画面の見た目だけでなく、ユーザーの気持ちや行動まで設計することが重要だと考え、ヘルスケアをテーマにアプリを制作しました。データをきれいに見せるだけでなく、健康への関心を高められるよう、遊び心のあるギミックや癒しになるイラストを散りばめています。アプリは英語と日本語の切り替えに対応し、ホーム画面では健康状態の概要を一目で確認できます。こだわりのギミックとして、水分補給量に応じて水位が変わる SVG 表現や、歩数に応じてキャラクターの動きが変化し、目標達成時には花吹雪が舞う演出を実装しました。また、筋トレアイコンを押すと体の部位ごとの疲労度を表示するなど、直感的に楽しめる仕組みも取り入れています。優秀賞:Inari623(HR analytics)
一人で短期間で開発したため、できるだけシンプルな画面構成を目指しました。「良いデザインは実用性がある」という考えのもと、SNS の UI を参考に、特に X(旧 Twitter)や Instagram を模した構成にしています。左側のアイコンをクリックすると画面が切り替わり、たとえば最上部のアイコンではデータ概要を表示します。差別化のため、アラート的な機能を実装し、異常がある場合は白い丸がオレンジ色のビックリマークに変わるなどの表示を行います。選択内容によってアラートの表示・非表示が切り替わる仕組みです。また、従業員詳細ページでは ID を選択すると顔写真を表示できるようにしました(画像は生成したものを利用)。全体的に実用性を重視し、華やかな他作品とは異なるアプローチをとったことが評価につながったと感じています。審査員特別賞:AI’M Qlik(HealthCheck)
ジムと内科の健康診断を想定したシステムです。内科ページでは、問診票に回答すると、心臓・肺・肝臓それぞれのスコアが表示されます。喫煙の有無などの回答内容に応じてスコアが変動し、さらにシート内で臓器を選択すると、その臓器の詳細結果が確認できます。ジムページでは、運動頻度や項目に応じて結果が変化します。こだわりとして、スコアに応じて臓器の画像が切り替わる仕組みを導入。スコアが低い場合は黒く変色した悪い臓器、高い場合は健康的な臓器が表示されるなど、視覚的にも結果を実感できるようにしています。受賞された皆さま、おめでとうございました!
なお、受賞者の Qlik Sense アプリは、日本語デモアプリサイト「Qlik Showcase」にて一般公開中です。ぜひ、ご覧ください!
また、10/28(火)開催「Qlik ユーザーミートアップ」では、入賞者による講演を予定しています。Qlik ユーザーまたは導入検討中の方であれば、どなたでもご参加いただけます。ぜひ、お申し込み・ご参加ください!
授賞式の最後は、クリックテック・ジャパン(株)執行役員 ソリューション技術本部長の濱野より、ご参加いただいた皆さまへ感謝のメッセージで締めくくりました。会場の盛り上がりはまだまだ続きます!Qlik の濱野による乾杯の音頭を皮切りに、懇親会がスタート。参加者同士の歓談はもちろん、よりカジュアルにお楽しみいただけるようダーツ大会を開催し、スコア順で Qlik のノベルティを選んでお持ち帰りいただきました。会話とダーツで盛り上がり、いつもと少し違うアワード授賞式&懇親会となりました。
そして、クリックテック・ジャパン(株)執行役員 エンタープライズ営業本部長の槙野より、最後のご挨拶と一本締めで盛況のもとに終了しました。
■最後に…
今回は、アプリ開発の達人のみならず、初心者でも挑戦できる “見た目が美しい魅せるダッシュボードだけ”を審査対象とした新たな試みのデータソンでした。審査員も唸るほどのアイデアとセンスを存分に表現した素晴らしいデザインのアプリを拝見し、「こんなこともできるんだ!」と、Qlik Sense の可能性を感じることができました。自身のスキルを試すだけでなく、他の参加者の成果物からヒントやアイデアを得られるのもデータソンの醍醐味ではないかと思います。ご参加いただいた皆さま、本当にありがとうございました!
-
Can just a few hours of student activity predict the future?
Stanford University researchers say yes. At the Learning Analytics and Knowledge Conference (LAK ’25), they revealed that looking at just two to five ... Show MoreStanford University researchers say yes.
At the Learning Analytics and Knowledge Conference (LAK ’25), they revealed that looking at just two to five hours of student activity in intelligent tutoring systems or educational games can predict, months in advance, how those students will perform on end-of-year standardized tests. Data from intelligent tutors helps predict K-12 academic outcomes, study finds | Stanford Report
Researchers analyzed only the early interaction logs and used machine learning to spot patterns. The surprise? These short-term models were just as accurate as those built from an entire year of data.
As Professor Emma Brunskill from Stanford explains:
“In education, we often are interested in delayed outcomes like end-of-the-year assessments, but it would be useful if we could predict those outcomes using shorter amounts of data from educational software platforms.”This shows you don’t need massive datasets to uncover valuable insights, you need the skills to interpret them. Early predictions like this allow teachers to act sooner, whether that means offering extra help or providing greater challenges.
That’s where data literacy comes in. When you know how to explore and interpret data, you can spot patterns early, act with precision, and track results over time.
The Qlik Academic Program helps make that possible, offering free access to Qlik Sense analytics software, self-paced training, certifications, and resources to apply insights ethically and effectively.
Ready to explore your own data?
Join for free: www.qlik.com/academicprogram
-
Community Manager Appreciation Day 2025!
Today is Community Manager Appreciation Day, and we want to take a moment to express our heartfelt gratitude to the incredible Community managers and ... Show MoreToday is Community Manager Appreciation Day, and we want to take a moment to express our heartfelt gratitude to the incredible Community managers and moderators who work tirelessly to make our Qlik Community a welcoming, engaging, and valuable resource for all.
Our Community managers wear many hats - they are mentors, problem-solvers, connectors, and champions of collaboration. Every day, they:
- Ensure our community remains a positive and supportive environment for learning and sharing
- Facilitate meaningful discussions and knowledge exchange
- Connect members with the resources and expertise they need
- Champion your feedback and ideas to improve our Community continuously
- Foster an inclusive space where everyone's voice matters
These dedicated individuals work behind the scenes to maintain the high standards of our Community while creating opportunities for meaningful engagement and growth. Their commitment to supporting your analytics, data integration, AI journey and fostering connections between members has been instrumental in building the thriving Community we all enjoy today.
We invite you to join us in celebrating our Community Managers and Moderators. Feel free to share your appreciation or a positive experience you've had in the comments below. Your kind words mean the world to them!
Thank you to our amazing Community Managers and Moderators for their unwavering dedication to making the Qlik Community a place we're all proud to be part of. @SarahUrbiss @Jamie_Gregory @nicole_ulloa @Melissa_Potvin @calebjlee @Tammy_Milsom
-
Qlik Automate: Changes to error handling for Qlik Reporting connector
Hello Qlik Automate administrators and users, Based on feedback, Qlik has changed the way errors are handled in the Qlik Reporting connector for Qlik ... Show MoreHello Qlik Automate administrators and users,
Based on feedback, Qlik has changed the way errors are handled in the Qlik Reporting connector for Qlik Automate. The change was rolled out on August 12th, 2025.
The following blocks will be replaced to facilitate the changes:
- Get Chart Image
- Get Pixel Perfect Report
- Get Tabular Report
The functional change of the new blocks centers on error handling. While the old blocks output a simple failed string in case of an error, we wanted to update this output to include the full error object, including the status code and reason.
Additionally, in certain situations, the old blocks would have a successful run even though the output is an error; we updated this behavior so the new blocks will error out in any situation involving an error.
What does this mean for me?
The old blocks were renamed, flagging them as deprecated. Example: Get Chart Image (deprecated)
The new blocks retain the old names and are referenced in the description of the old blocks.
The action needed by Qlik Automate administrators and users is to switch from the (deprecated) blocks to the new ones.
If you have any questions, we're happy to assist. Reply to this blog post or take similar queries to the Qlik Application Automation forum.
Thank you for choosing Qlik,
Qlik Support -
【10/28(火)13:00 開催】Qlik AI Reality Tour Tokyo 2025:Do Data Differently - データで常識を超...
Do Data Differently - データで常識を超える変革を - 来たる 10/28(火)、 The AI Reality Tour Tokyo 2025 を開催します。 AI の普及が急速に進み、誰もが AI のパワーを活用するようになりました。AI は、あれば便利なものではなく、今日... Show MoreDo Data Differently - データで常識を超える変革を -
来たる 10/28(火)、 The AI Reality Tour Tokyo 2025 を開催します。
AI の普及が急速に進み、誰もが AI のパワーを活用するようになりました。AI は、あれば便利なものではなく、今日のビジネスに欠かせないテクノロジーとなり、AI を効果的に導入・活用しない企業は後れをとるとも言われています。
なぜ、AI に Qlik なのか?Qlik は、強力なデータ統合、責任あるガバナンス、独自の分析エンジン、最先端の AI ソリューションで、AI を活用したインサイトの獲得を可能にし、最適な意思決定と行動をサポートします。
本イベントでは、予測 AI・生成 AI・エージェンティック AI を統合した Qlik の最新製品をご紹介する基調講演をはじめ、Qlik のユーザーが語る先進的な事例、Qlik のパートナー企業による最新のテクノロジーやソリューション、展示ブースなど、貴社の AI 戦略を成功に導く最新情報をご紹介します。
サッポロホールディングス(株)・松井証券(株)・富士通(株)の登壇決定!詳しい講演概要は近日公開予定です。お申し込みの締め切りは、10月 21日(火)17:00 までです。お早めにお申し込みください。
Qlik 認定資格受験の無料クーポンをプレゼント!本イベントにご参加いただいた方へ、ご希望に応じて Qlik 認定資格を無料で受験いただけるクーポンをプレゼントいたします。お申し込みの際に、ご希望の認定資格をご選択の上、お申し込みください。認定資格の詳細はこちらをご確認ください(英語のみ)。
※ 定員に達し次第、お申し込みを締め切らせていただきます。
※ 定員を上回った場合や競合他社のお申し込みは、参加をお断りする可能性がございますので、予めご了承ください。
※ お席をご用意できた方には、「申し込み完了」メールをお送りします。また、10/27(月)に、配信元 E メールアドレス「noreply@event-planner.net」から入場用 QR コードを E メールでお送りします。
※ プログラムは予告なく変更になる可能性があります。予めご了承ください。
※ 開催報告記事などのための撮影が入る予定です。お姿や資料などが認識できない形での公開に配慮いたしますが、予めご了承ください。【開催概要】
日時:2025年 10月 28日(火)13:00 - 18:00(12:00 受付開始)
懇親会 18:00 - 19:00
会場:神田明神ホール
東京都千代田区外神田2-16-2 神田明神文化交流館2F参加費:無料
お問い合わせ:Marketingjp@qlik.com までお問い合わせください。 -
Nike best Models for last 5 years
Nike best Models for last 5 years Lupus Analytics Infocharting o show last 5 years of Nike top selling shoes. Discoveries AIr Max is still... Show MoreNike best Models for last 5 yearsLupus AnalyticsInfocharting o show last 5 years of Nike top selling shoes.Discoveries
AIr Max is still the best selling Model
Impact
Not sure
Audience
It has been posted on Linked in
Data and advanced analytics
not sure
-
Coming 8/20 to Qlik Learning: My Learning & Up Next Update
We are excited to update Qlik Learning with the newly designed learning experience My Learning. My Learning consolidates Favorites, History, Skills,... Show MoreWe are excited to update Qlik Learning with the newly designed learning experience My Learning.
My Learning consolidates Favorites, History, Skills, Credentials, Challenges into a single, intuitive spot for your learning experience. My Learning can be accessed via Top Navigation Menu (requires logging into Qlik Learning with your Qlik Account) You will no longer see Plan.
Or via Learner Dropdown:
A new Up Next feature included within the My Learning is a single, dynamic view that keeps learning relevant & help prioritize and track dynamically ordered required, recommended, and self-enrolled learning. Completed enrollments are automatically cleared while remaining accessible in the History tab or in Favorites.
What will happen to my existing user plans?
Your existing Plan will be migrated to My Learning. Once we launch on Wednesday, 8/20; the top nav Plan page will automatically be disabled and My Learning will be enabled.
Will Manage Tab on Top navigation be still available for Managers?
Yes, the Manager tab will still be available for managers to be able to assign Required or Recommended training to their teams.
How does Up Next prioritize learning?
Up Next uses a three-tier priority system:
-
Overdue and next-due required courses (within the next 7 days).
-
Required or due-date courses beyond 7 days.
-
Elected or optional courses.
Can I manually sort or filter Up Next?
Yes, you can temporarily sort and filter their Up Next list during a session. However, the default view will always revert to algorithmic sorting upon page refresh or return.
Can I remove completed courses from Up Next?
Yes, completed enrollments are automatically cleared from Up Next. They remain accessible in the History tab within My Learning and, if Favorited, they will remain in their Favorites tab.
Log into Qlik Learning to see the updated Navigation.
Reach out to us on any question at education@qlik.com Happy Learning!
-
-
Qlik Talend Cloud Introduces Cross Project Pipelines and AI Processor for Snowfl...
I’m thrilled to write this installment of Qlik’s innovation blog because the new Qlik Talend Cloud features I’ve chosen to highlight are two of the ca... Show MoreI’m thrilled to write this installment of Qlik’s innovation blog because the new Qlik Talend Cloud features I’ve chosen to highlight are two of the capabilities I’ve been testing over the past few weeks. So, without any further ado let's dive into these exciting new capabilities!
Cross Project Pipelines
Since it’s inception, Qlik Talend Cloud pipelines have offered straightforward design metaphor. Often, you’d create a pipeline for a single data source that continually landed, merged and transformed data changes into a single target, such as a cloud data warehouse or lake. As time progressed the ability to add multiple data sources to a pipeline was introduced, and dedicated replication tasks with multiple targets followed a short time later.
Qlik Talend Cloud Data Pipelines
However, many customers gave feedback that they’d like pipelines to be more modular, especially as projects became bigger and more complex. Modularity would not only increase component reusability, but also enable pipelines to be segregated by business domain. In addition, pipeline development would be more flexible while adhering to the best data-design practices.
Well, I’m happy to announce that “Cross Project Pipelines” are now generally available in all tenants. You can split complex pipelines consisting of multiple ingestion and transformation tasks into components that can be reused by other projects providing greater design flexibility and simplified pipeline management. In addition, Cross Project Pipelines can be segregated by data domain to encourage Business Domain Data Product or Data Mesh design principles.
Cross Project Pipeline
AI Processor Snowflake Support
At the end of 2024, we released an AI processor that allowed you call native Databricks AI functions in a Transformation Flow without the need to hand code SQL. Databricks AI functions are a set of built-in SQL functions that allow you to apply AI directly to your data within SQL queries. This means you can use powerful AI models for tasks like sentiment analysis, text generation, and more, all from your Qlik Talend Cloud pipelines. If you can’t remember that far back then checkout this Qlik community blog post “Inject AI into your Databricks Qlik Talend Cloud Pipeline”
While many of our Databricks customers were overjoyed, the Snowflake proponents felt very left out, regularly commenting that Snowflake Cortex offered similar features too. Those comments were frequently followed by the question of “When will Qlik’s AI processor support Snowflake too?” Once again, I’m happy to say we’ve listened, and now the AI processor also supports Snowflake Cortex AI functions as well! The details of how to use Snowflake Cortex go beyond the scope of this blog post but stay tuned because a detailed article and demo of this feature will be published shortly. Until then, look at the screenshot below to see the AI processor in action and follow the link for more information about Snowflake Cortex LLM functions.
Transformation Flow and AI Processor
Wrap Up and 2025 Roadmap Webinar
Well there you have it. Two great new features that expand the usefulness and uses of Qlik Talend Cloud, but it doesn’t stop there. If you’re curious about what other innovations, enhancements, and improvements are coming to the Qlik platform in 2025 then join our Qlik Insider Webinar - Roadmap Edition that’s taking place on February 26th. Follow this link and register today!
-
Qlik Academic Program and ICT Academy engagement
ICT Academy is a non profit institution based in Chennai an initiative of the Government of India in collaboration with the state Governments and Indu... Show MoreICT Academy is a non profit institution based in Chennai an initiative of the Government of India in collaboration with the state Governments and Industries. They work on various initiatives with their goal of skilling students and educators on new technologies and making them job ready. Besides their home state of Tamil Nadu, they have a presence in many States in India, including Maharashtra, Telangana, Karnataka, Andhra Pradesh etc.
In the last 13 years, ICT Academy has strived on every aspect to provide a holistic service to every stakeholder of the education ecosystem in developing the next generation of talent pool in India to make them industry ready employees, innovators, entrepreneurs and leaders.
Through its various initiatives, ICT Academy has been part of strengthening the India’s four important visions on Skill India, Digital India, Startup India and Make in India. ( reference: https://ictacademy.in/)
With the Qlik Academic Program, the relationship with ICT Academy has been very active during their annual campaign, called Learnathon which opens the doors for students and faculties to get trained on various technologies in a time bound manner. During this campaign, over 1.5 lakh students potentially get trained on new technologies through the learning and academic platforms of vendors like Qlik.
This year too, Learnathon has been planned in August and September and will see many students getting skilled and ready for the job market. We are hoping many students are onboarded with the skills required in data analytics with the Qlik Academic Program's latest offerings. They have an opportunity to get trained on Qlik Sense, one of the in-demand data analytics software and also get qualified and certified on the courses offered under this program. Over 3500 colleges and university students have already benefitted from this program.
If you wish to know more about the Qlik Academic Program, visit: qlik.com/academicprogram
-
Ferrari's 7 best models
Ferrari's 7 best models Lupus Analytics Ferraris best models of their cars Discoveries Ferraris has best cars Impact Ferraris F80is t... Show MoreFerrari's 7 best modelsLupus AnalyticsFerraris best models of their carsDiscoveries
Ferraris has best cars
Impact
Ferraris F80is the fastest of the all.
Audience
All users
Data and advanced analytics
fasfas
-
Qlik Automate: Change in Automation Connection permissions for Analytics Admin r...
Hello Qlik Automate admins and users, Previously, it was possible for Analytics Admin to move an existing automation connection to another user’s pers... Show MoreHello Qlik Automate admins and users,
Previously, it was possible for
Analytics Adminto move an existing automation connection to another user’s personal space. This behavior has been deprecated as personal spaces are meant to be private and exclusively managed by the space owner or Tenant Administrators.What does that mean for me?
No action is required from your end.
When will this change be implemented?
The change was implemented today, on August 7th, 2025.
If you have any questions, we're happy to assist. Reply to this blog post or take similar queries to the Qlik Automate forum.
Thank you for choosing Qlik,
Qlik Support -
Qlik Trust Score for AI: Evolving Data Trust for the Next Era of AI-Ready Data
AI is only as good as the data that fuels it. Yet AI use cases introduce new challenges beyond traditional data quality. It’s no longer enough for dat... Show MoreAI is only as good as the data that fuels it. Yet AI use cases introduce new challenges beyond traditional data quality. It’s no longer enough for data to be complete and documented—it must also be accurate, timely, and diverse enough to drive meaningful, bias-free outcomes. Whether you're training machine learning models or powering real-time decision systems, AI-ready data needs a different lens for trust.
Earlier this year, we introduced Qlik Trust Score in Qlik Talend Cloud — a quality indicator that consolidates critical data quality metrics such as completeness, discoverability, and usage into a single, intuitive score. We also introduced the Six principles of AI-ready data, giving organizations a practical framework & associated services to assess not just the reliability of their data, but its readiness to drive AI-powered outcomes.
Then, in May 2025, at Qlik Connect, we took the next leap forward within the product, introducing Qlik Trust Score for AI as a capability integrated within Qlik Talend Cloud. As organizations double down on AI adoption, the definition of trusted data must expand to meet the specific demands of machine learning and intelligent automation. Qlik Trust Score for AI builds on our original framework by introducing new, purpose-built dimensions — empowering teams to evaluate whether their data is not only trustworthy but truly fit for AI.
Building AI confidence through Diversity, Accuracy, and Timeliness
To help organizations operationalize data for AI, we've introduced three new dimensions into Qlik Trust Score, rooted in our six principles for AI-ready data.
AI-specific dimensions of Qlik Trust Score
Diversity
Evaluates how representative and well-distributed the dataset is relative to expectations. In AI, biased or narrow data leads to skewed outcomes and poor generalization. A high diversity score indicates that the dataset covers a wide range of relevant scenarios, populations, or types, ensuring that AI models are trained on broad, balanced, and inclusive information. It is calculated as a function of content evenness and expected volume—measuring how well values are balanced across the rows and columns, and whether enough data is present.Configuring the diversity dimension of Qlik Trust Score for AI
For example, A customer churn model trained only on data from urban regions may underperform for rural customers. A high diversity score ensures the dataset includes varied geographies, age groups, and customer types, reducing blind spots in prediction.
Accuracy
Measures how well data aligns with known or expected truths using customizable validation rules. Inaccurate inputs can lead to compounding errors in AI systems, where even small mistakes can scale into significant misjudgments. By defining custom data quality rules under the “Accuracy” category, these rules can affect the accuracy dimension, allowing teams to quickly identify and address the most critical issues impacting model performance.Categorizing the quality rule for the Qlik Trust Score
For example, in a predictive maintenance system, incorrect temperature readings from sensors (e.g., due to miscalibration) can cause false alarms or missed failures. Accuracy checks can flag such outliers or mismatches against expected ranges, preventing faulty model behavior.
Timeliness
Ensures that data is timely and reflects the most current state of the business or environment. For AI applications—especially those involving real-time predictions or automation—stale data can mean outdated or irrelevant outputs. This is calculated using an increasing function based on data pipeline updates. Thresholds can be defined to specify how recent data should be —once data falls outside that freshness time window, the score decreases.Configuring the timeliness threshold window
For example, in a fraud detection model, transaction data that is even a few hours old may miss flagging a fraud as it happens. A high timeliness score ensures your model uses the freshest available data to catch data issues in real time.
Trust Over Time: Monitoring Data Quality Trends for AI Confidence
AI doesn’t just require high-quality data on a one-off basis — it demands consistent, high-quality data. That’s why we’ve introduced Trust Score Historization in Qlik Talend Cloud, transforming trust from a one-time evaluation into a continuous practice that can be monitored over time.
With this capability, you can:
- Track trends in data quality across weeks or months to catch emerging issues early
- Correlate performance drops with changes in key quality dimensions like freshness or accuracy
- Audit how changes to configurations or quality rules impact trust over time
Viewing the events and dimension updates to Qlik Trust Score over time
Conclusion
Qlik Trust Score for AI goes beyond a simple quality check — it’s a way to evaluate whether your data is truly fit for AI use-cases. With added AI-specific dimensions like accuracy, diversity, and timeliness, and the ability to monitor trust over time, it helps organizations deliver data that drives reliable, responsible AI outcomes.
Available in Qlik Talend Cloud Enterprise Edition, Qlik Trust Score is also foundational to building trusted data products