In the Qlik Application Automation editor, you can use the formula 'Number' to cast a string to a number format.
However, if the string provided contains other characters than the number you want to convert (ex: a hidden space character) the formula
...In the Qlik Application Automation editor, you can use the formula 'Number' to cast a string to a number format.
However, if the string provided contains other characters than the number you want to convert (ex: a hidden space character) the formula will always output '0'.
Resolution
Before using the 'Number' formula, use the 'Trim' formula on the provided string, in order to remove all the spaces.
- Tags:
- blendr.io
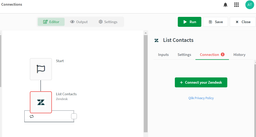
While building automations using the automation editor, you can add multiple connections to a connector.
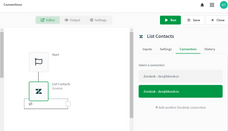
To do this, select one of the blocks in your automation and go to the "Connections" tab in the menu on the right.
If the connector this block belon
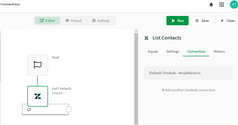
While building automations using the automation editor, you can add multiple connections to a connector.
To do this, select one of the blocks in your automation and go to the "Connections" tab in the menu on the right.
If the connector this block belongs to doesn't have a connection connected, connect one by clicking the green button.
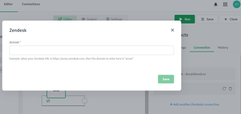
Steps to add an extra connection:
- Click on 'Add another connection'.
- Complete the form & click "Save".
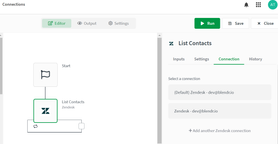
Once multiple connections are connected, you can select a connection to use for this block.
Steps to choose a connection:
- Click on the connection from a block's connections list as shown above.
- The selected connection should now be highlighted in green.
- Do this for all the blocks in your automation that have multiple connections.
- Labels:
-
How To
-
Workflow and Automation
QlikView allows for automatic license assignment to end-users.
This follows a First come, first served method. Licenses are assigned as soon as a user opens a QlikView document from the AccessPoint.
Environment
- QlikView any version (license depe
QlikView allows for automatic license assignment to end-users.
This follows a First come, first served method. Licenses are assigned as soon as a user opens a QlikView document from the AccessPoint.
Environment
- QlikView any version (license dependent)
Automatic assignment of Professional and Analyzer Access License
- Open the QlikView Management Console
- Navigate to System
- Click Licenses
- In the menu on the left, choose your Signed License Key
- In the menu to the right, choose Professional And Analyzer access
- Open the General tab
- Choose whether you want Allow dynamic assignment for Professional access or Allow dynamic assignment for Analyzer access or both.
- Click Apply
If both Professional and Analyzer licenses have been enabled for automatic assignment, then the following priority list is followed:
- Professional Access
- Analyzer Access
- Analzyer Capacity (If you have a Dual license for QlikView)
Automatic assignment of CALs (Named User CALs)
This setting only covers the automatic assignment of Named User CALs. Usage CALs and Session CALs are always automatically assigned. Named DOCUMENT CALs need to be enabled for automatically assignment separately. See How to assign a document CAL in QlikView Management Console? for details.
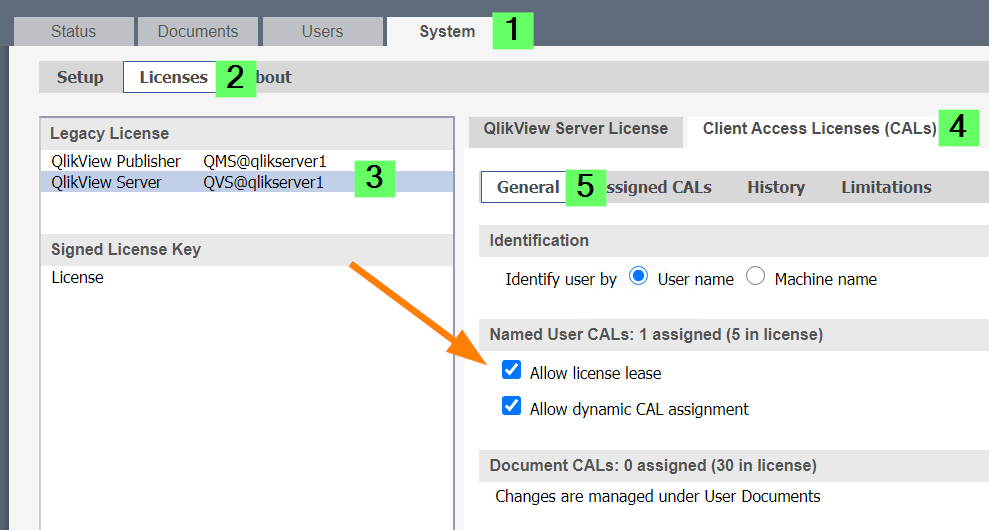
- Open the QlikView Management Console
- Navigate to System
- Click Licenses
- In the menu on the left, choose your QlikView Server license in the Legacy License or License section (depending on the version, the label may be different).
- In the menu to the right, choose Clieng Access Licenses (CALs)
- Open the General tab
- Enable want Allow dynamic CAL assignment
- Click Apply
The following priority is followed when assigning licenses:
- Named Document CAL
- Named User CAL
- Usage CAL
- Session CAL
Related Content
How to assign a document CAL in QlikView Management Console?
How to assign and remove a Named CAL
Everything there is to know about QlikView and its licenses and CALs
- Labels:
-
Configuration
-
License
Accessing to Qlik Sense using Safari web browser or Qlik Sense Mobile with a phone, tapping in a filter pane, when you select any specific field, the list of values overlaps the rest of fields.
Environment
- Qlik Sense Enterprise April 2020
- Qlik Sen
Accessing to Qlik Sense using Safari web browser or Qlik Sense Mobile with a phone, tapping in a filter pane, when you select any specific field, the list of values overlaps the rest of fields.
Environment
- Qlik Sense Enterprise April 2020
- Qlik Sense Mobile (any version)
Resolution
Information provided on this defect is given as is at the time of documenting. For up to date information, please review the most recent Release Notes, or contact support at support.qlik.com with the ID QB-3192 for reference.
Fix Version
- Qlik Sense Enterprise November 2020
Cause
Product Defect ID: QB-3192
- Tags:
- mobile
- qlik sense
- Labels:
-
Administration
-
App Development
In a Server environment, all bookmarks for a Qlikview document randomly and intermittently disappears.
Possible symptoms:
- all users accessing one ore more dashboards are not seeing any bookmark for that specific dashboards, nor its server objects, f
In a Server environment, all bookmarks for a Qlikview document randomly and intermittently disappears.
Possible symptoms:
- all users accessing one ore more dashboards are not seeing any bookmark for that specific dashboards, nor its server objects, for a limited time
- accessing the Server Objects pane for a document in the QlikView Management Console (QMC), all the bookmarks and objects for that document are temporarily missing.
- .shared file get occasionally corrupted and need to be recovered from backup. This might also happen with .tshared files, but it's less common
- event logs show problems locking .tshared files because "Insufficient system resources exist to complete the requested service"
Environment
- QlikView server, any
Resolution
Verify that a supported file server is used to host the files.
QlikView Server currently only conforms with Windows File Share or a Windows-shared NAS. This means that storage must be owned, governed, and shared by a Windows operating system instance (typically accessed using a path like \\<servername>\<share>). Clustered Windows file servers are supported as long as they are of the Active-Passive type.
NASses accessed directly (not shared by a Windows server) are not supported.
Active-Active Windows cluster (including Scale-out fileservers) are not supported.
Cause:
The system is not able to correctly access the .tshared and .shared files.
- Labels:
-
General Question
In the Does QlikView Support NAS Storage? Knowledge Base article, it is mentioned that "QlikView Server currently only conforms with Windows File Share or a Windows-based NAS."
Does that mean that Windows clusters are supported as file servers?
E
...In the Does QlikView Support NAS Storage? Knowledge Base article, it is mentioned that "QlikView Server currently only conforms with Windows File Share or a Windows-based NAS."
Does that mean that Windows clusters are supported as file servers?
Environment
- QlikView server, any
Resolution
QlikView supports clustered Windows File Servers, as long as they are of the Active-Passive type.
Scale-out File Servers, being of the Active-Active type, are not supported.
- Labels:
-
Configuration
-
Installation
QlikView Server/Publisher currently only conforms with Windows File Share or a Windows-based NAS. This means that storage must be owned, governed, and shared by a Windows operating system instance (typically accessed using a path like \\<servername>\
...QlikView Server/Publisher currently only conforms with Windows File Share or a Windows-based NAS. This means that storage must be owned, governed, and shared by a Windows operating system instance (typically accessed using a path like \\<servername>\<share>), without emulation of CIFS/SMB file systems.
Environment
- QlikView Server / Publisher, all version
Microsoft Storage Spaces Direct storage technology doesn't comport with QlikView Shared Network Storage requirements listed under Requirements for Clustered QlikView Deployment. Therefore, Microsoft Storage Spaces Direct storage is not supported for use with QlikView Server/Publisher
Related Content:
Qlik Alerting Monitoring app fails with 404 Not Found Error
Environment
- Qlik Alerting November 2020 SR1
Resolution
Replace the Qlik Alerting Monitoring app with the attached file to this article.
Information provided on this defect is given as
...Qlik Alerting Monitoring app fails with 404 Not Found Error
Environment
- Qlik Alerting November 2020 SR1
Resolution
Replace the Qlik Alerting Monitoring app with the attached file to this article.
Information provided on this defect is given as is at the time of documenting. For up to date information, please review the most recent Release Notes, or contact support at support.qlik.com with the ID QIAB-344 for reference.
Workaround:
Replace the Qlik Alerting Monitoring app with the attached file to this article.
Fix Version:
- Qlik Alerting February 2021
Cause
Product Defect ID: QIAB-344
The monitoring app was using some experimental API endpoints that have been deprecated.
- Labels:
-
Administration
This is the FAQ for the Talk to Experts Tuesday Qlik GeoAnalytics/GeoOperations session on February 9th, 2021. The recording and transcript can be found here.
What is the roadmap for Qlik GeoAnalytics in Qlik Sense SaaS?
When we started out with G
This is the FAQ for the Talk to Experts Tuesday Qlik GeoAnalytics/GeoOperations session on February 9th, 2021. The recording and transcript can be found here.
What is the roadmap for Qlik GeoAnalytics in Qlik Sense SaaS?
When we started out with GeoAnalytics, it all started out with the extensions, the connector and the server. These are the three things that make GeoAnalytics work. Since then, we integrated much of the mapping functionality or the visualization part inside of the native map chat. So, that is how we will take that farther. So the extensions will diminish over time.
As for the connector that extends Qlik Sense and QlikView’s operational abilities when it comes to spatial, they are being superseded with the GeoOperation service. So that is how we will do things in the future. I hope in the future also that we can see GeoOperations for QlikView and Qlik Sense but right now you are using the connector for QlikView, Qlik Sense on premise and the GeoOperations on SaaS.
What I’m hoping to do in the near future for GeoOperations in SaaS is to make it a bit simpler. We will hopefully allow for accessing GeoData directly on data file. So, you can drop a shape file or JSON file in your data files and that will be much easier to extract. I’m also hoping that we will have a small connector where you can add a URL or point to a file and then it produces the GeoOperation line for you so it will be easier to load Geo data. Of course, there are many things that you could do with GeoOperations but that’s the things that I can oversee right now.
There is also a Qlik Insider webinar coming up on June 3rd for Qlik Data Analytics that might give you some more information on what’s to come. The registration page is not up yet but should be soon. You can find this on the Events & Webinars page on Qlik Community.
I have a question if it is possible to use Signed License Key for multiple QSE implementation which are geographically separated? Would be possible to get a contact a discuss it in more detail, please?
With GeoAnalytics, we are using the LEF key today, the text based key, in the server and the extensions. It’s important that you use the same key in the server as well as in the extensions. So those of you with the signed keys today, you can ask sales operations and get LEF key that you can use for GeoAnalytics. It’s a bit of a manual process to contact sales. For the coming release in May, we will be able to handle the signed key in all parts of GeoAnalytics but it still stays the same that you have the same signed key on the server as well as on the extension side if you are using that type of setup. If you have multiple setups, you shouldn’t blend the different signed keys, you should just use one signed key. That server can then server multiple Sense environments.
Can we compute area and length with the Qlik GeoAnalytics connector for Enterprise on Windows?
For area calculations, that type of calculation we don’t do in GeoOperations today. The closest to the calculation is the route calculation. That we do, but we don’t do any area calculations in Sense or GeoAnalytics and we don’t have any plans to add that I think. Area calculations is somewhat special, I haven’t heard so many asks for that among the client base. Of course area calculations is a well-known field in GIS but I’m not sure if that’s the number one functionality that we should add to GeoAnalytics today.
Please search/add your idea to Ideation so that interest can be tracked.
Complex intersections often fail and I sometimes have to resort to Python workflow to solve. This is for the connector on Enterprise on Windows.
I haven’t come across that much. It might be that the customer is trying to do intersect with really large polygons, maybe that’s the problem. I’m not sure whether he’s running cloud or his own server. It might be the case that he has to increase the available memory for the server process (please see How do I configure available memory for Qlik GeoAnalytics Server). But intersect is a heavy operation. You should make some decisions rather is it necessary to have that high resolution on the that you calculate intersect on. It might be possible that you could simplify the areas a bit before you make intersect. It doesn’t work in all cases. Sometimes you need all the breakpoints. Especially if you blend several sources of information, the it’s good to have a common resolution for across all of your areas that make sense. So you’re not having one that is super detailed and bogs down your computations.
If you can provide an example, please post it to the Qlik GeoAnalytics Discussion forum and someone can help.
Where can we find documentation and examples on how Qlik GeoAnalytics works with QlikView? There is limited examples from what I can find online.
You can find all of the documentation for Qlik GeoAnalytics for QlikView on the Help site. You will also want to check out this post, New to GeoAnalytics? as there are a lot of references available here. Also, there are some QlikView Examples that provide QVW’s for you to take a look at. If you have any questions, please post to the Qlik GeoAnalytics Discussion forum and someone will be able to help.
I have geo data coming in from ESRI. And I believe that data comes in US feets. Can you show us how to convert it into Qlik readable format using geo connector?
Here is instructions on uploading an ESRI file that provides a sample ESRI file as well as a QVF and QVW.
When you’re talking the data coming in as US feets, normally you need more information about the coordinate system than that it’s just based on feets. There is something called the EPSG code which is a shorthand code for the reference system that you’re loading the data from. Sometimes when you load data, the information on the reference system is incorporated into the file but sometimes it is missing. So, when you run the connector, you will have to enter this code and that is sometimes the information is lost. Then you have to go back to the source and find out which is the reference system and there are thousands of reference systems to sometimes these can be hard to guess. In an ESRI shapefile there is usually a file called PRJ file, which holds the projection information. Sometimes it’s just variables and sometimes it’s names that you can figure out the code for. Normally you would do a search as well.
Maybe you get the coordinate system is not NAD83 and then you do a Google search to find the EPSG code. There are sites that will interpret the PRJ file and get you the code that is necessary. Given that you have a PRJ file, they are not necessary.
Where is the documentation for GeoAnalytics with Qlik Sense?
You can find all of the documentation for Qlik GeoAnalytics for Qlik Sense on the Help site. You will also want to check out this post, New to GeoAnalytics? as there are a lot of references available here. There are a lot of QVF files provided as examples that you can try to recreate as well.
Would it be possible to control zoom levels dynamically?
It’s not possible today to do it programmatically make the maps zoom in or out. It’s either you zoom it by user interaction or you have auto zoom on and then it will adapt the zoom level to the points that you have on the map. We have been discussing whether we should have some kind of API towards the map chart that you read or set certain variables. You could then figure out the zoom level or change the zoom level of the map. Nothing is decided so it might be possible in the future.
What you can do, you can decide which layers that should control the zooming. So, you could have an invisible layer that you are manipulating indirectly to make the map zoom in and out based on the bounds of this hidden or transparent layer.
My license says I have GeoPlus, do I need to install it? What is it for?
If you have a GeoAnalytics plus tag in your license, you should install it. Here are the instructions to install GeoAnalytics Plus. You must have Java installed and it must be 64-bit. It also must be at least Java 8. That’s very important because GeoAnalytics depends on Java for communicating with the server. Also, make sure you only have one version of Java installed.
You can find the benefits of GeoAnalytics Plus on the Help site. Primarily, you can connect to local databases and limits are removed for process with this connector.
What resources are available for GeoOperations?
We have a whole website about GeoOperations. GeoOperations is done on the backend in the script. It is especially focused on our SaaS offer. We have a whole bunch on how to use any operation, how to migrate. There are people that are used to using the wizard but now have to translate operations in this script so it shows how to convert that. We have more examples in the Community as well. If you have any questions or need assistance, please post to the Qlik GeoAnalytics Discussion forum and someone will be able to help.
How do I Geocode?
For Qlik Sense on Windows you can enter addresses into an inline table or you can bring addresses from an excel spreadsheet, a database or csv files. You can then use the GeoAnalytics connector and choose AddressPointLookup and use the wizard. Match the fields to the fields in your table. Then click Next. Then insert the script and run the app. You can then plot the point. To see a demo of this, please watch the recording at 30:45.
You should also use our template because we want you to save your results. It allows you to store the geocoding results in between sessions so you don’t have to reload all the addresses every time. You only need to do it once and then it stores it into QVD files.
So with this template, first I load the addresses then I try to load the cache if there is one, otherwise it will select the new ones around the lookup operation. You’ll get a quality match on how good the input address matches the output address. You will also get the matching level whether you get it on house number or just on streets, you get to match on the street or if you get it on the zip code or on the region or on the country, which is the lowest form of precision. To see a demo of this, please watch the recording at 34:30.
Some tips you should consider:
- Make sure that you have data fields with proper information
- The quality of the lookup is highly dependent on the data
- Make sure the address field only contains the address, not phone numbers or apartment numbers
- If you know for example, the State information is not good, then you should omit that information rather than put it in
- Sometimes abbreviations are used for streets, you should try to write that out if possible
- Zip code or postal code has really high precedence so if you suspect that something is wrong with that zip code information then you should leave it out
- If you have a large amount of data to geocode, start with a smaller subset to make sure everything loads properly and all my field names are correct and the data looks fine. Then run and look at the results.
- Between 5 and 10% of addresses will be faulty. These will be filtered out and you can manually fix them (preferably within the source)
Address to point and point to address is not part of the standard analytics so it’s a subscription that you acquire. It allows you to do 1 million lookups during one year but you are allowed to store the results and use them for other purposes. For more information, please contact your Account Manager.
Can the UI "get" the current zoom level?
That ties into the previous question regarding how to control the map chart. You can’t do that today. If you have auto zoom on it will automatically zoom into the bound of the current layer. If you know which layer controls the map, you could calculate the bounds of the points and from there calculate backwards the zoom level. The actual zoom level is hidden where you have to switch it over in the Properties panel and you can switch on the debug info. Then you will see the current resolution and zoom level where you are. Normally you would use that information to control which layer shows when you have switch layers on and off by zoom level.
Can you set background layer (ie satellite, pale, default) dynamically?
There is this exploration menu, here you can control the different type of base map layers. That is one way to do it. Another way to do it is to programmatically control and you can switch between the options.
A basemap layer is where you set the endpoint with a URL. In this case I am using a field to control the URL but you could use a variable instead if you want. Here is an example: Setting up a TMS as a background map in Qlik GeoAnalytics.
Is Auto-Select visible available in "native map"?
So that is a feature that we had in GeoAnalytics for Qlik Sense which allows you to do selections based by zooming and panning in the map. It uses a spatial index. So that is a functionality that we haven’t brought into the map chart. In the future I think we will do something similar to how the scatter plot works. With the smart data compression, there are engine functions to create binning layers and load data on demand. So, we will probably use that instead. But it’s not available for QlikView and it’s not available in the native map chart yet.
Is there an end-of-life for the GeoAnalytic extensions?
We have not set up the end-of-life date yet for the GeoAnalytics Extensions but it will come. I encourage everyone to use the native map chart instead, at least for Sense because in QlikView they will stay. But for Sense, the native maps now have much more functionality. We have the WMS wizard, we have background layers, there is a lot more functionality. Printing works in a different way. Export is better as well. So I encourage everyone to use the native map chart
Are lat/longs required to plot data?
I am assuming that question is about using the native map. No. You can use any named area or named point. For example, if you load your city name and map it, it will show your city. Maybe you have to adjust your country because for example we have one state here in Brazil that is AL for us and you have a state that is AL as well. So, you have to set the country properly.
What is the difference between GeoAnalytics and GeoOperations?
GeoAnalytics is a platform. We are talking about the extensions and the connector and the operations. But as Patric said, as we move forward it will be about the native map chart and GeoOperations service and the analytics server. There are many advantages to using the GeoOperation compared to the connector. The connector is based on the connector API which is not really meant to do the type of operations that we do. For instance, it’s much easier to load a shapefile. It’s much more condensed code. When you do an operation on a loaded table, much of the code that the connector produces is for chopping up and sending the parameters to the map server and back. But now we are using the service side extension API to stream the internal table to the map server and result back. It will simplify a lot and it’s faster and more efficient.
Uber's H3 Hexagonal coverage is stable (size-wise) and is available at many zoom levels. Might be an interesting supplement to current binning. Thoughts?
There’s many ways to do binning. We provide two different binning methods today. We have a square based binning that is degree based, and then we have hexagon binning, also degree based. But there are ways to do binning. You can actually create your own binning as well by making computations. If you produce binning layers in a different environment, you could also incorporate them into your analytics. I don’t have a specific option on Uber’s product but I will look into it and see if we can make an integration.
- Labels:
-
General Question
This article describes how to resolve the following issues when using Qlik NPrinting Designer:
- Clicking 'Edit' to open the template editor in the NPrinting web console, the report template appears with extreme magnification, a zoomed appearance.
- NPr
This article describes how to resolve the following issues when using Qlik NPrinting Designer:
- Clicking 'Edit' to open the template editor in the NPrinting web console, the report template appears with extreme magnification, a zoomed appearance.
- NPrinting tags cannot be dragged into a report template
- The Designer fails to open with errors or may open and generate preview errors
- After the splash screen appears, nothing happens but the NP designer process runs in the Windows Task Manager
- The NPrinting Designer crashes
Requirements:
- Qlik NPrinting Designer and Server MUST be the SAME version
- The following steps MUST be performed on all monitors attached to the computer where the NPrinting Designer is installed.
- NPrinting Designer accessed from Citrix'virtualized' desktops is not supported. Use a physical computer desktop to install NPrinting Designer only. See Unsupported Configurations
- If you are working with a currently supported version of Qlik NPrinting and, pay particular attention to solutions One and Three below.
If you operating an unsupported NPrinting Designer and Server, you will need to upgrade to a supported version.
Environment
- NPrinting Designer: All Versions
- Windows 10
Resolution
Solution One
- Installation of a local copy of MS Office 2019, 2016. 2013, 2010 (Office 365 is not officially supported prior to June 2019 NPrinting release).
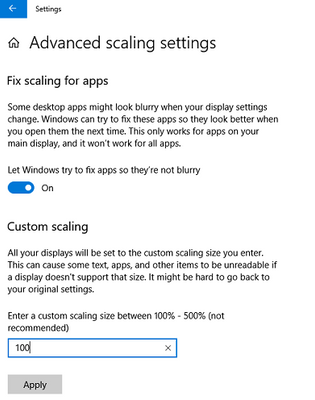
- Advanced Scaling/Zoom level which must be set to 100 percent on the Windows OS to prevent any further Excel template editor issues on open.
- You must sign out of Windows then sign in again before attempting to open the Qlik NPrinting Designer again.
- You may need to Reboot your computer to fully apply/complete the changed settings if signing out then signing back into windows does not solve the issue.
Note:
- Remote Desktop connection: If you are connecting to the NPrinting Designer through a Remote Desktop Connection to another computer, you need to update your local laptop/desktop computer operating system display settings/advanced scaling settings are set to 100 percent. The remote computer should then take your local desktop zoom settings.
- Multiple Monitors: If you have Multiple Monitors, each monitor must be configured to 100 percent zoom setting, Different zoom settings on separate monitors connected to the same NP designer computer will also cause NPrinting Designer reporting problems described above.
Solution Two
- You may need to update your DPI settings:
- See: Unable to edit Excel report with Windows 10 with error "NPrinting Designer can't find a supported template editor for the file"
- You must sign out of Windows then sign in again before attempting to open the NPrinting Designer again.
- You may need to Reboot your computer to fully apply/complete the changed settings if signing out then signing back into windows does not solve the issue.
Solution Three
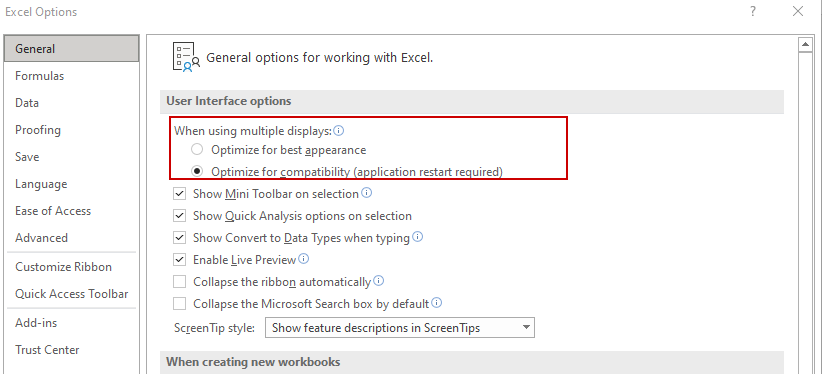
Update User Interface options in MS Office Settings:
- Open Office, i.e. Open blank Excel Workbook and do
- File -> General -> Options -> User Interface options
- If default is "Optimize for compatibility" switch to "Optimize for best appearance", close Excel, open an NP Excel report with NP designer via NPrinting Web Console (close NP designer before attempting bullet three below).
- If default is "Optimize for best appearance" switch to "Optimize for compatibility". close Excel, open an NP Excel report with NP designer via Nprinting Web Console (close NP designer before attempting bullet two above).
Solution Four
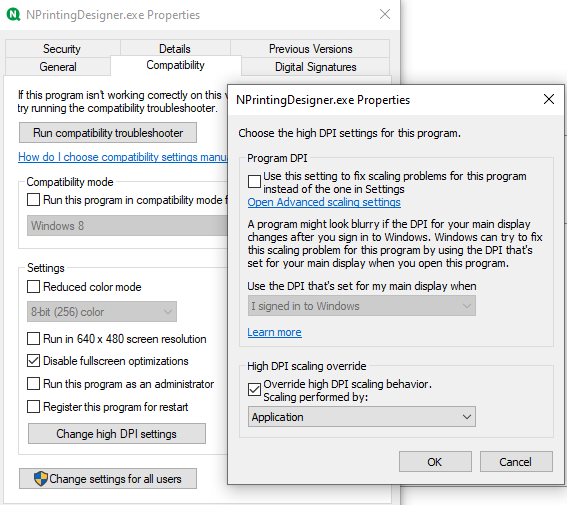
- Select the "Disable fullscreen optimizations" property
- By default, you will find the NPrintingDesigner.exe at "C:\Program Files (x86)\NPrinting\Designer"
Solution Five
In rare cases, some organization's will actually disable drag and drop capability through windows group policy. Please check with this following article and work with your internal Windows Group Policy team to re-enable this feature as needed https://community.qlik.com/t5/Knowledge-Base/NPrinting-Designer-Drag-and-Drop-Not-Working/ta-p/1717399
MS Office Update Causing Opening NPrinting Designer issues:
Qlik NPrinting can't find supported reporting temp... - Qlik Community - 1716228
- Tags:
- configuration
- designer
- nprinting
- Labels:
-
Configuration
-
Deployment
-
Visualization
Environment
- QlikView Server/Publisher April 2020 (12.50)
Description
When completing an edit of a Publisher task and clicking the Apply button, a pop up appears in the QlikView Management Console (QMC) stating Apply Following settings on User Docum
...Environment
- QlikView Server/Publisher April 2020 (12.50)
Description
When completing an edit of a Publisher task and clicking the Apply button, a pop up appears in the QlikView Management Console (QMC) stating Apply Following settings on User Document will be changed :, followed by the action taken in the task edit
This is expected behavior in QlikView April 2020 (12.50). For example, by editing a task and changing the Category and selecting to Preload the QVW the below pop-up message is displayed in the QMC
Related Content
The information in this article is provided as-is and to be used at own discretion. Depending on tool(s) used, customization(s), and/or other factors ongoing support on the solution below may not be provided by Qlik Support.
- Labels:
-
General Question
-
How To
Description
Compose installation screen not progressing while applying the Compose patch file.
Environment
- Qlik Compose for Data Warehouses
- Qlik Compose for Data Lakes
Resolution
- Open a command prompt as administrator.
- Run regedit (The screensh
Description
Compose installation screen not progressing while applying the Compose patch file.
Environment
- Qlik Compose for Data Warehouses
- Qlik Compose for Data Lakes
Resolution
- Open a command prompt as administrator.
- Run regedit (The screenshot of the output is listed below).
3. Remove the registry entry from the following folders for Qlik Compose for Data Warehouse or Qlik Compose for Data Lakes.
HKEY_CLASSES_ROOT\Installer\Products

HKEY_LOCAL_MACHINE\SOFTWARE\Microsoft\Windows\CurrentVersion\Uninstall

HKEY_LOCAL_MACHINE\SOFTWARE\Wow6432Node\Microsoft\Windows\CurrentVersion\Uninstall
Note: One must be very careful in identifying the registry before deleting it as this can cause a bigger problem if you delete the wrong files by mistake.
The below screenshot shows the registry entry from the HKEY_CLASSES_ROOT\Installer\Products folder. You’ll find a similar registry entry in the other folders mentioned above.
4. Restart the machine and retry your install again.
5. If it fails to install even after removing the registry entry, send the log of the compose installation for the support team to review.
Cause
This problem may occur if you have a corrupted register entry for Compose or canceled the installation in the middle of an extraction.
- Labels:
-
Configuration
If you are failing to load due to table locks being applied, you can add the following FILTER under the Table Settings -> Filter -> Record Selection Condition. The Table Locks can when there is allot of activity on the Table such as Updates/Inserts/D
...If you are failing to load due to table locks being applied, you can add the following FILTER under the Table Settings -> Filter -> Record Selection Condition. The Table Locks can when there is allot of activity on the Table such as Updates/Inserts/Deletes during the Load process.
You may encounter a message like:
UNSUCCESSFUL EXECUTION CAUSED BY DEADLOCK OR TIMEOUT error encountered while FETCH-ing data from table
Filter to add:
--FILTER: 1=1 ) FOR READ ONLY WITH UR USE CURRENTLY COMMITTED --
Environment
- Qlik Replicate > 6.5
The information in this article is provided as-is and to be used at own discretion. Depending on tool(s) used, customization(s), and/or other factors ongoing support on the solution below may not be provided by Qlik Support.
- Labels:
-
How To
During the CDC process one may encounter a error with an Oracle Redo Log. To validate the Redo Log is not corrupt one can use the below command to DUMP the Oracle Redo Log that failed to open in Replicate. To do this run the command:
SQL> alter systeDuring the CDC process one may encounter a error with an Oracle Redo Log. To validate the Redo Log is not corrupt one can use the below command to DUMP the Oracle Redo Log that failed to open in Replicate. To do this run the command:
SQL> alter system dump logfile '/home/oracle/thread_redo_log_name.1035541595' validate;Note: If there is an issue dumping the Redo Log it will show output as below and would require your Oracle DBA help as this shows problem with the file.
ERROR at line 1:
ORA-00368: checksum error in redo log block
ORA-00353: log corruption near block 1589280 change 5977386357125 time
03/20/2020 10:25:15
ORA-00334: archived log: '/home/oracle/thread_1_seq_264614.10301.1035541595'
Environment
- Qlik Replicate 6.6, 7.0
The information in this article is provided as-is and to be used at own discretion. Depending on tool(s) used, customization(s), and/or other factors ongoing support on the solution below may not be provided by Qlik Support.
- Labels:
-
How To
These are jobs you setup and defined in Replicate under the Server to have run certain times a day. The initial jobs were setup for testing and would like to clear these test jobs up and create a new set of Scheduled jobs from a blank list.
If you w
...These are jobs you setup and defined in Replicate under the Server to have run certain times a day. The initial jobs were setup for testing and would like to clear these test jobs up and create a new set of Scheduled jobs from a blank list.
If you want to delete the Scheduler jobs use the command underneath:
repctl -d "data folder" connect; deleteobject object_name=scheduler object_type=26
Environment
- Qlik Replicate 6.6, 7.0
The information in this article is provided as-is and to be used at own discretion. Depending on tool(s) used, customization(s), and/or other factors ongoing support on the solution below may not be provided by Qlik Support.
- Labels:
-
How To
Below is the list of defects resolved with Qlik Sense November 2020 Patch 5. For more information, please see the Release Notes.
Environment: Qlik Sense November 2020 Patch 5
Mashup objects error message text is not rendered from client.json sometim
Below is the list of defects resolved with Qlik Sense November 2020 Patch 5. For more information, please see the Release Notes.
Environment: Qlik Sense November 2020 Patch 5
Mashup objects error message text is not rendered from client.json sometimes in IE11
Jira issue ID: QB-3379
Description: Translator needs to be loaded to make sure we can translate the text. For mashups this is not always the case. When error is thrown we will now wait until the translator is started before we show the message on the screen
- Labels:
-
General Question
When installing Qlik Sense Enterprise on Windows server core you need additional components added to get the Engine Service to start. On a standard Server Core installation, an error will be displayed that the Engine Service could not start in a time
...When installing Qlik Sense Enterprise on Windows server core you need additional components added to get the Engine Service to start. On a standard Server Core installation, an error will be displayed that the Engine Service could not start in a timeline manner.
Environment
- All Qlik Sense Versions
- Windows Server Core 2016, 2019, 2022
Resolution
Qlik Sense will function without issues on a Windows Server Core install if the "Server Core App Compatibility Feature on Demand" is enabled.
To install this in the command line use:
Add-WindowsCapability -Online -Name ServerCore.AppCompatibility~~~~0.0.1.0
Cause
Qlik Sense needs external libraries which are not included in the Windows core standard image.
- Labels:
-
Deployment
When using the automations editor, you can import or export an automation by right-clicking inside the editor.
Exporting an automation (download)
Follow these steps to export an automation to a JSON file:
- Go to the automation editor
- Right-click i
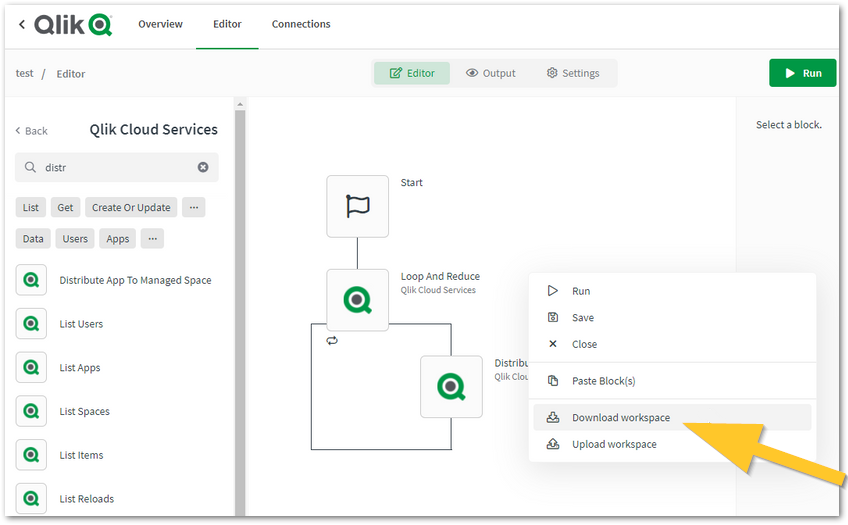
When using the automations editor, you can import or export an automation by right-clicking inside the editor.
Exporting an automation (download)
Follow these steps to export an automation to a JSON file:
- Go to the automation editor
- Right-click in the blank canvas
- Click Download workspace
Importing an automation (upload)
Follow these steps to import an automation from a JSON file:
- Go to the automation editor
- Right-click in the blank canvas
- Click Upload workspace
- Select a JSON file containing an automation from the wizard that appears
Note:
- Importing automations from a JSON file should only be done with files exported from the automations editor.
- Automations cannot be shared or added to shared or managed spaces. You may export as per above to share the automation with other users.
The information in this article is provided as-is and to be used at own discretion. Depending on tool(s) used, customization(s), and/or other factors ongoing support on the solution below may not be provided by Qlik Support.
- Tags:
- blendr.io
- Labels:
-
How To
-
Workflow and Automation
After the Qlik GeoAnalytics installation, an activation of the product is required. During the use of the Qlik GeoAnalytics License Activation Tool you might see the error message:
Could not communicate with the license server. Check your internet co
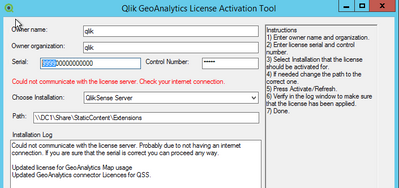
...After the Qlik GeoAnalytics installation, an activation of the product is required. During the use of the Qlik GeoAnalytics License Activation Tool you might see the error message:
Could not communicate with the license server. Check your internet connection.
Environment
- GeoAnalytics all versions prior November 2020
Resolution
The best way to resolve the issue is to install a version post November 2020. Until the upgrade here is a workaround:
Create a file called GeoAnalyticsLicenseTool.exe.config in the same folder as the license tool executable, C:\Program Files (x86)\QlikView\GeoAnalyticsLicenseTool .
Paste this inside:
<?xml version="1.0" encoding="utf-8"?>

 <configuration>
    <runtime>
        <AppContextSwitchOverrides value="Switch.System.Net.DontEnableSystemDefaultTlsVersions=false"/>
     </runtime>
 </configuration>
Cause
The LEF license servers have been moved to another location and are now using TLS 1.2 as a default.
- Labels:
-
Deployment
-
License
The Qlik Sense ODAG API is returning error 500 when the Expect: 100-continue header is used
Environments:
Qlik Sense Enterprise on Windows June 2019 and later
Resolution
Some clients, such as the .NET framework and cURL send the Expect:100-continu
...The Qlik Sense ODAG API is returning error 500 when the Expect: 100-continue header is used
Environments:
Qlik Sense Enterprise on Windows June 2019 and later
Resolution
Some clients, such as the .NET framework and cURL send the Expect:100-continue by default.
The Qlik Sense ODAG API does not support this header and the API call will fail with an error 500 Internal server error when this header is used.
The header should be removed from the request for it to work.
- Tags:
- integration
- Labels:
-
Integration and Embedding


