Unlock a world of possibilities! Login now and discover the exclusive benefits awaiting you.
- Qlik Community
- :
- Forums
- :
- Archive
- :
- Archived Groups
- :
- Boxplots and Set Analysis
- Subscribe to RSS Feed
- Mark Topic as New
- Mark Topic as Read
- Float this Topic for Current User
- Bookmark
- Subscribe
- Mute
- Printer Friendly Page
- Mark as New
- Bookmark
- Subscribe
- Mute
- Subscribe to RSS Feed
- Permalink
- Report Inappropriate Content
Boxplots and Set Analysis
Hi community,
I've found something strange in boxplots in the Qlik Sense June 2017 release: it seems it has some problem with set analysis.
I've post this problem in a classical question on the community:
and with stalwar1 (thanks) we decided that could be something deeper than a mistake with my set analysis.
Here the full text of the post mentioned, hoping to be helpful and helped. Attached an useful app to undersand the problem.
START POST
Hi community,
I'm working woth the June 2017 release of Qlik Sense Desktop, and I'm fighting with boxplots. I want boxplot for workers and their sales, and a boxplot independent by selection of the single worker.
The first boxplot is quite easy.
dimension: worker
measure: Sum(sale)
Then I would like a boxplot independent by the selections of the worker, to compare the worker's behaviour with an overall behaviour.
dimension: worker
measure: Sum({$<[worker]=>}sale)
The problem is there: set does not works properly (maybe my mistake).
Attached an app with the example, and also a pie chart that is independent from worker selection.
I'm frankly doubtful, because for example R does not need a dimension for a boxplot, here a simple example (different data, but you can easily understand) with the result:
boxplot(x<-c(1,2,4,2,5,7,2))
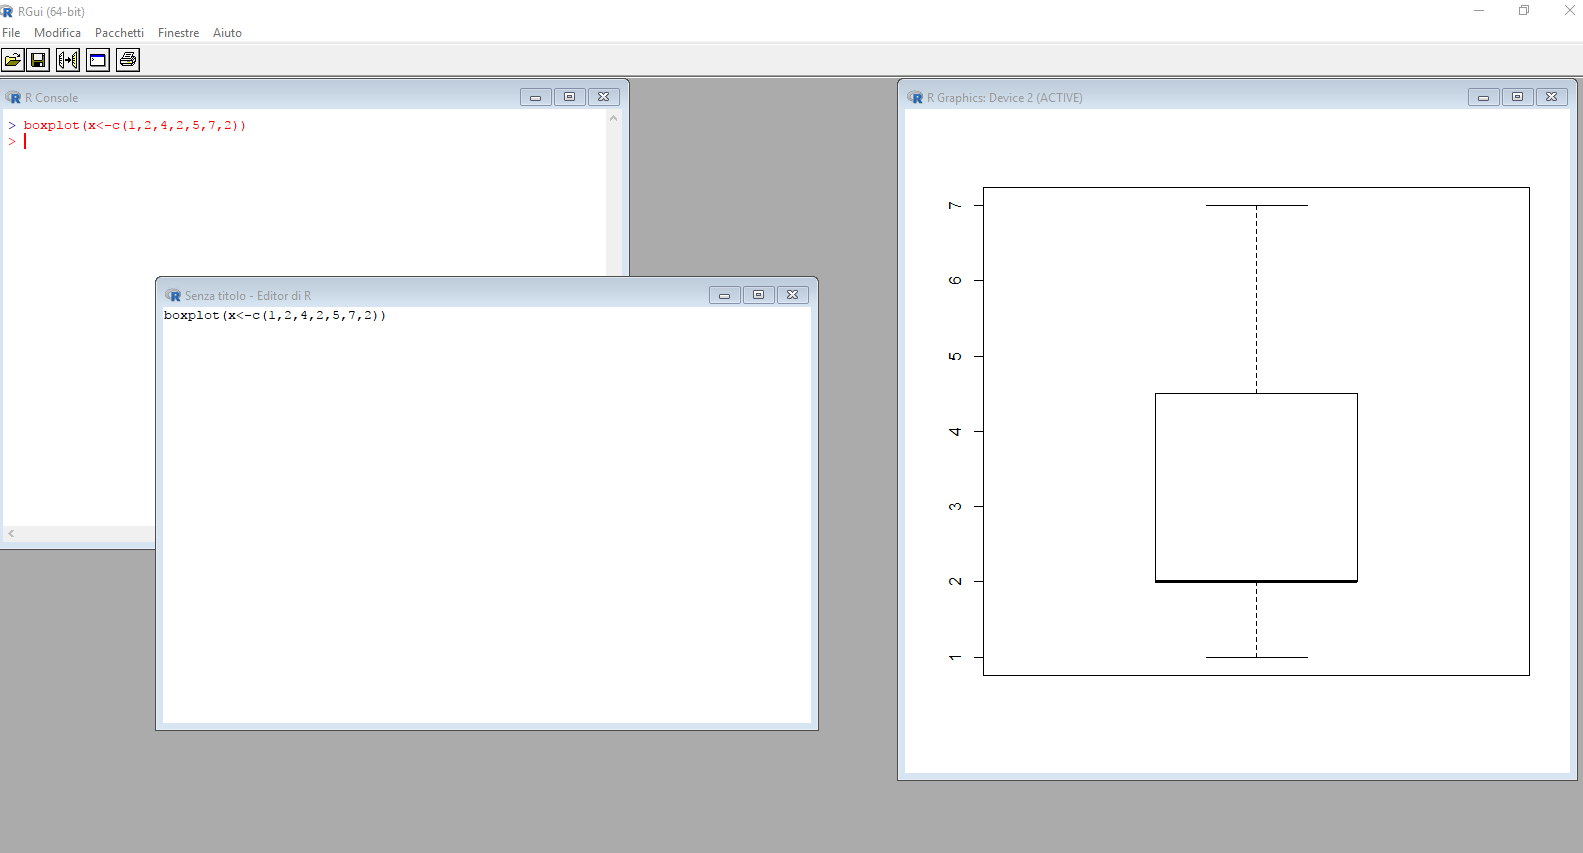
But Qlik yes, and maybe this is the key.
However, my question is: can I have a boxplot independent by selections? If so, also independent by its dimension? And how?
Thanks in advance
EDIT:
It seems there is a bug in Qlik, could you help me?
Dirk Scharffetter, Jeffrey Goldberg, Mattias Malre Michael Tarallo
END POST