Unlock a world of possibilities! Login now and discover the exclusive benefits awaiting you.
Product Innovation
By reading the Product Innovation blog, you will learn about what's new across all of the products in our growing Qlik product portfolio.
Support Updates
The Support Updates blog delivers important and useful Qlik Support information about end-of-product support, new service releases, and general support topics.
Qlik Academic Program
This blog was created for professors and students using Qlik within academia.
Community News
Hear it from your Community Managers! The Community News blog provides updates about the Qlik Community Platform and other news and important announcements.
Qlik Digest
The Qlik Digest is your essential monthly low-down of the need-to-know product updates, events, and resources from Qlik.
Qlik Learning
The Qlik Learning blog offers information about the latest updates to our courses and programs, as well as insights from the Qlik Learning team.
Recent Blog Posts
-
Actionable Metadata – with QlikView Expressor
Actionable DataIt should come as no surprise that in order for raw data to break free from its deluge and become truly actionable - it must go through a number of steps before it is finally ready for decision makers. Steps can include various methods that access, combine and transform the data to make it meaningful for Business Discovery. Traditionally, methods that make data actionable can include a combination of data integration applications (... Show MoreActionable Data

It should come as no surprise that in order for raw data to break free from its deluge and become truly actionable - it must go through a number of steps before it is finally ready for decision makers. Steps can include various methods that access, combine and transform the data to make it meaningful for Business Discovery. Traditionally, methods that make data actionable can include a combination of data integration applications (ETL) and/or QlikView data-readiness procedures (QlikView Script). These methods in turn prime QlikView’s powerful associative in memory data layer used by all QlikView deployments. QlikView and knowledge workers are then responsible to turn that actionable data into useful information to help drive decisions.
Metadata in Action
With the introduction of QlikView Expressor, data provisioning for QlikView deployments has been redefined. Whether you are simply accessing data from a warehouse or combining data from disparate sources, QlikView Expressor will provide both actionable data along with actionable metadata as you develop. This makes managing data for QlikView more efficient, less prescriptive and will ensure a higher degree of data confidence and reuse across all QlikView applications.
Metadata is typically defined as data about data. Active metadata on the other hand, can be defined as "metadata in action". Traditional Business Intelligence metadata is mostly static and limited to only describing a few properties about the data it references - such as sources, data types, column names, length and format. QlikView Expressor metadata is not static, it’s active. It describes common properties about the data while also actively respecting rules that have been defined on its attributes.
Let’s take a simple example using a string column named ZIP used to store a 5 digit +4 zip code. Not only can the metadata describe the attribute using a common business term such as PostalCode, but it can also specify a minimum and maximum string length constraint to ensure the data length only falls within the specified range. Furthermore, it can provide a pattern match rule using a regular expression such as ^\d{5}-\d{4}$. This will ensure that the data flowing to QlikView will absolutely match the XXXXX-XXXX pattern. - What if the data fails the rules? A choice to set a corrective action to use a default value or even redirect the record to be captured is available, allowing more control on where and how the data is processed. Other examples can include using an allowable list of values, setting rounding / min / max / precision / scale / constraints on numeric values, date range validation, date formatting and string padding / truncation.
Using active metadata with QlikView Expressor is just one part of the overall QlikView Expressor solution. Combined with other key capabilities, you will discover how QlikView Expressor can help simplify your QlikView application development and create a reusable environment that reduces development time and speeds up your deployment efforts. Come back to this blog often as I will be covering these capabilities and much more in future articles.
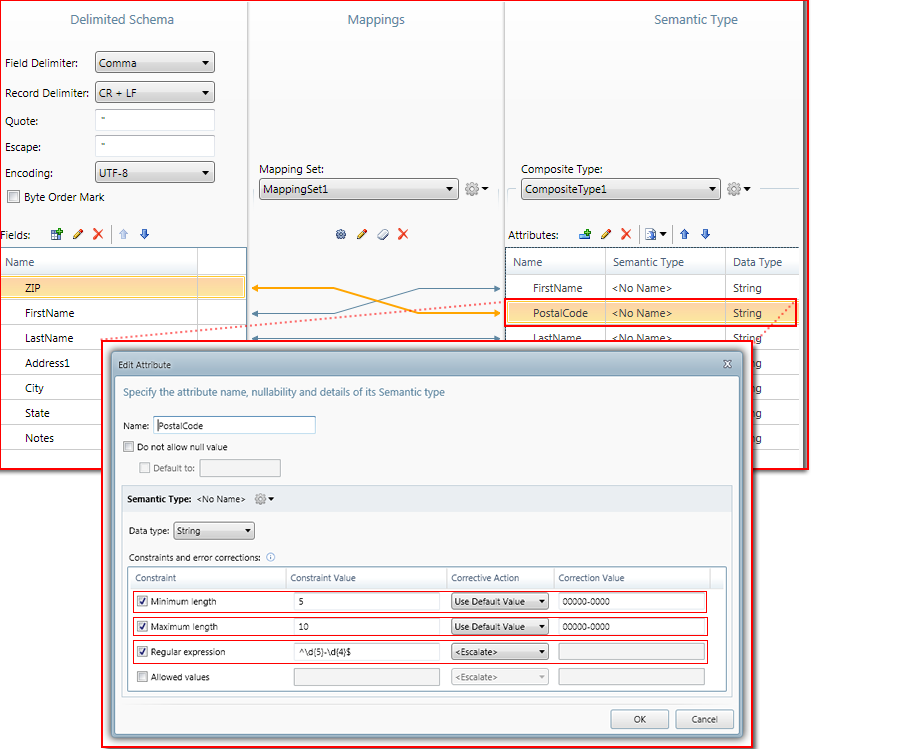
Figure 1: Managing Active Metadata with QlikView Expressor
Mike Tarallo
Senior Product Marketing Manager
QlikView Expressor
-
A Historical Odyssey: QlikView 3
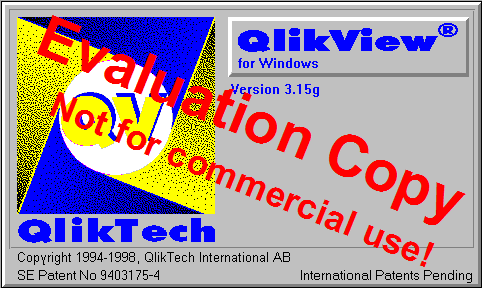
Oh, glorious were the days! Businesswise we were perhaps not yet so successful, but product maturity made giant leaps forward. QlikView 3 was a very good product packed with new features that made life easier. Both developers and users loved it. It was easier for prospects to evaluate it and it was easier for us to sell than previous versions. QlikView 3 was released in the spring of 1997, in time for the yearly IT exhibition CeBIT in Hannover.... Show MoreOh, glorious were the days! Businesswise we were perhaps not yet so successful, but product maturity made giant leaps forward. QlikView 3 was a very good product packed with new features that made life easier. Both developers and users loved it. It was easier for prospects to evaluate it and it was easier for us to sell than previous versions.
QlikView 3 was released in the spring of 1997, in time for the yearly IT exhibition CeBIT in Hannover. In version 1 and 2 we had focused on the UI (user interface) – on presenting data in such a way that a user could explore it and learn from it. For QlikView 3, we had changed focus slightly. We now worked more on simplifying the data loading process and the development of the document. We also made it easier for people to try out the product by introducing a 15-day evaluation license. As a result, more and more people started developing applications with QlikView. And it became much easier to convince prospects and partners to join us on our journey.
One major change in QlikView 3 was the Automatic Outer Join. Already in QlikView 1 and 2, you could have a data model with several tables. But the associations between the tables were like inner joins and no analysis was possible for values that lacked corresponding records in a neighboring table. For instance, customers that had no orders in the Orders table were always grayed out. But with QlikView 3 it became possible to select such customers. This is a feature that we today take for granted, but it was not there in the beginning.
Another change in QlikView 3 was that the scripting language developed immensely. We introduced a number of new script constructs. Join, Concatenate, Crosstable, Intervalmatch, resident load, preceding load, Group by, Peek, Previous, and Variables the way we know them today, all arrived in QlikView 3 – as did the text file wizard and the possibility to load files over the internet. You could now make fairly complex data transformations right in the QlikView script.
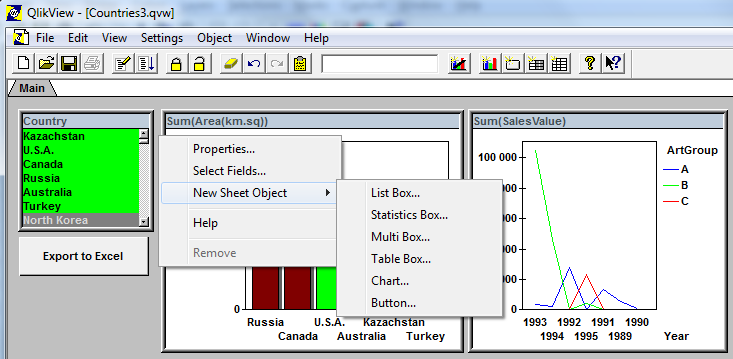
We also introduced several new sheet objects in QlikView 3 (line chart, scatter chart, multi box, straight table and table box) as well as new property dialogs – one for user preferences, one for the sheet, and one for the document itself. And you could right-click on the sheet and get a float menu. It became a whole lot easier to navigate around all the product settings.
On top of all this, we released French and German language versions of QlikView, as well as a Macintosh edition. Yes, we had a Mac version of QlikView! However, we didn’t sell much of it and since it meant a lot of extra work for R&D, both in terms of development and test, we discontinued it one release later.
And – most importantly of all – QlikView 3 was extremely stable.
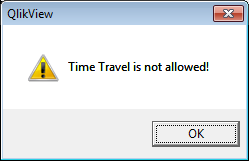
As a curiosity, QlikView 3 also had one of the best error messages ever: “Time Travel is not allowed!” Anyone can figure out when this was used?
Further reading on the Qlik history:

-
Why it is ok to scroll
A popular topic in interactive design is that of scrolling. When is it ok to scroll? Is it ok to scroll? Will people know they can scroll? What information should be above the fold?Above the foldWhen web design began the designers were mostly trained print designers since interactive design was a new field and "web" designers didn't exist. The concept of "the fold" is one that print designers imported from newspaper design. The goal of designing ... Show MoreA popular topic in interactive design is that of scrolling. When is it ok to scroll? Is it ok to scroll? Will people know they can scroll? What information should be above the fold?
Above the fold
When web design began the designers were mostly trained print designers since interactive design was a new field and "web" designers didn't exist. The concept of "the fold" is one that print designers imported from newspaper design. The goal of designing "above the fold" was to keep the most important headlines and images in the top half of the newspaper so when it was folded in half at the newsstand the most enticing information would be visible and passers-by would stop and buy the paper.
With the internet the concept of designing web pages with the important information above the fold, keeping key information viewable without scrolling vertically, was met with a new challenge: monitor variety. When a publisher produces a newspaper every customer gets the same sized paper. The content that is above the fold for one reader is the same for every reader. With web design the variety of monitors, browser chromes, and resolutions is so diverse that there is no standard height for where the fold begins. The fold on my phone is alot different than the fold on my 27inch desktop monitor. The ipad has not one but two folds: one in portrait orientation but a shorter fold in landscape orientation.
Ignore the fold
People's fear is that important information will never be found if it is below the fold. That somehow people (not themselves of course) don't know how or when to scroll to find additional information so the solution must be to cram as much content at the top of a page as possible. This is ridiculous. Usability tests continue to prove that not only do users scroll but scrolling can actually improve the user experience. If people feel they are on the right track they will continue to scroll for content.
Advice:
- Design pages that are legible and attractive. If your application is well designed it encourages people to explore the document and they will scroll on their own.
- Vertical scrolling only. While users can scroll vertically as well as horizontally, generally speaking a page should do one or the other and people prefer vertical scrolling. Vertical scrolling is a more standard method of navigating content as well as the simple fact that most scroll wheels move vertically and not horizontally. Vertical scrolling is just easier.
- Monitor Resolution. To avoid horizontal scrolling you should know your intended audience. I use analytical data to find the largest number of users with the lowest common resolution and design for that. 1024x768 is still a decent standard size as well as being the resolution of the ipad in landscape orientation.

-
Ready, Set, Go with QlikView SAP Netweaver® Connector
Since we introduced the first version of the QlikView SAP connector 6 years ago, many of the QlikView customers leveraged the power of QlikView with the SAP data. Through QlikView’s unique, in-memory associative technology, they are able to make SAP based business decisions with the speed of the business.The key enabler of the solution is the certified QlikView SAP Netweaver® Connector, which can extract data from SAP® R/3®, mySAP™, SAP BW, and B... Show MoreSince we introduced the first version of the QlikView SAP connector 6 years ago, many of the QlikView customers leveraged the power of QlikView with the SAP data. Through QlikView’s unique, in-memory associative technology, they are able to make SAP based business decisions with the speed of the business.
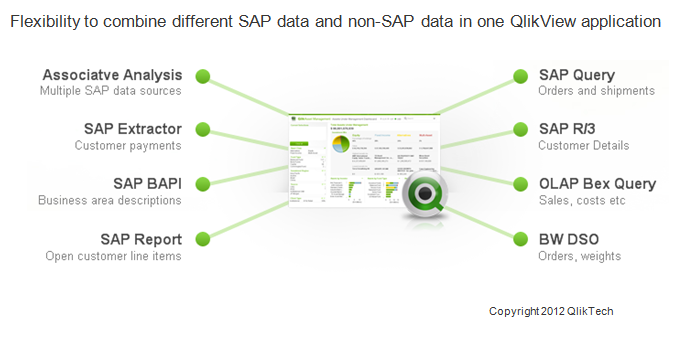
The key enabler of the solution is the certified QlikView SAP Netweaver® Connector, which can extract data from SAP® R/3®, mySAP™, SAP BW, and BEX queries into QlikView. The extracted data can be combined with non-SAP data in one QlikView application providing a 360 degree view of the business.
Let’s take a look at a business case and understand how the QlikView SAP Netweaver® Connector would help. Assume a company has various SAP Netweaver data stores and its users would like to do sales analysis across their business. With SAP Netweaver® Connector they can connect and extract data from;
- SAP BW/BI Business Explorer Query for sales information
- SAP Data Store Object (DSO) for additional order values and shipping weights
- An SAP Query to gain insight into sales organization detail metrics
- An SAP R/3 Table so they can integrate the company details into Google maps
- An SAP Extractor for customer items
- An SAP BAPI for business area lookups
- An SAP Report for customer payments
They can then create visual and flexible analysis with this data in one single QlikView application which can also integrate data from external non-SAP data sources.
QlikView provides pre-packaged QlikStart templates for SAP R/3 as well as QlikView SAP data dictionary and QlikView script builder applications. These apps would give a good head start for IT by delivering the background database information of how tables within SAP interact. It would also enable the business users to quickly realize their own data in ways they may not have envisioned before.
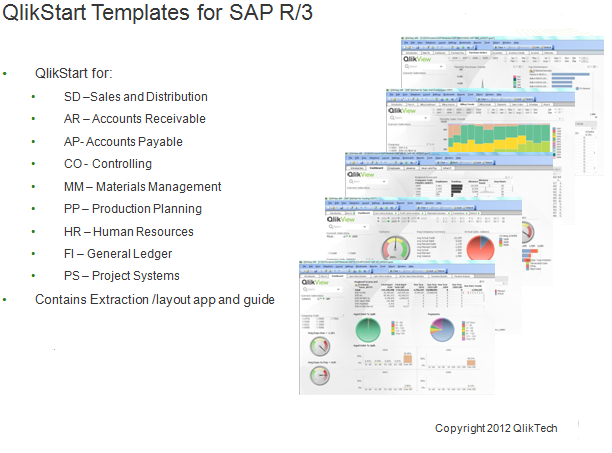
Last month we introduced a new version of the QlikView SAP Netweaver® Connector (SAP Netweaver version 5.7) with even more capabilities. If you would like to have a jump start to do Business Discovery with your SAP data, you can download the QlikStart templates from QlikCommunity.

-
Colour
Are you colourblind? Do you actually know if you’re colourblind? On the 3 occasions I have presented on this topic I have had a two male attendees admit to not knowing….. (until now...) that they were colourblind to some degree.It is estimated that approximately 8% of men and 0.5% of women are colourblind. This large difference in probability is due to the fact that the genes that produce photopigments are carried on the X chromosome; if some of... Show MoreAre you colourblind? Do you actually know if you’re colourblind? On the 3 occasions I have presented on this topic I have had a two male attendees admit to not knowing….. (until now...) that they were colourblind to some degree.
It is estimated that approximately 8% of men and 0.5% of women are colourblind. This large difference in probability is due to the fact that the genes that produce photopigments are carried on the X chromosome; if some of these genes are missing or damaged, color blindness will be expressed in males with a higher probability than in females because males only have one X chromosome, whereas women have two!
(http://en.wikipedia.org/wiki/Color_blindness)The most common way to determine level of colourblindness is to take an Ishihara test. The test consists of a number of plates that contain patterns of different coloured/shaded dots. These dots form to show numbers and shapes that you can…. or in the case of colour blind people…. can’t see.
Can you see a number in this plate…… I can’t…. I am actually colourblind, which is quite ironic considering I work with QlikView visualisations every day. A person with “normal” vision should see the number 6, colourblind people will see nothing.
You can take the tests online on a number of websites :
http://www.tedmontgomery.com/the_eye/colortst/colortst.html
http://colorvisiontesting.com/ishihara.htm
http://www.colour-blindness.com/colour-blindness-tests/ishihara-colour-test-plates/
One great example I found is the image below. I cannot see any difference between the two images due to me being Red-Green colourblind. People in the office who have perfect vision could see a massive difference in the colours.…
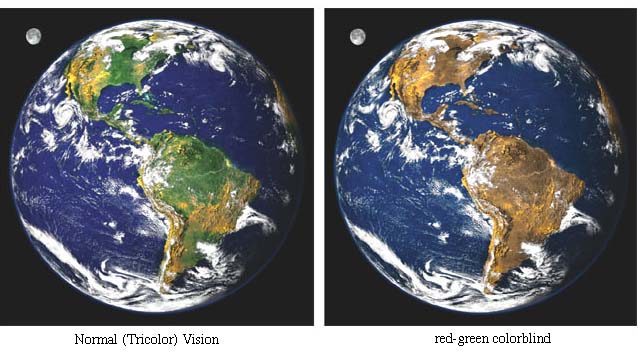
(Source: http://facweb.cs.depaul.edu/sgrais/colorvisiondefi.htm)
I often find that colour and the use of colour is something that is decided upon without much thought, hence me writing this. We have to be very careful when we decide on the colours we use in our charts and dashboards. In your QlikView objects, really think carefully about colours and the impact your choices will have on your users. Ensure you use colour blind friendly palettes, and avoid using colours that are “close” together in tone, next to each other in charts such as scatter and bar charts.
There are a number of resources on the web to help you choose friendly colour palettes..
http://jiminy.medialab.sciences-po.fr/tools/palettes/
So, choose your colours wisely, try not to use colours that are “close” together. Utilise the web resources to help determine your palette. If, like me, you are colour blind then these resources are a massive help!
Remember the number…. 8% of males are colourblind…this is a big number. This 8% could be the key decision makes or indeed the developers.
Wherever possible, colour should purvey meaning, not just used because it looks nice!
See more about this topic in this techincal brief Colour
ABY
-
An Inside Look at Building QlikView Extensions
Have you ever wondered what it takes to create QlikView extensions? Here’s someone who knows: Brian Munz, QlikView extensions “imagineer,” as I think of him. His official title is web technology lead on the demo and best practices team. Brian was the lead developer for the current version of demo.qlik.com and the version of AccessPoint that ships with QlikView Server in QlikView 11.Since QlikView 10 (released October, 2010) QlikView has enabled c... Show MoreHave you ever wondered what it takes to create QlikView extensions? Here’s someone who knows: Brian Munz, QlikView extensions “imagineer,” as I think of him. His official title is web technology lead on the demo and best practices team. Brian was the lead developer for the current version of demo.qlik.com and the version of AccessPoint that ships with QlikView Server in QlikView 11.
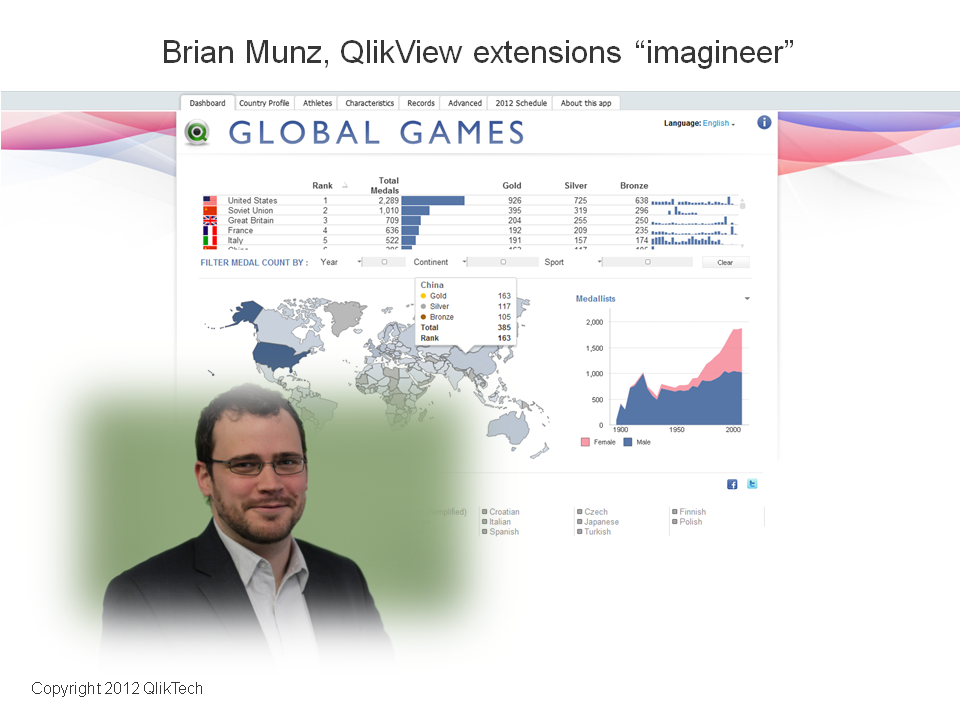
Since QlikView 10 (released October, 2010) QlikView has enabled customers and partners to create extensions; web developers can bring custom and third-party data functionality or visualizations into QlikView, where they become fully interactive just like native capabilities. “Some of the cooler extensions I’ve seen,” said Brian, “are very powerful in terms of utility. It’s not solely about custom visualizations. You can use extensions to connect on the back end to other products (like Google Analytics) or add a Twitter feed or button, or detect browsers and devices . . . those kinds of things.” Brian has built mapping extensions, which plot regions on map (colors and shades them) based on data points, using Google Maps and open source mapping tools. He also created a geolocation extension, which enables the app to find the user’s current location (check it out here).
I asked Brian what it takes to build QlikView extensions and here’s the way he put it: “A lot of work is around answering the question, ‘What am I trying to show?’ Once you figure that out, it’s about connecting to the data. Web developers often deal with SQL and MySQL — with databases with rows and columns. With a QlikView extension, the data comes into the extension the same way. Once you get the syntax right for pulling the data out of the source system, you say, ‘Oh, I know how to do this. I've done it a million times before.’ You then have to decide how the extension should communicate back to QlikView. A web developer who has worked with Ajax or JavaScript APIs can learn to do this without too much headache.”
To create extensions, you need some level of JavaScript coding proficiency. To create a fairly simple extension, you could search for code snippets and paste them together. If you want to do something more complicated, you need heavy-duty JavaScript coding skills. It also helps to have a general level of comfort with other Web technologies like CSS and HTML.
How long it takes to build a typical extension object? “There really isn't ‘typical,’” Brian said. “It depends what the extension object is. If it's enormously complicated it could take months. If it’s simple, like a marquee that scrolls across the top of the screen, showing KPIs, that could be done in an hour. Creating an extension that’s a map that has different regions of the country showing up in different colors takes longer, compared to just integrating with an existing JavaScript library.” Building QlikView extensions can take as little or long as any web project.
“The beauty of it,” Brian said, “is in the combination. Web technology is extremely powerful, and so is QlikView. Having them work together seamlessly increases the total full power of QlikView.”
-
Let the User Select
QlikView is about empowering the user. Allowing a user to freely choose what to look at and how to look at it is one of the cornerstones of Business Discovery. Another is about simplicity – which often translates into removing unnecessary technical obstacles so that the user can focus on the data and the information that lies hidden in it. This often leads to a situation where you have two different user roles: an application developer and a busi... Show MoreQlikView is about empowering the user. Allowing a user to freely choose what to look at and how to look at it is one of the cornerstones of Business Discovery. Another is about simplicity – which often translates into removing unnecessary technical obstacles so that the user can focus on the data and the information that lies hidden in it. This often leads to a situation where you have two different user roles: an application developer and a business user, where the application developer takes care of the data modeling aspects of the analysis and the user interacts with the data, asks questions and finds new areas of exploration.
In such a situation it is important that the developer treads carefully – he or she must remove technical obstacles without limiting the user. However, in an effort to simplify, application developers sometimes complicate things without realizing it. Let me give you a couple of examples.

Macros and Actions are features that unfortunately sometimes are used to “help” the user make the right selection. I have often seen developers create buttons that make selections and activate other sheets, or triggers that clear selections and make new selections when you leave a sheet. Such constructs are confusing for the user, who doesn’t understand why these new selections happen. Macros and Actions often obscure the QlikView logic and prevent the user from learning how to interact with data on their own.
Another area where the power to select can be taken away from the user is when Set Analysis is used. In set analysis, the developer can define a formula with an arbitrary selection that overrides the one made by the user. Often the new selection is based on the user selection. Set analysis is necessary for calculations that extend outside the user-made selection, e.g., if the user wants to make a year-to-date calculation for the time up to the selected month. Properly used, it is an extremely powerful tool that enhances the user's ability to find information in data. But I have seen cases where set analysis instead replaced the user's selection and limited the his ability to interact with data. To hard code the selection inside a formula is in some cases disrespecting the user’s intelligence!
My view is that navigation – choosing a sheet, activating sheet objects, expanding branches in pivot tables, and, most importantly, making selections – should be left to the user. Constructions that “help” the user in this area usually have the opposite effect. Instead of helping the user, they often complicate the interaction with data and confuse the user.
I am convinced that macros, actions and set analysis sometimes must be used, but these features should be used with caution. They should never be used for things that the user can do better. We live in an age of empowerment, and users want to be free to explore data in their own way and on their own.
QlikView should allow them to do just that.
