Unlock a world of possibilities! Login now and discover the exclusive benefits awaiting you.
This space offers a variety of blogs, all written by Qlik employees. Product and non product related.
Product Innovation
By reading the Product Innovation blog, you will learn about what's new across all of the products in our growing Qlik product portfolio.
Support Updates
The Support Updates blog delivers important and useful Qlik Support information about end-of-product support, new service releases, and general support topics.
Qlik Academic Program
This blog was created for professors and students using Qlik within academia.
Community News
Hear it from your Community Managers! The Community News blog provides updates about the Qlik Community Platform and other news and important announcements.
Qlik Digest
The Qlik Digest is your essential monthly low-down of the need-to-know product updates, events, and resources from Qlik.
Qlik Education
The Qlik Education blog provides information about the latest updates of our courses and programs with the Qlik Education team.
Recent Blog Posts
-
分析チームを強化する:Qlik AutoML の新たな進化
本ブログは Empowering Analytics Teams: Qlik AutoML's Next Evolution の翻訳です。 今日のデータ主導のビジネス環境では、トレンドを予測し、促進要因を説明し、洞察に基づいて行動する能力は、もはや贅沢品ではなく、必要不可欠なものとなっています。しかし、多くの組織にとって、データから予測インテリジェンスへの道のりは依然として困難です。データサイエンスのリソースは乏しく、従来のツールは多くの場合、分析チームに不足している専門的な知識を必要とします。 Qlik は、予測分析の力はすべての人が利用できるようになるべきだと考えています。Qlik AutoML は、分析チームやビジネスアナリストが、データサイエンスの博士号を取得することなく、機械学習の可能性を最大限に活用できるように設計されています。 ギャップを埋める:過去の分析から未来の洞察へ あまりにも長い間、ビジネスは過去に囚われ、過去のレポーティングと事後的な意思決定に制限されてきまし... Show More本ブログは Empowering Analytics Teams: Qlik AutoML's Next Evolution の翻訳です。
今日のデータ主導のビジネス環境では、トレンドを予測し、促進要因を説明し、洞察に基づいて行動する能力は、もはや贅沢品ではなく、必要不可欠なものとなっています。しかし、多くの組織にとって、データから予測インテリジェンスへの道のりは依然として困難です。データサイエンスのリソースは乏しく、従来のツールは多くの場合、分析チームに不足している専門的な知識を必要とします。
Qlik は、予測分析の力はすべての人が利用できるようになるべきだと考えています。Qlik AutoML は、分析チームやビジネスアナリストが、データサイエンスの博士号を取得することなく、機械学習の可能性を最大限に活用できるように設計されています。
ギャップを埋める:過去の分析から未来の洞察へ
あまりにも長い間、ビジネスは過去に囚われ、過去のレポーティングと事後的な意思決定に制限されてきました。Qlik AutoML はそのパラダイムを変えます。Qlik の最新リリースでは、分析チームに以下を可能にする画期的な機能をご提供します。
- 主要なビジネス成果を確実に予測
- 予測の背後にある要因を説明
- 洞察に基づいて行動し、測定可能で再現性のあるビジネスインパクトを促進
どのようにこれらが可能になるかご紹介しましょう。
インテリジェントなモデル最適化: 自動化と専門知識の融合
Qlik AutoML エンジンは、データを自動的に分析し、最適なモデルを繰り返し生成します。つまり、AutoML が正確な予測モデルを構築する複雑なタスクを処理する間、チームは適切な質問に集中することができます。
主な機能強化
- 日付およびフリーテキストデータの自動特徴量エンジニアリング
- 高度な特徴相関分析
- モデルの妥当性を保証するターゲット漏れチェック
- 洗練された特徴重要度計算
- 外れ値および不均衡なターゲットをインテリジェントに処理
これらの改善により、ビジネスデータのニュアンスを捉える、より高速で正確なモデルが実現します。
組み込みアナリティクス:洞察をワンクリックで
AutoML が生成したダッシュボードは、Qlik Sense のワークフローに直接統合されました。これで、チームは簡単に以下のことができるようになります:
- 異なるモデルを比較して最適なモデルを選択
- モデルの予測と SHAP インサイトを分析し、主要なドライバーを理解
- 結果を関係者にわかりやすく伝えられるようにビジネス文脈に合わせた視覚化
この緊密な統合により、最も必要な場所・タイミングで予測的洞察を得ることができます。
MLOps とガバナンスの強化: 自信を持ってスケールする
予測分析が業務の中心になるにつれ、ML(機械学習)プロセスを運用し、管理する能力が非常に重要になります。当社の強化された MLOps 機能は、ML の洞察を反復可能でスケーラブルなビジネスプロセスに変えるための強固なフレームワークを提供します。
- きめ細かなアクセス制御ロールによる適切なデータとモデルの管理
- データセットの変更とリフレッシュのための合理化されたプロセス
- モデル展開のための強固な承認ワークフロー
- 機能ドリフトとモデルパフォーマンスの高度なモニタリング
- 長期間にわたって精度を維持するためのシームレスなモデルの再トレーニング
- 予測をビジネスワークフローに統合する自動化されたパイプライン
- 完全な透明性とコンプライアンスのためのバージョン管理と監査証跡
これらの機能により、管理と透明性を維持しながら、組織全体で予測分析の取り組みを拡大することができます。
なぜこれが重要なのか:データを行動に変える
これらの機能強化は、単なる技術的な話ではありません。Qlik AutoML により、分析チームは以下のことが可能になります。
- 過去事象の分析から、プロアクティブなデータドリブン戦略への移行
- 部門間で予測的洞察を共有し、通常データサイエンスチームが注目しない「その他の90%」のユースケースに対応
- 明確な説明とガバナンスにより、AI 主導の意思決定に対する信頼を構築
- AI イニシアチブの Time-to-Value を数ヶ月から数日に短縮
- 予測分析を既存の Qlik ワークフローにシームレスに統合
Qlik の違い: 分析チームを想定した設計
多くの AutoML ソリューションがデータサイエンティスト向けに作られているのに対し、Qlik AutoML は分析チームやビジネスアナリスト向けに作られています。Qlik は、お客様のチームの既存のスキルやビジネス知識を活用できるよう、直感的でコード不要のエクスペリエンスを実現することに注力しました。
Qlik のユニークなアプローチ
- 包括的なデータ探索のための Qlik の連想エンジンのパワー
- シームレスなワークフローのための Qlik Cloud 内でのエンドツーエンドの統合
- 信頼構築と導入促進のための説明可能性の重視
- 長期的な成功とスケーラビリティを保証する堅牢な MLOps 機能
予測、説明、行動の準備はできていますか?
ビジネスアナリティクスの未来はここにあり、それは予測です。Qlik AutoML があれば、チームは何が起こったかを理解するだけでなく、何が起こるかを予測し、決定的な行動を起こすことができます。
すべての分析チームが予測 AI のパワーを活用できる未来を一緒に作りましょう。洞察はあなたに発見されるのを待っています。
-
The Evolution of Qlik AutoML – Empowering Analytics Teams with Advanced Machine ...
Your passion for data-driven insights has always been our driving force. Since we introduced Qlik AutoML as a key component of our AI-driven analytics strategy, your feedback and innovative use cases have shaped its evolution. Today, we're thrilled to unveil the next generation of Qlik AutoML, packed with features you've been asking for. You told us you wanted to harness the power of machine learning without deep data science expertise, and we l... Show MoreYour passion for data-driven insights has always been our driving force. Since we introduced Qlik AutoML as a key component of our AI-driven analytics strategy, your feedback and innovative use cases have shaped its evolution. Today, we're thrilled to unveil the next generation of Qlik AutoML, packed with features you've been asking for.
You told us you wanted to harness the power of machine learning without deep data science expertise, and we listened. This release is a testament to our ongoing collaboration, bringing cutting-edge capabilities directly to your fingertips.
Let's dive into the new capabilities that you'll soon be exploring:
- Intelligent Model Optimization: Remember those challenges with feature engineering and handling imbalanced datasets? AutoML now automatically tackles these for you. Here's what you can expect:
- Advanced feature engineering for dates and text
- Comprehensive correlation analysis
- Automated target leakage checks
- Intelligent handling of outliers and imbalanced data
The result? Faster, better models that capture the nuances of your unique business data.
- Embedded Analytics: You asked for tighter integration with Qlik Sense, and we delivered. Now you can:
- Compare models side-by-side directly in Qlik Sense
- Analyze predictions using SHAP (SHapley Additive exPlanations) values
- Visualize results in the context of your existing dashboards
This tight integration ensures that predictive insights are readily available in your existing analytics workflows.
- Enhanced MLOps: As many of you have scaled your predictive analytics efforts, you've stressed the need for robust MLOps features. We heard you, and now you have:
- A fully serverless lifecycle for training, deployment, and monitoring
- Granular access controls
- Automated retraining to maintain model reliability
These enhancements align with Qlik's comprehensive AI strategy, focusing on trusted data, AI-enhanced analytics, and self-service AI solutions. Qlik AutoML plays a crucial role in this vision, bridging the gap between advanced machine learning capabilities and your practical needs as analysts and business users.
Under the hood, we've incorporated state-of-the-art techniques in automated machine learning, all while keeping the interface intuitive and code-free. This means you can now build models that rival those created by data scientists, all within the governed, secure environment you trust.
We recently showcased these new capabilities at Qlik Connect, and the enthusiasm from attendees like you was overwhelming. The latest version of Qlik AutoML is now available, ready for you to explore and push the boundaries of what's possible with your data.
Looking ahead, your feedback is already shaping the future of AutoML at Qlik. In the coming months, we'll be introducing even more advanced features, including enhanced support for time series forecasting, automated anomaly detection, and deeper integration with Qlik's associative engine for even more powerful predictive insights.
As we continue to lead the way in AI-powered analytics, we invite you to experience the next evolution of Qlik AutoML and harness the power of advanced machine learning. Don't wait to turn your data into a competitive advantage – start exploring Qlik AutoML today, drive proactive decisions with measurable business impact, and join us in shaping the future of augmented analytics.
Want to Learn More? Get Started with AutoML today
- Intelligent Model Optimization: Remember those challenges with feature engineering and handling imbalanced datasets? AutoML now automatically tackles these for you. Here's what you can expect:
-
NumericalAbbreviation Variable
One of the new features in the April 2018 release of Qlik Sense was the addition of the NumericalAbbreviation variable. This variable allows users to specify the numeric abbreviations that are used when a numeric value has an Auto number format. This was great because by default, G is used to indicate billions and my preference is to use B. Now, I can do that by editing the NumericalAbbreviation variable in my script. If you are familiar with... Show MoreOne of the new features in the April 2018 release of Qlik Sense was the addition of the NumericalAbbreviation variable. This variable allows users to specify the numeric abbreviations that are used when a numeric value has an Auto number format. This was great because by default, G is used to indicate billions and my preference is to use B. Now, I can do that by editing the NumericalAbbreviation variable in my script. If you are familiar with scripting, you know that the first few lines on the Main tab in the script are SET variable statements that indicate what abbreviations and values you would like to use to represent certain data in your app. For example, in the script below, the MonthNames variable is set to how I would like to abbreviate months in my app.

With the NumericalAbbreviation variable, I can specify how I will like the numeric abbreviation to appear. By default, it is set like this:

If you created an app using a release prior to the April 2018 release, you will not see this variable on the Main tab in your script but you can add it to your script along with the other variables statements. The easiest way to do this is to copy and paste it from Qlik Help.
In the app screenshot below, you can see the G used in the Total Gross KPI and in the Top 10 Theaters bar chart (bottom left).
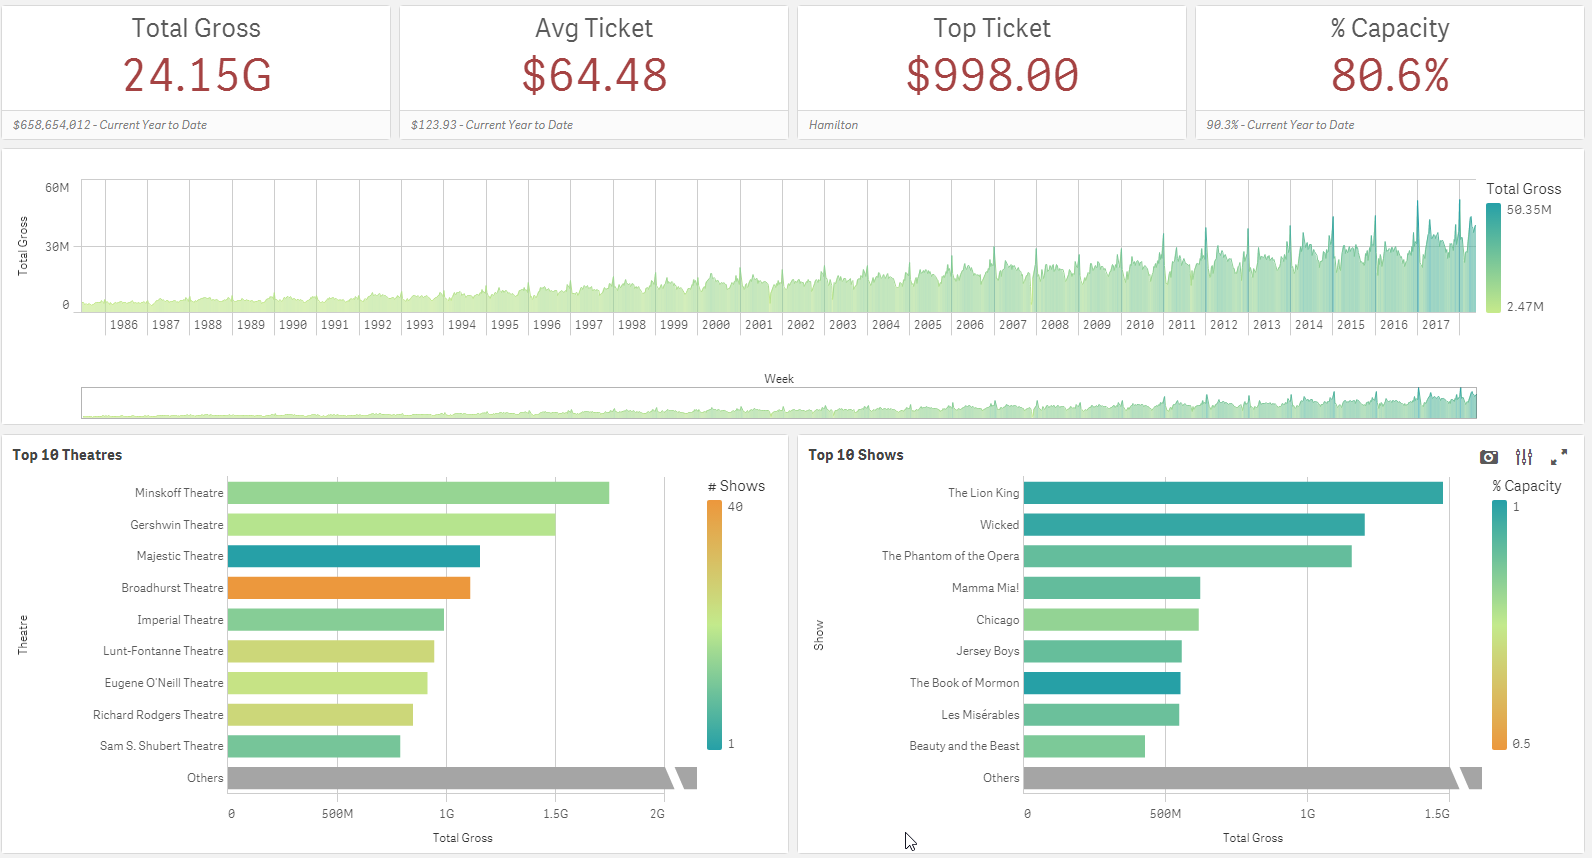
Since my preference is to use the B instead of G to show billions, I changed the NumericalAbbreviation variable to be:

Now the app looks like this:
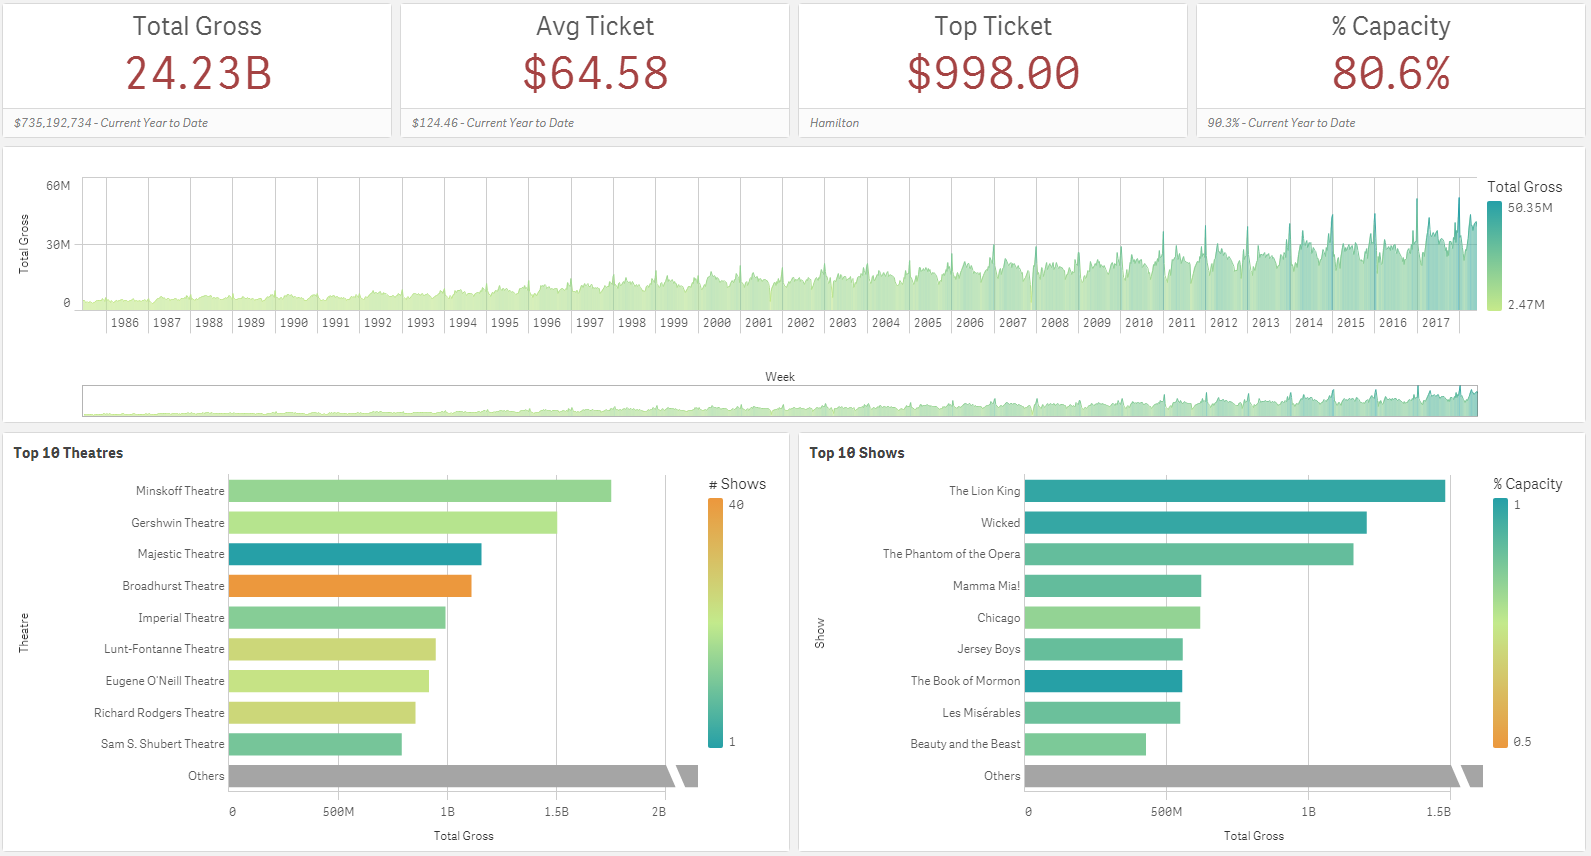
A small, easy tweak to the script, allowed me to change the numeric abbreviation in the app. I should note that the numeric abbreviation is used only when Numbering Format is set to Auto. So, if the Numbering Format is set to something other than Auto such as Money or Number, the NumericAbbreviation variable is not used and the format that you specify in the properties of the object is used.
In this blog, I showed one example of how the NumericalAbbreviation variable can be used but it can also be used to add spacing before the abbreviation or other custom abbreviations, if you choose. This seems like a small feature but it has a large impact providing users with more flexibility and control over how the data is displayed. To learn about other new features released in April, check out Michael Tarallo’s Qlik Sense – What’s New April 2018 video.
Thanks,
Jennell
-
Do you have what it takes to be a Qlik Academic Program Educator Ambassador?
Apply to become an Educator Ambassador today! -
New Straight Table Enhancements
The new straight table, found in the Qlik Visualization bundle, has two new enhancements in Qlik Cloud. The first is expression-based text styling and the second is measure modifiers. Let’s look at how these new enhancements can be used. With the first enhancement, columns in a straight table can be styled based on an expression. This is done in the properties of a column in the Text style expression. There are four styles that... Show MoreThe new straight table, found in the Qlik Visualization bundle, has two new enhancements in Qlik Cloud. The first is expression-based text styling and the second is measure modifiers. Let’s look at how these new enhancements can be used.
With the first enhancement, columns in a straight table can be styled based on an expression. This is done in the properties of a column in the Text style expression.
There are four styles that can be applied in the expression. They are:
- Bold: <b> or <B>
- Italics: <i> or <I>
- Underlined: <u> or <U>
- Strikethrough: <s> or <S>
In the expression, the style can be in written in uppercase or lowercase letters and it should be enclosed in single quotes. Here is an example of an expression that can be used to bold the text in the Customer column if the Customer is Boombastic.
The results in the table look like this:
To bold all the text in the Customer column, '<b>' can be used in text style expression without the if statement.
In the example below, the text in the Discount column and the Product Name column is strikethrough if the discount is equal to 0. The same expression below is used in both columns to format the text.
Text styles can also be combined in an expression. In the example below, the text is bold, italicized and underlined if the Sales value is greater than $1,000. Notice that all the style codes are included in the single quotes.
Multiple styles can be used in the same expression based on different criteria as well. For example, Sales values can be bold if over $1,000 and strikethrough if under $100.
While text styles can be combined, use with care and use the text styles to highlight something in the data, not clutter it.
The second enhancement of the new straight table are measure modifiers. Modifiers are not new to Qlik Sense, but they are new to the straight table. In the properties of a measure, there is an option to add a modifier. The four modifier options are: accumulation, moving average, difference and relative numbers (see image below). When a modifier is selected, other modifier settings will be made available for developers to edit as needed.
Let’s look at each modifier briefly. The accumulation modifier will accumulate the measure value over dimension(s). In the table below, the Sales – Accumulation value will accumulate over the Year Month dimension.
The moving average modifier will average the measure value over a specified period. In the properties below, the moving average modifier is set to full. Also notice the output expression which shows the expression used for the modified measure – this is available for all modifier options.
With these settings, the results off the modifier will look like the table below. With every row, the Sales value is included to calculate the new moving average.
The difference modifier will display the difference between the measure value as seen in the table below. In this case, the difference between the previous row and current row values.
The relative numbers modifier will display relative percentages that can change based on the properties selected. In the example below, the year 2023 is selected. If the selection scope is set to current selections, then the resulting table will show the percentages for 2023 only.
If the selection is disregarded, then the percentages ignore the 2023 selection and show percentages across all the month year timeframes. Below in the resulting table, the percentages are a lot lower since they are across a larger dataset.
To learn more about these enhancements, check out Qlik help using the links below.
Thanks,
Jennell
-
Qlik Sense May 2024 (Client-Managed) now available!
We are happy to announce the next version of our client-managed analytics offering, Qlik Sense May 2024. This version includes improvements primarily focused on visualizations, connectivity, and the ability to preload apps. -
Qlik Customer Portal Launching July 15!
The new home for your support needs and your gateway to unlock solutions. -
HELLO SalesAI
Say goodbye to the days of pinging product managers for answers, sifting through documents, and scrambling for competitive insights just minutes before a call. Say hello to SalesAI – a transformative solution that empowers sellers to access the information they need precisely when they need it. -
Qlik Sense Version Control
There is no doubt that having some sort of version control system baked into your development workflow is very important especially when challenges like storing and maintaining different backup versions of a project or collaborating with other members of your team become a nightmare.A version control system makes all these problems disappear as it enables you to commit changes you make throughout the lifetime of a project, giving you access to hi... Show MoreThere is no doubt that having some sort of version control system baked into your development workflow is very important especially when challenges like storing and maintaining different backup versions of a project or collaborating with other members of your team become a nightmare.
A version control system makes all these problems disappear as it enables you to commit changes you make throughout the lifetime of a project, giving you access to historical versions that you can easily roll back to. It also allows for easier collaboration as multiple people can simultaneously work on the same project by branching out into their own isolated environments without impacting the work of others in a controllable and maintainable manner.
When it comes to Qlik Sense, the lack of version control capabilities has opened the door to both simple solutions that can work for a smaller context as well as more creative ones to fill in the gap. From copying applications that may lead to a cluttered workspace, to manually creating your own system using a combination of Git and serializing your Qlik Sense apps, to sophisticated third-party solutions that take care of the heavy lifting, you can test and choose the option that fits your needs.
You can visit this Knowledge Base post to discover more Qlik Sense version control solutions.
In this blog post, I gave one of these solutions a go to see how adding version control can change the way you develop your Qlik Sense apps in the future.
Gitoqlok is a chrome extension that does just that, it integrates your VCS of choice such as Github, BitBucket, Gitlab, Gitea, etc … with your Qlik Sense App through their respective APIs. It uses the concept of serializing application objects to JSON and deserializing them back. The supported objects include story, sheet, measure, dimension, masterobject, snapshot, variable, bookmark, appprops, and fields.
Source: gitoqlik.comTo get started, install the chrome extension here.
1. Connect Gitoqlik to the Github API using your personal token:
Visit Github to generate a new token and check the “repo” scope. Copy over your newly generated token into the "Git Settings" page of the extension. Make sure to go over the settings including your repository visibility (private or public), how your repo and branches will be named by default, etc..2. Once you create your app, you are ready to use the extension to create a repository. Gitoqlok makes this easy as it automatically detects your Qlik app, generates a default repo name based on the settings previously selected, and creates a master branch.
3. As you’re making progress developing the app (loading data, scripting, creating a data model, analyzing and visualizing data), you can commit your changes into the repo every time. Your commits can include the Load Script, the App Objects, Reload Tasks, and Data Connections.
You can use the git commit history to view your changes and revert to a previous state.
4. You can collaborate with other people from your team so that each team member works on their own copy of the app in their own workspace.
Each team member would create an isolated branch inside the repository so that their changes do not affect the master branch. Gitoqlik makes this process seamless as it detects that copies of the main application have been created and finds the main repository allowing you to branch out with a single click.For more information about this tool, check out the docs.
I would love to hear what techniques you use to collaborate or track your changes when developing QS apps. If you have any suggestions for integrating version control with Qlik Sense, please leave them in the comments below.
-
School Information
School Information JBTCYH Provide information on Schools in Singapore (eg Secondary Schools) Discoveries Information for Sec 1 posting Impact Allow parents to access to such information Audience For Parents/Students Data and advanced analytics Easy reference for School information in SG
-

-
Techspert Talks - Qlik Cloud Administration 101
Hi everyone, Want to stay a step ahead of important Qlik support issues? Then sign up for our monthly webinar series where you can get first-hand insights from Qlik experts.The Techspert Talks session from September looked at Qlik Cloud Administration 101. But wait, what is it exactly?Techspert Talks is a free webinar held on a monthly basis, where you can hear directly from Qlik Techsperts on topics that are relevant to Customers and Partners to... Show MoreHi everyone,
Want to stay a step ahead of important Qlik support issues? Then sign up for our monthly webinar series where you can get first-hand insights from Qlik experts.
The Techspert Talks session from September looked at Qlik Cloud Administration 101.But wait, what is it exactly?
Techspert Talks is a free webinar held on a monthly basis, where you can hear directly from Qlik Techsperts on topics that are relevant to Customers and Partners today.In this session we cover:
- Important settings
- Space and App management
- Report and Alert configuration
Click on this link to see the presentation

-
Introducing Qlik Answers
Informing workers with knowledge from unstructured content. A plug-and-play, Generative AI powered RAG solution. -
Cyclic Dimension
Today I am going to blog about cyclic dimensions. A cyclic dimension is a group of dimensions that can be cycled through in a visualization. The dimensions do not have to be related or have a hierarchical relationship. The dimensions only have to make sense with the measures used in the visualizations. Cyclic dimensions can be very useful when it is valuable to view a visualization across many dimensions. It becomes even more valuable if there ar... Show MoreToday I am going to blog about cyclic dimensions. A cyclic dimension is a group of dimensions that can be cycled through in a visualization. The dimensions do not have to be related or have a hierarchical relationship. The dimensions only have to make sense with the measures used in the visualizations. Cyclic dimensions can be very useful when it is valuable to view a visualization across many dimensions. It becomes even more valuable if there are multiple visualizations on a sheet, or in an app, that use the same cyclic dimension. When a cyclic dimension is switched to the next field, all visualizations that use the cyclic dimension will be changed to the same field. This is a time saver. You may wonder if alternate dimensions can do the same thing. Alternate dimensions allow a user to change the dimension in a chart, but it only changes it for the specified chart whereas a cyclic dimension can change the dimension for multiple charts. Alternate dimensions can also be used in a visualization with a cyclic dimension.
Building a cyclic dimension is very easy and there are few ways to use them. You create a cyclic dimension the same as you do a single or drill-down dimension. From the Master items, create a new dimension. At the top select Cyclic dimension type, then add the fields to include. Give the cyclic dimension a name and save. Labels can be added to give the fields a different name and description. At least two fields need to be added to a cyclic dimension.
A cyclic dimension can be added to a visualization the same way a single dimension is added. Once they are added to a visualization a cycle icon will appear next to the field name as well as an arrow. By default, the first field in the cyclic dimension will be displayed. To change the dimension in the visualization, a user can click on the cycle icon or click on the label or down arrow and select another dimension.
Another way a user can cycle through the dimensions is to use a button. In the What’s New app, buttons have been created to cycle through the cyclic dimensions.
In all three buttons, the action is set to Step cyclic dimension and the Step is set to backward for the left arrow and forward for the right arrow and the cycle button in the middle.
Left arrow button
Right arrow & cycle buttons
In the What’s New app, you can also see how changing the cyclic dimension in one visualization, updates all the visualizations using the cyclic dimension. In the screenshot below, Category Name is the current cyclic dimension.
If I switch the dimension, using any of the ways I have described above, Country Code is the dimension. Notice that the dimension in all the visualizations have been updated to Country Code in the screenshot below.
Check out Qlik Help to learn more about cyclic dimensions and to be aware of the limitations. Also watch Michael Tarallo’s SaaS in 60 video on Cyclic Group Dimensions. Try them out in your next app.
Thanks,
Jennell
-
Discovering qlik-embed: Qlik’s new library for Embedding Qlik Sense in web apps
In previous posts on the Design blog, we've explored various ways for embedding Qlik Sense analytics. These have ranged from straightforward iFrames to more complex approaches like the Capabilities API, as well as more recent tools such as Nebula.js and Enigma.js. Today, we’re going to be taking a quick look at a new library from Qlik called qlik-embed, but before diving into it, I would like to clarify that this library is currently in public pr... Show MoreIn previous posts on the Design blog, we've explored various ways for embedding Qlik Sense analytics. These have ranged from straightforward iFrames to more complex approaches like the Capabilities API, as well as more recent tools such as Nebula.js and Enigma.js.
Today, we’re going to be taking a quick look at a new library from Qlik called qlik-embed, but before diving into it, I would like to clarify that this library is currently in public preview and at the time of writing this blog, frequent updates as well as breaking changes are prone to happen (you can read more about that on qlik.dev or follow the Changelog for updated https://qlik.dev/changelog)
So what exactly is qlik-embed?
qlik-embed is a library for easily embedding data and analytics interfaces into your web apps while overcoming some of the concerns that usually arise when embedding content from one software application to another such as third-party cookies, cross-site request forgery, content security policy etc..
The library is designed to work with web apps from simple plain HTML ones to more modern frameworks like React etc.. That is in fact made easier since whichever qlik-embed flavor you use, the configuration options, the methods, and the properties will be similar.
If you are already embedding Qlik Sense content into your web applications, you can learn about the various reasons why qlik-embed would be a better solution on qlik.dev (https://qlik.dev/embed/qlik-embed/qlik-embed-introduction#why-qlik-embed-over-capability-api-or-nebulajs)
Web Components:
qlik-embed makes use of web components which are basically custom HTML elements in the form of <qlik-embed> </qlik-embed> HTML tags that allow you to configure properties of the content you’re embedding
You can find all supported web-components here:
How to quickly get started?
Before getting started, it’s worth noting that there are several ways to connect qlik-embed web components to Qlik.
More information about Auth can be found here:
- Connect qlik-embed: https://qlik.dev/embed/qlik-embed/connect-qlik-embed
- Best Practices: https://qlik.dev/embed/qlik-embed/qlik-embed-auth-best-practice
You can connect to qlik-embed in these ways:
- Qlik Cloud API keys (cookie-less)
- Qlik Cloud OAuth2 clients (cookie-less)
- Qlik Cloud interactive login (cookies)
- Qlik Sense Enterprise Client Managed interactive login (cookies)
- None (This is a more advanced option and requires handling authenticated requests using a custom authorization backend proxy - learn more about that here: https://qlik.dev/authenticate/jwt/jwt-proxy/)
In this post, we’re going to use OAuth2 Single-page-app from the Qlik Cloud tenant Management Console under oAuth:
Example using HTML Web Components:
Reference page: https://qlik.dev/embed/qlik-embed/qlik-embed-webcomponent-quickstartFirst thing we need to do is add a <script> element in the <head> tag to configure the call to the qlik-embed library and set up the attributes relevant to the connection we choose.
<script crossorigin="anonymous" type="application/javascript" src="https://cdn.jsdelivr.net/npm/@qlik/embed-web-components" data-host="<QLIK_TENANT_URL>" data-client-id="<QLIK_OAUTH2_CLIENT_ID>" data-redirect-uri="<WEB_APP_CALLBACK_URI>" data-access-token-storage="session" > </script>- data-host is the URL to your Qlik Cloud tenant. For example https://example.us.qlikcloud.com/
- data-client-id is the client ID for the single-page application OAuth2 client registered for this web application.
- data-redirect-uri is the location of the web page the OAuth2 client will call back to when authorization requests are made from your web application to your Qlik tenant. This web page should be added to your web application.
web-component:
<qlik-embed ui="classic/app" app-id="<APP_ID>"></qlik-embed>oauth-callback.html:
<!DOCTYPE html>
<html lang="en">
  <head>
    <meta charset="utf-8" />
    <script
      crossorigin="anonymous"
      type="application/javascript"
      data-host="<QLIK_TENANT_URL>"
      src="https://cdn.jsdelivr.net/npm/@qlik/embed-web-components/dist/oauth-callback.js"
    ></script>
  </head>
</html>
You can fork the full example here and change the “Tenant URL” and the rest of the attributes to your own tenant after creating the OAuth SPA config: https://replit.com/@ouadielim/qlik-embed-HTML-Web-Components#index.html
result:
Example using React:
In React, you can use qlik’s embed-react library package: npm install @qlik/embed-react (https://www.npmjs.com/package/@qlik/embed-react)
Then, you can import QlikEmbed and QlikEmbedConfig from @qlik/embed-react. React’s context is used to pass in the hostConfig that you configure to point to your Qlik Cloud Tenant (host) and use the OAuth 2 config (clientId). The redirect URI needs to point to a page which is similar to what we did above in HTML web components.
import { QlikEmbed, QlikEmbedConfig } from "@qlik/embed-react";

const hostConfig = {
  host: "<QLIK_CLOUD_TENANT>",
  clientId: "<CLIENT_ID>",
  redirectUri: "https://localhost:5173/oauth-callback.html",
  accessTokenStorage: "session",
  authType: "Oauth2",
};
const appId = "<APP_ID>";
const sheetId = ""; // sheet id or empty string

export default () => (
  <QlikEmbedConfig.Provider value={hostConfig}>
	<div className="container">
      <h1>Qlik Embed with React</h1>
	      <div className="selections-bar">
        <QlikEmbed ui="analytics/selections" appId={appId} />
      </div>
      <div className="viz">
        <QlikEmbed ui="classic/app" app={appId} sheet={sheetId} />
      </div>
      <div className="viz">
        <QlikEmbed ui="analytics/chart" appId={appId} objectId="hRZaKk" />
      </div>
	  </div>
  </QlikEmbedConfig.Provider>
);
You can clone the full React example here: https://github.com/ouadie-limouni/qlik-embed-react
result:
Limitations ?
There are a few limitations to qlik-embed as it continues to develop into a more stable and robust library - you can read more about those on qlik.dev: https://qlik.dev/embed/qlik-embed/qlik-embed-limitations
Like I mentioned at the very beginning, qlik-embed is new and evolving quickly, I invite you to test it to get familiar with it early and stay tuned for more updates and bug fixes as they come out using the Changelog page.
I hope you found this post helpful, please let me know in the comments below if you have any questions!
Thanks
- Ouadie -
Celebrating Summer Solstice with Streamlined Scripting
As we embrace the longest day of the year, the summer solstice, I am reminded of the importance of making the most of every moment. While the sun shines brightly, we want our dedicated Qlik developers, consultants, and "Qlik script rock-stars" to enjoy the weather rather than spend countless hours in the script editor interface. That’s why we are excited to introduce our latest improvements, designed to enhance your scripting experience and give ... Show MoreAs we embrace the longest day of the year, the summer solstice, I am reminded of the importance of making the most of every moment. While the sun shines brightly, we want our dedicated Qlik developers, consultants, and "Qlik script rock-stars" to enjoy the weather rather than spend countless hours in the script editor interface. That’s why we are excited to introduce our latest improvements, designed to enhance your scripting experience and give you more time to bask in the summer glow.
Keep reading to explore the enhancements we've made to the script and data load editors, ensuring a more efficient, consistent, and enjoyable user experience. Whether you're tackling data prep or loading data into a Qlik Sense app, these updates will streamline your workflow and promote best practices, allowing you to spend less time on scripts and more time soaking up the sunshine.
Fixing pain points in autocomplete
Autocomplete has been a persistent issue for many of you, often causing more frustration than convenience. Recognizing this, we released an update on February 15th, to make autocomplete less aggressive in both script and expression editors. This seemingly small bug fix has had a significant impact, earning praise from our developer community.
A few days ago on June 18th, we released an enhancement that allows you to enable or disable autocomplete according to your preference. This flexibility addresses one of the biggest pain points raised by our script writers, empowering you to work more efficiently.
For more details, check out the community discussion by Partner Ambassador – Ometis.
Consistent user experience across script editors
We are committed to providing a consistent user experience across our platforms. In November 2023, we released a standalone script editor for data prep use cases. This year, we’ve ensured that the functionality in the standalone script editor is mirrored in the Data Load Editor used by over 11k users for loading data into Qlik Sense apps.
Promoting good practices with reusable and modular code
We’ve also made strides in promoting good coding practices. We introduced QVS file support, allowing you to upload, preview, and include QVS files in your scripts. This feature, released on April 31st in the script editor and on May 21st in the Data Load Editor, supports the reuse of script parts and encourages modularity.
Stay tuned for future updates… because we are planning to take the current functionality of read only to the next level and include editable scripts within Qlik Cloud!
This enhancement not only promotes best practices but also helps with a smoother transition to Qlik Cloud for those heavily utilizing QVS files in client-managed deployments.
Explore community feedback:
Enhanced Data Load EditorThe Enhanced Data Load Editor, released on May 21st, brings a host of new functionalities aimed at improving usability. These include the ability to preview loaded data directly from the editor, the introduction of a STORE command wizard, and resizable panels. With these improvements the script coding experience is more intuitive and efficient, aligning it with the capabilities of the enhanced script editor in Qlik Cloud.
Key features include:
- Data preview with limited loading and table/profile previews for troubleshooting during development without switching between app sheets or data model viewer, allowing quick checks on script effects on a limited number of rows.
- Resizable panels for a customizable workspace
Note: These enhancements were previously introduced in the standalone script editor in November 2023 for data prep use cases. If you missed that update, catch up here:
Community reactions
The release of these improvements in the Data Load Editor has inspired positive reactions across the Qlik community. Here’s what some of our Partner Ambassadors and consultants had to say:
- Partner Ambassador Alex Walker - Ometis
- Partner Ambassador Cristof Schwarz - Databridge
- Consultant Paul Verkooijen - BZTRS Agency
Embracing a 'Cloud-First' approach
While we emphasize a cloud-first strategy, we understand the importance of supporting both cloud and client-managed environments. The standalone script editor and script object improvements are currently supported in Qlik Cloud. However, enhancements to the Data Load Editor and expression editor are also included in Qlik Sense client-managed, with major updates planned for the November 2024 release.
These updates, including enhanced Data Load Editor features and QVS file support, not only improve the current experience but also encourage a gradual move to Qlik Cloud.
Looking forward
As we continue to innovate and improve the Qlik scripting experience, your feedback remains invaluable. Be on the lookout for more updates, and let’s make the most of these long summer days together!
To learn more:
- What’s New in Qlik Cloud | Qlik Help
- Creating reusable load script with QVS files | Qlik Help
- Scripting to load or export data | Qlik Help
-
Sheet and Object-level Access Control in Qlik Cloud
Let's see how it is possible to control sheet and object-level access in Qlik Cloud, specifically when organizations want to show/hide specific assets in an application based on the group membership of the current user that is accessing the application.
-
-
This is How You Enable Your Sales Team with Qlik Answers
Let’s take a look at how Qlik’s new generative-AI powered knowledge assistant, Qlik Answers, is helping our own salesforce better serve customers.
-
The Document Locale
The locale defines a number of regional settings. Here is how it is done in Qlik Sense.