Unlock a world of possibilities! Login now and discover the exclusive benefits awaiting you.
Product Innovation
By reading the Product Innovation blog, you will learn about what's new across all of the products in our growing Qlik product portfolio.
Support Updates
The Support Updates blog delivers important and useful Qlik Support information about end-of-product support, new service releases, and general support topics.
Qlik Academic Program
This blog was created for professors and students using Qlik within academia.
Community News
Hear it from your Community Managers! The Community News blog provides updates about the Qlik Community Platform and other news and important announcements.
Qlik Digest
The Qlik Digest is your essential monthly low-down of the need-to-know product updates, events, and resources from Qlik.
Qlik Learning
The Qlik Learning blog offers information about the latest updates to our courses and programs, as well as insights from the Qlik Learning team.
Recent Blog Posts
-
【オンデマンド配信】銀の弾丸はない…しかし。タテヨコを貫くデータ活用の起爆剤
企業のビジネス活動において、データはこれまで以上に必要不可欠な資産となっています。増え続けるデータを管理・統合・分析し、データでアクションを起こす必要性が増している現在、成功している企業はどのようなデータ戦略を実行しているのか?本 Web セミナーシリーズでは、Qlik でデータからアクションを起こすデータ主導のビジネスで成功しているお客様より、課題から導入の経緯、デモンストレーション、活用例などをご紹介します。 ※ 参加費無料。パソコン・タブレット・スマートフォンで、どこからでもご視聴いただけます。 オンデマンド配信:銀の弾丸はない…しかし。タテヨコを貫くデータ活用の起爆剤 データはあるがどう活かせば良いかわからない、もっと組織の壁を越えてデータを活用したいなど、データの持つ可能性に気づいているが故に多くの方が悩みを抱えていると思います。 スズキ株式会社では、さまざまな部門でデータ活用が進んでいます。その中の1つである海外営業部門では、海外拠点の膨大なデータを収集して可視化。ユーザー自... Show More企業のビジネス活動において、データはこれまで以上に必要不可欠な資産となっています。増え続けるデータを管理・統合・分析し、データでアクションを起こす必要性が増している現在、成功している企業はどのようなデータ戦略を実行しているのか?
本 Web セミナーシリーズでは、Qlik でデータからアクションを起こすデータ主導のビジネスで成功しているお客様より、課題から導入の経緯、デモンストレーション、活用例などをご紹介します。※ 参加費無料。パソコン・タブレット・スマートフォンで、どこからでもご視聴いただけます。
オンデマンド配信:
銀の弾丸はない…しかし。タテヨコを貫くデータ活用の起爆剤データはあるがどう活かせば良いかわからない、もっと組織の壁を越えてデータを活用したいなど、データの持つ可能性に気づいているが故に多くの方が悩みを抱えていると思います。
スズキ株式会社では、さまざまな部門でデータ活用が進んでいます。その中の1つである海外営業部門では、海外拠点の膨大なデータを収集して可視化。ユーザー自身がデータを分析し、売上状況や在庫管理に活用しています。いかにして部門や国をまたいだデータ活用の機運が高まったのか。Qlik Sense の導入経緯や活用例、課題の克服など、デモを交えてご紹介します。また、Qlik 技術担当者との対談では、技術面や社内の活用状況などを詳しくお伺いします。
-
Welcome Marcin Stawarz - Qlik Educator Ambassador for 2024!
This week we meet Marcin Stawarz, one of our new educator ambassadors for 2024 and one of our first ambassadors from Poland. -
This week’s reporting services news, moves and changes
Shifts in packaging & pricing -
Interacting with data using Enigma.js: Hypercubes and List Objects
When using Enigma.js to communicate with the Qlik Associative Engine to build visualizations for instance or simply to get access to data from Qlik Sense, you will certainly come across the concept of Generic Objects, which are structures for storing and interacting with data in an application. They are considered generic because of they are flexible structures that can represent many different app components such as sheets, bookmarks, hypercubes... Show MoreWhen using Enigma.js to communicate with the Qlik Associative Engine to build visualizations for instance or simply to get access to data from Qlik Sense, you will certainly come across the concept of Generic Objects, which are structures for storing and interacting with data in an application. They are considered generic because of they are flexible structures that can represent many different app components such as sheets, bookmarks, hypercubes, lists etc..
In this blog post, we will go over Hypercubes and List Objects providing a brief explanation of the concepts and how to use them with enigma.js
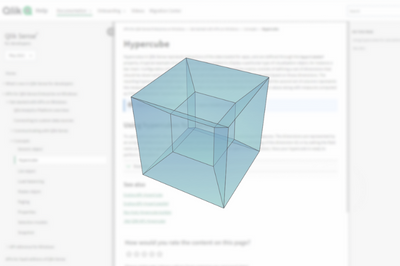
Hypercubes
In Qlik Sense, a Hypercube is an interface for defining a set of data to extract. It is the definition provided to the Qlik Data Engine, which holds all information on which data is queried and how it’s calculated. If selections are applied to a Hypercube, only the selected values will be returned.
For example, this can represent data needed to display some type of visualization such as a bar chart that shows “Sum of Sales” by “Salesperson”. At its simplest form, you can think of it as a table comprised of rows and columns. In that sense, our Hypercube that would power our barchart, would consist of a table with “Salesperson” as a column, and the evaluated “Sum(Sales)” expression as the other column. The engine will fill the cells of this table and extract all the information.
In order to use a Hypercube, we need to define it through the “qHyperCubeDef” object which is passed on to the Qlik Engine API to create a query for processing the data.
A very simple definition of a Hypercube looks like this:
qHyperCubeDef: {
    qDimensions: [],
    qMeasures: [],
    qInitialDataFetch: [{
        qWidth: 2,
        qHeight: 50
    }]
  }
But since it is a very flexible tool of extracting data, that means that there is a huge amount of settings available for it. You can view the full definition of the structure here.
Let’s go over the most important ones:
- qDimensions: defines the array of dimensions that will be used in the HyperCube. You can have multiple dimensions depending on the results you want.
- There is a number of settings within the dimension that you can set. More about these here.
- For instance, qNullSuppression: which removes null values in the dimension
- qShowAll, which if set to true, displays all dimension values, regardless of whether they are selected or not.
- etc...
- qMeasures: similar to how qDimensions are defined, but used to define measures, i.e: calculations performed for each distinct value of dimensions.
- qInitialDataFetch: defines how many data cells are initially retrieved from the calculated HyperCube.
- qSuppressZero: if set to true, removes rows that have zero values across the entrie HyperCube row
- qMode: defines the structure of the HyperCube that will be returned. By default, the data is returned as a straight table representation. But more advanced modes are available, such as:
- Pivot table representation (qMode -> P)
- Stacked table representation (qMode -> K)
- Tree representation (qMode -> T)
- There is a number of settings within the dimension that you can set. More about these here.
Below is an example of a Hypercube where we define 1 dimension (ID) and 1 measure (=Sum(Value)), Notice that we define qWidth and qHeight properties within qInitialDataFetch as 2 and 5 respectively, since we have 2 columns and would like to get 5 rows of data for a total of 10 cells.
P.S: The maximum number of cells (qWidth * qHeight) allowed in an initial data fetch is 10,000.
const properties = {
  qInfo: {
    qType: 'my-straight-hypercube',
  },
  qHyperCubeDef: {
    qDimensions: [
      {
        qDef: { qFieldDefs: ['ID'] },
      },
    ],
    qMeasures: [
      {
        qDef: { qDef: '=Sum(Value)' },
      },
    ],
    qInitialDataFetch: [
      {
        qHeight: 5,
        qWidth: 2,
      },
    ],
  },
};
So how does the implementation look like in enigma.js?
For the purposes of this example, we are creating a Session App (i.e: have an inline script and create an app on the fly).
const qlikScript = `
TempTable:
Load
RecNo() as ID,
Rand() as Value
AutoGenerate 100
`;

const properties = {
  qInfo: {
    qType: 'my-straight-hypercube',
  },
  qHyperCubeDef: {
    qDimensions: [
      {
        qDef: { qFieldDefs: ['ID'] },
      },
    ],
    qMeasures: [
      {
        qDef: { qDef: '=Sum(Value)' },
      },
    ],
    qInitialDataFetch: [
      {
        qHeight: 5,
        qWidth: 2,
      },
    ],
  },
};

const session = createSession();

// Open the session and create a session document:
session.open()
  .then((global) => global.getActiveDoc())
  .then((doc) => doc.setScript(qlikScript)
    .then(() => doc.doReload())
    // Create a generic object with a hypercube definition containing one dimension and one measure
    .then(() => doc.createObject(properties))
    // Get hypercube layout
    .then((object) => object.getLayout()
      .then((layout) => console.log('Hypercube data pages:', JSON.stringify(layout.qHyperCube.qDataPages, null, '  ')))
      // Select cells at position 0, 2 and 4 in the dimension.
      .then(() => object.selectHyperCubeCells('/qHyperCubeDef', [0, 2, 4], [0], false))
      // Get layout and view the selected values
      .then(() => console.log('\n### After selection (notice the `qState` values):\n'))
      .then(() => object.getLayout().then((layout) => console.log('Hypercube data pages after selection:', JSON.stringify(layout.qHyperCube.qDataPages, null, '  '))))))
  // Close the session
  .then(() => session.close())
  .catch((error) => {
    console.log('Session: Failed to open socket:', error);
    process.exit(1);
  });
Notice that after opening the enigma session, and calling the necessary methods for our session app, we call “createObject” to create a Generic Object with our Hypercube definition containing 1 dimension and 1 measure, then get the Hypercube Layout which returns a bunch of results including our data.
We’re mostly interested in “qDataPages” which holds our calculated data. Below is how the typical response looks like:
Going back to our code, the full qDataPages results are as follows from our first console.log:
Hypercube data pages: [
  {
    "qMatrix": [
      [
        {
          "qText": "1",
          "qNum": 1,
          "qElemNumber": 0,
          "qState": "O"
        },
        {
          "qText": "0.73213545326144",
          "qNum": 0.732135453261435,
          "qElemNumber": 0,
          "qState": "L"
        }
      ],
      [
        {
          "qText": "2",
          "qNum": 2,
          "qElemNumber": 1,
          "qState": "O"
        },
        {
          "qText": "0.66564685385674",
          "qNum": 0.6656468538567424,
          "qElemNumber": 0,
          "qState": "L"
        }
      ],
      [
        {
          "qText": "3",
          "qNum": 3,
          "qElemNumber": 2,
          "qState": "O"
        },
        {
          "qText": "0.66189019801095",
          "qNum": 0.6618901980109513,
          "qElemNumber": 0,
          "qState": "L"
        }
      ],
      [
        {
          "qText": "4",
          "qNum": 4,
          "qElemNumber": 3,
          "qState": "O"
        },
        {
          "qText": "0.98009621817619",
          "qNum": 0.9800962181761861,
          "qElemNumber": 0,
          "qState": "L"
        }
      ],
      [
        {
          "qText": "5",
          "qNum": 5,
          "qElemNumber": 4,
          "qState": "O"
        },
        {
          "qText": "0.48425585823134",
          "qNum": 0.4842558582313359,
          "qElemNumber": 0,
          "qState": "L"
        }
      ]
    ],
    "qTails": [
      {
        "qUp": 0,
        "qDown": 0
      }
    ],
    "qArea": {
      "qLeft": 0,
      "qTop": 0,
      "qWidth": 2,
      "qHeight": 5
    }
  }
]
Notice that we have additionally called the “selectHyperCubeCells” method in order to make a selection on the cells at positions 0, 2, and 4 in the Dimension. Here is how the results of qDataPages looks like after the selection:
### After selection (notice the `qState` values):
Hypercube data pages after selection: [
  {
    "qMatrix": [
      [
        {
          "qText": "1",
          "qNum": 1,
          "qElemNumber": 0,
          "qState": "S"
        },
        {
          "qText": "0.73213545326144",
          "qNum": 0.732135453261435,
          "qElemNumber": 0,
          "qState": "L"
        }
      ],
      [
        {
          "qText": "3",
          "qNum": 3,
          "qElemNumber": 2,
          "qState": "S"
        },
        {
          "qText": "0.66189019801095",
          "qNum": 0.6618901980109513,
          "qElemNumber": 0,
          "qState": "L"
        }
      ],
      [
        {
          "qText": "5",
          "qNum": 5,
          "qElemNumber": 4,
          "qState": "S"
        },
        {
          "qText": "0.48425585823134",
          "qNum": 0.4842558582313359,
          "qElemNumber": 0,
          "qState": "L"
        }
      ]
    ],
    "qTails": [
      {
        "qUp": 0,
        "qDown": 0
      }
    ],
    "qArea": {
      "qLeft": 0,
      "qTop": 0,
      "qWidth": 2,
      "qHeight": 3
    }
  }
]
List Objects
Alongside qHyperCube, the family of Generic Objects provides us with another structure called qListObject.
Unlike a Hypercube, a List Object better serves the purposes of displaying one single dimension without any required calculation, meaning no metrics are required to be defined.
As such, it is fairly straightforward to work the list objects, and their definition is very similar to the qHyperCube object, with some added extra properties minus measures.
I usually use List Objects when I want to build a list of values to be used for selections.
The following code is an example of creating a qListObjectDef and writing the resulting list object into the console:
List object data: [
  [
    {
      "qText": "0.063513102941215",
      "qNum": 0.06351310294121504,
      "qElemNumber": 0,
      "qState": "O"
    }
  ],
  [
    {
      "qText": "0.15987460175529",
      "qNum": 0.15987460175529122,
      "qElemNumber": 1,
      "qState": "O"
    }
  ],
  [
    {
      "qText": "0.50091209867969",
      "qNum": 0.5009120986796916,
      "qElemNumber": 2,
      "qState": "O"
    }
  ]
]
After selection of the first value, the qDataPages response looks like the following:
(Notice that with a qListObject, all values are rendered, regardless of whether they have been excluded or not.If selections are applied to a list object, the selected values are displayed along with the excluded and the optional values. We do however hava access to the qState property which lets us know if the value is selected (S), alternate (A), etc..)
List object data: [
  [
    {
      "qText": "0.063513102941215",
      "qNum": 0.06351310294121504,
      "qElemNumber": 0,
      "qState": "S"
    }
  ],
  [
    {
      "qText": "0.15987460175529",
      "qNum": 0.15987460175529122,
      "qElemNumber": 1,
      "qState": "A"
    }
  ],
  [
    {
      "qText": "0.50091209867969",
      "qNum": 0.5009120986796916,
      "qElemNumber": 2,
      "qState": "A"
    }
  ]
]
Attached is a zip file containing example code that shows how a default Hypercube, Pivot Hypercube, Stacked Hypercube, and a List Object are used in enigma.js.
To run the code:
- first run “npm install”
- change the .env file with your tenant and API key (learn how to get an API key here).
- then, run “node filename.js” for each file and check the console logs.
To see how Hypercube can be used as part of creating visualizations with Nebula.js, checkout my previous blog post: https://community.qlik.com/t5/Qlik-Design-Blog/Create-a-Slope-chart-with-tooltips-and-brushing-using-Nebula-js/ba-p/1827168
- qDimensions: defines the array of dimensions that will be used in the HyperCube. You can have multiple dimensions depending on the results you want.
-
【5/21(火)- 23(木)開催】2024 ガートナー データ & アナリティクス サミット
Qlik は、今年も「ガートナー データ & アナリティクス サミット」に、講演およびブース出展します。Qlik は、AI 戦略をサポートするデータ統合・データ品質・分析ソリューションのリーダー企業です。ビジネス課題の解決、新たな目標の達成、重要なビジネスニーズへの対応など、企業のデータ活用全般をサポートします。 データとアナリティクスのリーダーが一堂に会する世界的な IT イベントに、ぜひご参加ください。Qlik 講演および Qlik ブースで、皆さまをお待ちしております。 Qlik は、Gartner® Magic Quadrant™ のデータ統合ツール・データ品質・アナリティクス / BI プラットフォームの分野で、リーダーの 1 社に評価されました。 詳細を見る【開催概要】日時:2024年 5月 21日(火)– 23日(木)会場:グランドニッコー東京(台場) 詳細を見る -
People Analytics
People Analytics FarolBIThe People Analytics application aims to identify and present the main indicators in the human resources area, where it presents possibilities of reducing the exchange/change of employees, decentralizing the management of employees and their payroll events, freeing up the Human Resources area for other activities. The focus is to decentralize People management.DiscoveriesReduction of turnover, reduction of absences, reduct... Show MorePeople AnalyticsFarolBI The People Analytics application aims to identify and present the main indicators in the human resources area, where it presents possibilities of reducing the exchange/change of employees, decentralizing the management of employees and their payroll events, freeing up the Human Resources area for other activities. The focus is to decentralize People management.
Discoveries
Reduction of turnover, reduction of absences, reduction of overtime, payroll spending planning, benefits management, decentralized management!!!
Impact
Decentralized Management of People and Benefits! Budget management and Payroll planning!
Audience
Hour control; Benefits Control; Fair management;
Data and advanced analytics
Reduction of overtime; Control and monitoring of hiring new employees; Reduction in hiring expenses!!!
-
Welcome back Angel Monjaras- Qlik Educator Ambassador for 2024!
I am pleased to introduce Angel Monjaras as the Qlik Educator Ambassador for 2024! Angel is a Professor of Business Intelligence at Instituto Tecnologico Autonomo De Mexico (ITAM), where he’s been using Qlik in his teaching for seven years. For this year’s iteration of his course, he is debuting a BI Best Practices Catalog on Qlik Sense that will enable students to find the most common metrics and dimensions for each business area and / or indu... Show MoreI am pleased to introduce Angel Monjaras as the Qlik Educator Ambassador for 2024! Angel is a Professor of Business Intelligence at Instituto Tecnologico Autonomo De Mexico (ITAM), where he’s been using Qlik in his teaching for seven years.
For this year’s iteration of his course, he is debuting a BI Best Practices Catalog on Qlik Sense that will enable students to find the most common metrics and dimensions for each business area and / or industry.
According to Angel, “This will free up class time to delve into Data Literacy and AI topics that will help students feel comfortable speaking about data, and help them stay grounded and focus on real issues and solutions, instead of jumping on the many bandwagons, buzzwords, and false promises headed their way.”
While he’s always integrated Qlik software, the past couple of years, he started to integrate some of the learning exercises from the Qlik Academic Program, “Students perform various exercises and homework, including regression analysis, visualization best practices, common visualization pitfalls, and data quality. They also design a dashboard from scratch as part of a practical course-long BI project. We use some exercises taken from QCC and the Data Analytics Curriculum, since they provide good sample data.”
Angel’s passion for Qlik goes beyond his own classroom, he has been introducing new educators from Universidad Nacional Autónoma de México, and other universities to Qlik. Angel has conducted introductory workshops for students. Angel plans to share his knowledge even further this year, by continuing to conduct open workshops for any student at his university to join.
Angel is a 2024 Qlik Luminary and will host a session in Qlik Connect this year: “C40: Taking our world-changing work to the next level with Qlik Cloud”
For Angel, one of the most rewarding parts of teaching Qlik has been seeing his students leave university and get jobs, become Qlik customers, and even fellow professors.
Educators and students can get access to free Qlik software and training resources, qualifications and certifications by applying to the Academic Program today: qlik.com/academicprogram
-
Tennis Grand Slam Final Analysis
Grand Slam Tennis Analysis Quick Intelligence An application which analyses data from 145 years of Tennis Grand Slam data, providing insights by player and tournament over time.This was created as a demonstration of the technique of pulling data from HTML tables on Web Pages (in this case two Wikipedia pages) and also to show off category colours in our Instant Sense Application.This application is a template into which any data source can ... Show MoreGrand Slam Tennis AnalysisQuick IntelligenceAn application which analyses data from 145 years of Tennis Grand Slam data, providing insights by player and tournament over time.
This was created as a demonstration of the technique of pulling data from HTML tables on Web Pages (in this case two Wikipedia pages) and also to show off category colours in our Instant Sense Application.
This application is a template into which any data source can be loaded, along with metadata describing the data to give a fully working Sense application in a very short space of time.
Find out more, and download the app, from here:Or jump straight to the live-app to make selections and discoveries in the data:
https://www.quickintelligence.co.uk/sense/gs.html
Discoveries
Our Instant Sense Application allows any data set to be uploaded and analysed. Even relatively simple datasets, like this one, can yield interesting discoveries. Perhaps the most striking thing is the large gap between the top seven players and the rest of the pack. The other thing is how the very top female players beat the top male players on many different measures.
Impact
As sports are divided into male and female competitions the data are often displayed and considered separately. By loading the data from two different sources and blending them a combined view can be given. Colouring the data by the competition dimension makes the achievements of the female players stand out.
Audience
The important thing when bringing data and analytics to people is to bring them data that they can engage with. Sometimes the simplest of data sources can be best at telling a story and drawing people in. Once those users have got used to navigating a simple dataset on a topic that interests them they will be ready to engage with the business data that can give them the edge.
Data and advanced analytics
Our Instant Sense Application is free to download and use and can be used over any dataset. It's a great way to provide a proof of concept and to quickly discover which measures are worth tracking. It ships with a number of scripts that are generally useful, such as Qlik Session Monitors and QVD Profiling, as well as scripts to load from online sources like this one.

-
Qlik Cloud and Qlik Sense on-premise: Upcoming cosmetic changes of font sizes fo...
Hello Qlik Users, Beginning on April 22nd 2024, Qlik Cloud will change how the font sizes for titles, subtitles, and footnotes are displayed. The change will carry over to Qlik Sense Enterprise on Windows with its May 2024 release. What is being changed? Font sizes for titles, subtitles, and footnotes are controlled by either: the theme, in which a customer can define a set pixel size (such as 16px), or in the property-styling panel, where the... Show MoreHello Qlik Users,
Beginning on April 22nd 2024, Qlik Cloud will change how the font sizes for titles, subtitles, and footnotes are displayed. The change will carry over to Qlik Sense Enterprise on Windows with its May 2024 release.
What is being changed?
Font sizes for titles, subtitles, and footnotes are controlled by either:
- the theme, in which a customer can define a set pixel size (such as 16px),
- or in the property-styling panel, where the same option is available.
The conversion factor Qlik uses at present is incorrect, caused by a defect introduced by a previous change in a base font type.
What does this mean?
Currently, we convert using 13 as a base when we should be using 14. This results in the font size being slightly larger than the one set by the user.
The current scaling ratio is 1/13 * 14 =~ 1.077.
As an example:
The default theme Horizon, currently set to a 16-pixel default size, is in reality using 17.23 pixels.
Why are font sizes being changed?
Since we use other technologies to embed charts, we don’t want to replicate this error across all interfaces just to get matching title sizes. This means that we’ll now fix this defect, and start using the correct font size.
When will font sizes be changed?
The fix is planned for Qlik Cloud on April 22nd 2024.
Qlik Sense Enterprise on Windows will receive the fix in its May 2024 release.
How exactly will this affect me?
After the fix is deployed, the text in titles, subtitles and footnotes will appear smaller (about 93% of the current size), reverting to the intended size set by the user or the theme developer.
Since this will free up a small amount of space inside each object area, charts and graphics will become slightly bigger.
In rare scenarios, the resulting expansion might result in a different look for charts, where certain features (like labels or legends) appear, move or disappear due to the reaching of specific visual breakpoints.
What do I need to do to benefit from this change?
No action is required for Qlik Cloud users. This change will automatically be applied to all the dashboards at the time of deployment. Qlik Sense Enterprise on Windows users will need to see their platform being upgraded to May 2024.
Can I preview the changes?
A preview is not possible before the deployment on April 22nd.
We're available for questions if needed! As always, thank you for choosing Qlik,
Qlik Support -
Connector Factory - February & March 2024 releases
Over the past two months, Connector Factory has released more capabilities and connectors for data integration, data analytics and application automation. -
Predictive AI – Continued Innovation in AutoML
As noted in Qlik’s 2024 industry trends – Hybrid AI Bridges the Maturity Gap, it’s critical to take a portfolio approach to AI – one that leverages both generative and predictive AI to solve a full breadth of problems. According to the Boston Consulting Group, generative AI is only expected to achieve ~30% share of the overall AI market by 2024. So in two year's time traditional machine learning will still represent the majority of the AI marke... Show MoreAs noted in Qlik’s 2024 industry trends – Hybrid AI Bridges the Maturity Gap, it’s critical to take a portfolio approach to AI – one that leverages both generative and predictive AI to solve a full breadth of problems. According to the Boston Consulting Group, generative AI is only expected to achieve ~30% share of the overall AI market by 2024. So in two year's time traditional machine learning will still represent the majority of the AI market. And there’s a reason for this – because traditional ML delivers highly actionable, accurate predictions for specific use-cases that can drive improved outcomes across your business and tremendous value.
-
Get to know the Engine API with Qixplorer
For those of us who want to go beyond the out-of-the-box capabilities of Qlik Sense and want to leverage the full potential of the platform to create complex visualizations or satisfy custom development needs, understanding the Engine API is fundamental to taking advantage of what Qlik Sense hides under the hood.The Qlik Engine API is a websocket protocol that uses JSON RPC 2.0 to communicate between the Qlik Associative Engine and clients. It wo... Show MoreFor those of us who want to go beyond the out-of-the-box capabilities of Qlik Sense and want to leverage the full potential of the platform to create complex visualizations or satisfy custom development needs, understanding the Engine API is fundamental to taking advantage of what Qlik Sense hides under the hood.
The Qlik Engine API is a websocket protocol that uses JSON RPC 2.0 to communicate between the Qlik Associative Engine and clients. It works independently of any platform and programming language as long as it supports WebSockets and can parse JSON.
A great place to get your feet wet with trying out the Engine API is through Qixplorer (You might remember this as the Engine API Explorer on Qlik Managed). The tool that you can access at https://qixplorer.qlik.dev features a newly reimagined user interface and additional updates for a better experience.
Right off the bat, you can see that the format is divided into 4 main sections:
- Left: This is where you configure your connection to the tenant, pick the app, and browse through methods made available for your selected object.
- Middle: This is where you can see your requests and responses
- Bottom: This area is where you can construct and modify your requests and execute them
- Right: This is a neat feature that shows you inline documentation as you explore API methods
Other settings include a Light/Dark mode toggle at the top left, as well as a Layout toggle that lets you switch between the Original Layout (side by side request and response sections) or, my favorite, the Chat Layout.
How to use Qixplorer?
The first thing you would need to create a new connection to your Qlik Cloud tenant is a Web Integration ID. You can grab that by going to your tenant’s Management Console, under Web, Create a new integration and add https://qixplorer.qlik.dev as an origin.
Once you have the generated ID in hand, create a new connection on Qixplorer as shown below:
The next step is to choose the app you want to connect to from the second dropdown.
Once you select that, you will see that a first request and response have been made automatically. That’s the “OpenDoc” method, it is responsible for opening an app. More about it here.
Notice that a few items are now highlighted on the Left panel that you can start using - including the Doc and Global classes that can be expanded to reveal all the methods you can execute. You can also use the pre-defined Macros to list sheets, dimensions etc...
⚠️Before we continue, keep in mind that when using Qixplorer, you are performing changes directly on your apps, so when executing API methods to update or delete within Qixplorer, it will affect the objects in your apps.
Examples of using Qixplorer
- Using Macros to list sheets in our app
From the Macros dropdown, click on “ListSheets”.
Notice that the Request section at the bottom has our generated JSON with the methods needed to list sheets.
Click on Execute and view the JSON returned in the Response section.P.S: notice that two separate requests have been made by our Macro: CreateSessionObject and GetLayout.
- Using a method from Global
Let’s create an App in our tenant directly from Qixplorer.
First, select the “CreateApp” method from the Global dropdown.
Notice that the right panel has been populated with the inline documentation for our method. This makes it really convenient to view the definition and parameters at a glance.
Within the Request section that now contains the editable JSON, enter a name for the app we’re creating in the “qAppName” property.
Our request and response look like this:
{
  "handle": -1,
  "method": "CreateApp",
  "params": {
    "qLocale": "",
    "qLocalizedScriptMainSection": "",
    "qAppName": "test-qixplorer"
  }
}
You can check your tenant to view the newly created app:
- Using a method from Doc and GenericObject
Let’s retrieve the calculated data from a Table object in our app.
First, we need to get the object. Under ”Doc”, scroll down to GetObject and change the “qId” property to our Table's object id.
Now that we got the object, you can go to ”GenericObject”, then “Select Object” and click on table.
Next, scroll down to the “GetHyperCubeData” method under “GenericObject” and modify the JSON as follows to set the qHeight (number of rows to retrieve) and qWidth (number of columns)
{
  "handle": 2,
  "method": "GetHyperCubeData",
  "params": {
    "qPages": [
      {
        "qHeight": 1000,
        "qWidth": 5,
        "qTop": 0,
        "qLeft": 0
      }
    ],
    "qPath": "/qHyperCubeDef"
  }
}
Click on execute and examine the response:
The Engine API is without a doubt very powerful as it exposes methods that can be used to tap directly into the associative engine and manipulate complex data structures. Having a tool like Qixplorer is a great way to try out the API and learn more about all the methods available in a single place.
Let me know in the comments how you use Qixplorer on you end!
-
Qlik Cloud 日本リージョンへの移行方法
ついに Qlik Cloud 日本リージョンがオープンしました!既に Qlik Cloud をご利用のユーザー様向けに、日本リージョンへの移行方法をご説明します。 この記事は下記の記事を基にしています。 How to move a Qlik Sense SaaS Tenant to a different Region
-
March Qlik Digest
One of the most requested features in Qlik Cloud Analytics is finally here: Tabular Reporting in Qlik Cloud Analytics! -
Welcome back Nassir Ibrahim -Qlik Educator Ambassador for 2024!
This year we welcome back Nassir Ibrahim for his third year as an Educator Ambassador! -
OAuth, OAuth, my kingdom for OAuth!
Qlik Replicate recently added OAuth authorization protocol support with Snowflake. In the November SR release of Qlik Replicate, we expanded our OAuth support methods to Databricks endpoints. This is paving the way for supporting more endpoints with the OAuth protocol in the future. Read on to learn more! -
Qlik Sense February 2024 (Client-Managed) now available!
We are happy to announce the next version of our client-managed analytics offering, Qlik Sense February 2024. This version includes improvements primarily focused on new visualizations, formatting and functionality, additional SaaS connectors, and scripting improvements. -
Job-Sell
Job-SellSoevaa test sales app, using Figma to create a background.DiscoveriesA simple way to use a variable within the set analysys.ImpactA simple and beautiful view of sales and YOY comparisonAudienceBest-selling products, shipped products, total discounts per month.Data and advanced analyticsSum( {<Produto={"=rank(Sum(ValorLiquido),4)<=2"}>} ValorLiquido) -
-
Welcome to our new Educator Ambassador, Dr. K Kalaiselvi!
We are excited to welcome our new Educator Ambassador for 2024, Dr. K Kalaiselvi from Kristu Jayanti College, Bangalore! She is an Associate Professor with over 15 years of academic experience in roles as a J2EE developer with the Ministry of Electronics and Information Technology ( MEIT), Government of India, and Singapore Telecommunications, Government of Singapore.


.png")

.png")