Unlock a world of possibilities! Login now and discover the exclusive benefits awaiting you.
Product Innovation
By reading the Product Innovation blog, you will learn about what's new across all of the products in our growing Qlik product portfolio.
Support Updates
The Support Updates blog delivers important and useful Qlik Support information about end-of-product support, new service releases, and general support topics.
Qlik Academic Program
This blog was created for professors and students using Qlik within academia.
Community News
Hear it from your Community Managers! The Community News blog provides updates about the Qlik Community Platform and other news and important announcements.
Qlik Digest
The Qlik Digest is your essential monthly low-down of the need-to-know product updates, events, and resources from Qlik.
Qlik Learning
The Qlik Learning blog offers information about the latest updates to our courses and programs, as well as insights from the Qlik Learning team.
Recent Blog Posts
-

-
-
Qlik Data Integration Client-Managed Releases in November 2023
November brings us to autumn/fall with darker winter nights approaching, and in some countries there will be bonfires and fireworks that can bring frights and bangs to many an excited crowd, against the cold, dark night air. This release of Qlik Replicate November 2023 helps to minimize the frights and keep the lights on to protect against the dark. Security is always top of mind for IT depts around the globe, and this release sees some serious e... Show MoreNovember brings us to autumn/fall with darker winter nights approaching, and in some countries there will be bonfires and fireworks that can bring frights and bangs to many an excited crowd, against the cold, dark night air.
This release of Qlik Replicate November 2023 helps to minimize the frights and keep the lights on to protect against the dark. Security is always top of mind for IT depts around the globe, and this release sees some serious enhancements across endpoints. -
Techspert Talks - Using Kafka with Qlik Replicate
Hi everyone, Want to stay a step ahead of important Qlik support issues? Then sign up for our monthly webinar series where you can get first-hand insights from Qlik experts. The Techspert Talks session from November looked at Using Kafka with Qlik Replicate. But wait, what is it exactly?Techspert Talks is a free webinar held on a monthly basis, where you can hear directly from Qlik Techsperts on topics that are relevant to Customers and Partners ... Show MoreHi everyone,
Want to stay a step ahead of important Qlik support issues? Then sign up for our monthly webinar series where you can get first-hand insights from Qlik experts.
The Techspert Talks session from November looked at Using Kafka with Qlik Replicate.But wait, what is it exactly?
Techspert Talks is a free webinar held on a monthly basis, where you can hear directly from Qlik Techsperts on topics that are relevant to Customers and Partners today.In this session, we will cover:
- How Replicate works with Kafka
- Kafka terminology
- Configuration best practices
Click on this link to see the presentation

-
Situational Awareness
Situational AwarenessQlikThe application focuses on the 17 high threat diplomatic missions, based on the State Department's directorate within the Diplomatic Security Service (DSS). The application analyzes data from multiple sources, including data from the Global Terrorism Database and the Department of State website, to provide the user a complete picture on situational awareness.DiscoveriesThe #1 category of weapons used by terrorists are exp... Show MoreSituational AwarenessQlik The application focuses on the 17 high threat diplomatic missions, based on the State Department's directorate within the Diplomatic Security Service (DSS). The application analyzes data from multiple sources, including data from the Global Terrorism Database and the Department of State website, to provide the user a complete picture on situational awareness.
Discoveries
The #1 category of weapons used by terrorists are explosives. Also, the vast majority of terrorist incidents are not linked to any terrorist group.
Impact
The app helps enabled diplomats to gain a better understanding of terrorist activities within their respective regions across the globe.
Audience
It could be used by Department of State, or any government entity.
Data and advanced analytics
It allows for an easy and fast way to do in-depth analysis on terrorism.

-
Apple Health App
Apple Health AppClimber UKThis is an app which I developed for the purpose of analysing my health data on a daily basis taken from my Apple Watch and Apple Health App. Here I can look at my calories, step count, and look at routes of my daily exercise.DiscoveriesI discovered that only certain sports such as running are most beneficial for me with burning calories. ImpactThe impact of this app has made me go out on a daily basis for exercise, to k... Show MoreApple Health AppClimber UKThis is an app which I developed for the purpose of analysing my health data on a daily basis taken from my Apple Watch and Apple Health App. Here I can look at my calories, step count, and look at routes of my daily exercise.Discoveries
I discovered that only certain sports such as running are most beneficial for me with burning calories.
Impact
The impact of this app has made me go out on a daily basis for exercise, to keep up my interest in analysing my health data
Audience
this is a social app, so it's audience can be anyone who is interested in their health statistics.
Data and advanced analytics
This doesn't have any advanced analytics involved. It does use REST APIs to load the data in however.
-
Qlik Gears Up for Hybrid and Multi-Cloud Data Integration
Qlik Cloud Data Integration enables users to build automated data pipelines with an intuitive visual interface to ingest, transform, and deliver analytics-ready data. Several major capabilities have been added in the November 7th, 2023 release to strengthen Qlik Cloud for enterprise hybrid and multi-cloud data integration. -
Feature Updates
New features are always being added to Qlik Sense. Today I will provide an update on three topics I have blogged about this year. The topics are: NL Insights Straight table Filter pane NL Insights The NL Insights object, which use to be found in the Dashboard bundle, is now a standard chart object. It now “fully supports the Qlik Cloud UI in multiple languages, accessibility requirements, and reporting / exporting.” The functionality of the NL ... Show MoreNew features are always being added to Qlik Sense. Today I will provide an update on three topics I have blogged about this year. The topics are:
NL Insights
The NL Insights object, which use to be found in the Dashboard bundle, is now a standard chart object. It now “fully supports the Qlik Cloud UI in multiple languages, accessibility requirements, and reporting / exporting.” The functionality of the NL Insights object has also been updated so that it is easier to add insights for the visualizations in an app by allowing developers to simply select a chart they would like interpreted. Once a NL Insight object is added to a sheet, the developer can click on the Add chart button to see a list of objects that are on the current sheet. Natural language insights will be shown for the selected visualization. This is easier for the developer and removes the need to manually select dimensions and measures.
Filter Pane
At its basis, the filter pane provides a list box that the user can use to make selections. By default, when a user makes a selection in a filter pane, the selection toolbar pops up prompting the user to confirm the selection, as seen in the image below.
It is now possible to turn off the selection toolbar and immediately confirm the selection when it is made. This can be done in the properties window by unchecking the Show selection toolbar checkbox. This is useful if the filter pane is displayed as a grid, versus column, and the filter pane is being used as a button bar.
Note that when the selection toolbar is off, users can still access the select all, select alternative and select excluded options via the sheet toolbar.
Straight Table
The straight table can now be downloaded as an image or multi-page PDF up to 50 pages. Simply right-click on the straight table, select Download and click on Image or PDF.There are always new features being added to Qlik Cloud. Use Qlik Help to stay up to date or subscribe to the news feed.
Thanks,
Jennell
-
Self-Service Reporting Now Available in Qlik Sense SaaS (Updated)
We are pleased to announce our first scheduled reporting capability in Qlik Sense SaaS, now also inclusive of a distributed reporting capability -
Autumn term is well under way in the UK!
The past couple of weeks have been packed full of guest lectures and hands on sessions for students eager to learn about Qlik Sense and the Academic Program! -
Sheet Actions
I am always learning something new when it comes to Qlik products. This week, while working with a colleague, I learned about the sheet action “select values matching search criteria” that I had never used before, so I decided to blog about it. I have used sheet actions in the past to clear selections or to select a bookmark when navigating to a sheet, but this sheet action performs a search to make selections. My colleague needed to make a serie... Show MoreI am always learning something new when it comes to Qlik products. This week, while working with a colleague, I learned about the sheet action “select values matching search criteria” that I had never used before, so I decided to blog about it. I have used sheet actions in the past to clear selections or to select a bookmark when navigating to a sheet, but this sheet action performs a search to make selections. My colleague needed to make a series of selections to include and exclude data based on specific criteria. Using this sheet action, he was able to execute a complex expression to make selections on a sheet saving the users time when they navigate to that sheet.
Up to five actions can be added and they will run in the order they are listed. Sheet actions can be added from the Properties panel of a sheet. In this example, I have 3 actions.
Quantity > 100 action
Babywear action
Year action
In the first action, I am selecting quantities greater than 100. Notice in the Quantity > 100 action that single quotes are required when using an expression for the search criteria. It is possible for an action to deselect a previous action. For example, the first action selects 110, 120, 130 and 150 from the Quantity field. Then, in the second action, Babywear is selected from the CategoryName field, deselecting 110, 130 and 150 from the Quantity field. The last action selects 2021 from the Year field which deselects Babywear. So once all the actions are performed, these are the selections made.
Here is a list of all the sheet actions that are available:
- Apply bookmark – Apply an existing bookmark when navigating to a sheet.
- Clear all selections – Clear all selections when navigating to a sheet.
- Clear selections in other fields – Clear all selections from all fields except the one specified.
- Move forwards in your selections – Move one step forward in selection history.
- Move backwards in your selections – Move one step backwards in your selection history.
- Clear selections in field – Clear all selections from a specified field.
- Lock all selections – Lock all selections in the app.
- Unlock all selections – Unlock all selection in the app.
- Unlock a specific field – Unlock selections in a specified field.
- Select all values in a field – Select all values in a specified field.
- Select values in a field – Select value(s) in a specified field.
- Select values matching search criteria – Select values that match specified search criteria.
- Select alternatives – Select alternative values in a specified field.
- Select excluded – Selected excluded values in a specified field.
- Select possible values in a field – Select possible values in a specified field.
- Toggle field selection – Set a button to toggle between current selections and a selection that adds selections defined by a search string.
- Set variable value – Assign a value to a variable.
Most of these are very straightforward but you can find more details on sheet actions in Qlik Help. Some important things to note:
- You cannot set an action based on the results of another action because they are all evaluated before they are performed.
- Sheet actions will not be triggered if the sheet is used in a mashup or an embedded sheet.
- Some of these actions give you the option to override locked selections. See Qlik Help for list.
- You cannot use fields with date, timestamp, or money data type.
With the “select values matching search criteria” sheet action, you can use an expression or simply a value to search for and make selections in a specified field. This can be useful if you have a sheet in your app designed to perform a specific analysis that requires some selections to be made to begin. Using an action makes it easier for the user to get started and leaves little room for error by forgetting to make needed selections. I love that I am always learning something new with Qlik. Try out sheet actions in your app to automatically apply selections.
Thanks,
Jennell
-
Get More Control with New Macros in Qlik Cloud Data Integration
Cloud Data Integration (QCDI) provides powerful capabilities for building automated and scalable data pipelines. One of the key benefits is incremental processing, which only processes changed data rather than the full data set on each run. This improves efficiency, especially for large datasets. While core QCDI for landing, storing, or performing basic transformations are automatically incremental, custom SQL queries fully reprocess all data by ... Show MoreCloud Data Integration (QCDI) provides powerful capabilities for building automated and scalable data pipelines. One of the key benefits is incremental processing, which only processes changed data rather than the full data set on each run. This improves efficiency, especially for large datasets.
While core QCDI for landing, storing, or performing basic transformations are automatically incremental, custom SQL queries fully reprocess all data by default. With complex logic, this repetitive processing could become inefficient.
That’s why we’re excited to announce new Macro capabilities that give you more control over incremental processing in custom SQL pipelines. Now you can easily specify different logic to run during initial loads vs incremental updates.
-
Join Me Next Week November 1st 10AM ET - for Set Analysis Redux on the next Do M...
You don’t want to miss it.
-
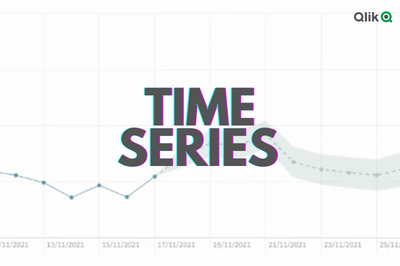
Time Series Analysis in Qlik Sense
What is Time Series Analysis? Time series analysis helps us understand and learn about the changes in our data over time. It involves collecting data points at consistent intervals over a set period of time, and using statistical methods to identify trends, patterns, and relationships in the data. Time series analysis can also be used for forecasting future data based on historical trends and patterns as we will see later in this post. Qlik Dem... Show MoreWhat is Time Series Analysis?
Time series analysis helps us understand and learn about the changes in our data over time. It involves collecting data points at consistent intervals over a set period of time, and using statistical methods to identify trends, patterns, and relationships in the data.
Time series analysis can also be used for forecasting future data based on historical trends and patterns as we will see later in this post.
Qlik Demo showing UK Crime trends: Explore demo here
Where can it be used?
Time series is used in a variety of industries, including finance, economics, retail, and meteorology, to help understand trends/patterns or make predictions and forecasts based on historical data, or simply to develop insights into how things change over time.
For instance Retailers can use time series data in a number of ways to support their decision making and improve business performance, including:
- Sales forecasting to project sales trends in the future and predict demand, plan for inventory, and optimize supply chain to avoid overstocking or shortages.
- Customer behavior analysis to understand how their customers’ habits change over time and identify spending habits and purchasing patterns which can help optimize marketing targeting efforts.
- Pricing analysis to understand how prices change over time affect sales and customer behavior.
- Inventory management to identify demand for specific products.
Ways to visualize Time Series data:
When it comes to looking at time-based data, we usually tend to use a Line Chart as it offers a simple and quick way to view changes related to a measure (Y-axis) over the course of time (X-axis).
Avg Temp over time comparison between 3 countries
Other charts however can help visualize the information better, here are some examples:
- A heatmap chart as seen on Github’s commit history shows a darker colored squares when more commits are made during a day and lighter color for less commits allowing us to easily notice the more productive days.
- A simple slope chart can be used when the time interval is limited and we want to see direct transitions over time, for instance comparing total sales data by industry between two years. Check out my other post to learn more about how this slope chart was created using Qlik's open source libraries.
Time Series Forecasting in Qlik Sense
Time series forecasting allows us to predict where a particular metric is going to be in the future based on historical data.
Qlik Sense makes it easy to do this on the Line chart.
Let’s build a chart with forecast that looks at average temperatures in the US (The QVF for this example is downloadable at the end of the post)
- Create a filter pane and select United States to limit data to one country.
- Create a Line Chart using:
- Dimension: MonthYear
- Measure: Sum(AverageTemperature)
- Expand the Measure field and turn ON the “Forecast” setting
- Move to the Dimension field and you can see that 2 new settings have appeared:
- Forecast steps: the number of data points to be forecasted (we choose 12). Keep in mind that the further we go out in time, the broader the confidence becomes due to the increased uncertainty.
- Step size: the granularity of the forecast steps (we choose Month to forecast for the upcoming year)
- You can also change the method used for the forecast (SSA or OLS) and the appearance of the trend line
- Confidence level describes the probabilistic range of the forecast and can be adjusted from 0 to 1. If 0.9 is selected, that means that 90% of the time, we will be within the blue range.
Using Insight Advisor:
Qlik has recently added the “Trend with Forecast” analysis type to Insight advisor. You can simply use the suggested measure and dimension and generate the chart:
To learn more about time series forecasting, check out this help article.
Thank you!
-
Qlik Data Integration Newsletter - October 2023
Welcome to October's Qlik Data Integration newsletter. Each month, we cover one endpoint and share our top resources, best practices, release updates and upcoming webinars. Subscribe to the Qlik Data Integration topic to be notified of future editions! Index WebinarResource HighlightsReminder: Qlik Replicate November 2023 and FIPSKnowledgebase ArticleEndpoint Spotlight: SAPNew Issues ReportedTips!Best PracticeRelease UpdatesFixesUpcoming Enhanc... Show MoreWelcome to October's Qlik Data Integration newsletter. Each month, we cover one endpoint and share our top resources, best practices, release updates and upcoming webinars.
Subscribe to the Qlik Data Integration topic to be notified of future editions!
Index
- Webinar
- Resource Highlights
- Reminder: Qlik Replicate November 2023 and FIPS
- Knowledgebase Article
- Endpoint Spotlight: SAP
- New Issues Reported
- Tips!
- Best Practice
- Release Updates
- Fixes
- Upcoming Enhancements
- Troubleshooting tips
- Analyze Qlik Replicate Logs
- Qlik Replicate End of Life Versions
Webinar
Book your calendar for the upcoming Q&A with Qlik: Qlik Replicate Sources and Targets Q&A session scheduled for October 24th (tomorrow!) at 10:00 AM EDT. It is a live Q&A session with a panel of Qlik experts. Bring your questions, and we do our best to answer them.
Resource Highlights
Reminder: Qlik Replicate November 2023 and FIPS
The November 2023 release of Qlik Replicate is not yet FIPS compliant. If you require a compliant environment, remain on the already FIPS compatible versions. See Qlik Replicate November 2023 and FIPS: Release not yet FIPS compliant for details.
Knowledgebase Article
Endpoint Spotlight: SAP
Find our latest knowledge base articles for SAP endpoints.
New Issues Reported
- Qlik Replicate: Replicating from SAP DB Source changing the precision on Currency Data Type to the Target
Currency data from SAP appears to replicate incorrectly when source values are compared to the target system. See Qlik Replicate: Replicating from SAP DB Source changing the precision on Currency Data Type to the Target for details.
- Qlik Replicate SAP Application (DB) Cluster Tables missing data in the Target
SAP Cluster Tables has missing data in the Target during CDC process. See Qlik Replicate SAP Application (DB) Cluster Tables missing data in the Target for details.
Tips!
- Qlik Replicate Trigger SAP HANA conversion from Version 1 to Version 2 or Version 3
The Qlik Replicate SAP HANA source endpoint allows you to convert to using the log table with CDC changes. This article documents how to convert the existing triggers into Version 2 or CTS Mode Version 3. See Qlik Replicate Trigger SAP HANA conversion from Version 1 to Version 2 or Version 3 for details.
Contact Qlik Support if you plan to convert your triggers, as additional migration steps may be needed to avoid data loss.
Best Practice
- Qlik Replicate SAP HANA Trigger Base using SAP Application (DB) as the Source
Qlik Replicate can now use SAP HANA as the Backend Database, which you can define on the SAP Application (DB) Source Endpoint setting with Triggers in SAP HANA.
Release Updates
Fixes
Qlik Replicate May 2023 Patch 3
(Build 2023.5.413)Jira issue: RECOB-7506
Type: Issue
Component/Process: SAP Application (DB)
Description: When the last batch contained operations on clustered tables, some changes would sometimes not be captured after detach/attach or stop/resume.Jira issue: RECOB-7477
Type: Issue
Component/Process: SAP Extractor Source
Description: An ABORT of a delta extractor job during change capture would result in a table being suspended, instead of a recoverable error.Jira issue: RECOB-7456
Type: Issue
Component/Process: SAP ODP
Description: When unloading failed, it would be reported as completed instead of failed.Jira issue: RECOB-7440
Type: Enhancement
Component/Process: SAP ODP
Description: Added support for CDS views that have mandatory parameters.Jira issue: RECOB-7414
Type: Issue
Component/Process: SAP Extractor Source
Description: Import of the Transport to a SAP Application Server would fail due to vulnerability issues.Jira issue: RECOB-7415
Type: Issue
Component/Process: SAP ODP
Description: When Current Data mode was enabled, Full Load would not replicate any records and the following error would occur during CDC: java.lang.String incompatible with java.math.BigDecimalQlik Replicate May 2023 Patch 2
(Build 2023.5.322)Jira issue: RECOB-6976
Type: Enhancement
Component/Process: SAP HANA Source (Trigger CTS mode)
Description: Added support for a configurable sleep interval after an empty Trigger Table session.Jira issue: RECOB-7390
Type: Issue
Component/Process: SAP Extractor Source
Description: When Extractor unload job failed or was canceled on the SAP side, the extractor status would be changed to Completed instead of Suspended.Jira issue: RECOB-7323
Type: Issue
Component/Process: SAP Extractor Source
Description: When a specific Extractor Full Load was aborted, the next Full Load would replicate the data retrieved by the aborted Extractor Full Load.Jira issue: RECOB-7348
Type: Issue
Component/Process: SAP Application (DB)
Description: SAP Pool table numeric values less than 0.1 would be replicated incorrectly.Jira issue: RECOB-7334
Type: Issue
Component/Process: SAP ODP Source
Description: Scheduler log messages would show an incorrect data set name and wrongly formatted time.Jira issue: RECOB-7262
Type: Issue
Component/Process: SAP ODP Source
Description: Data conversion problems would result in task failure or incorrect data replication.Jira issue: RECOB-7158, RECOB-6925
Type: Issue
Component/Process: SAP Extractor Source
Description: This resolves the following issues:- DELTA per table would only start after all Full Loads completed
- Reloading a table would prevent all DELTAs
- An error in a table during Full Load would prevent DELTAs from scheduling
Jira issue: RECOB-7308
Type: Issue
Component/Process: SAP HANA Source (Trigger mode)
Description: After applying a transport for maintenance to ACDOCA all CDC INSERT and UPDATE activity would be replicated as DELETEs.Upcoming Enhancements
Qlik Replicate November 2023 IR
- Expose stream buffer tuning parameters in task settings (Replicate & QEM - Expose stream buffer tuning parameters in task settings )
- Confluent Schema Register using BOTH authentication methods (Public Key + Username & password)
- Snowflake - Support Transactions in Upsert Mode
- Boolean Data Type support for PG sources and Bit support for SQL Server targets
- Google BigQuery - Secure current authentication (no longer have credential files on customer file system)
- Aurora PostgreSQL source - without the "superuser" role certification
- Azure Database for MySQL Flexible Server - Source & Target Certification
- MariaDB 10.6 to 10.11 versions on MySQL - certification
- MariaDB 10.6 version on Amazon RDS - certification
- Google Cloud SQL for MSSQL Source endpoint
- Databricks 12.2 LTS Certification
- Databricks Serverless SQL warehouse certification
- SingleStore 8.X Target certification
Troubleshooting tips
Analyze Qlik Replicate Logs
An evergreen pair of articles helps you read and analyze Qlik Replicate log files:
How to analyze a Qlik Replicate log
List of the error types in Qlik ReplicateQlik Replicate End of Life Versions
Version Release Date End of Support Date Qlik Replicate May 2023 May 9, 2023 May 9, 2025 Qlik Replicate November 2022 November 8, 2022 November 8, 2024 Qlik Replicate May 2022 May 10, 2022 May 10, 2024 Qlik Replicate November 2021 November 8, 2021 November 8, 2023 Qlik Replicate May 2021 May 11, 2021 May 11, 2023 Qlik Replicate November 2020 November 10, 2020 November 30, 2022 Qlik Replicate April 2020 (6.6) April 16, 2020 April 30, 2022 Qlik Replicate 6.5 November 14, 2019 November 30, 2021 Qlik Replicate 6.4 April 1, 2019 April 14, 2021 Qlik Replicate 5.5 August 1, 2017 November 30, 2020 For more information, see Qlik Product Lifecycles.
-
Qlik Digest - October 2023
Welcome to the October edition of Qlik Digest. This month we are celebrating 30 years of Qlik! We recognize that our success is not just measured in numbers, it’s a testament to the remarkable individuals who have been part of this journey – our dedicated employees, loyal customers, and committed partners. Thank you! Together we have made a difference in the lives on 40,000 customers across more than 100 countries. Join us in sharing stories abou... Show MoreWelcome to the October edition of Qlik Digest. This month we are celebrating 30 years of Qlik! We recognize that our success is not just measured in numbers, it’s a testament to the remarkable individuals who have been part of this journey – our dedicated employees, loyal customers, and committed partners. Thank you! Together we have made a difference in the lives on 40,000 customers across more than 100 countries.Join us in sharing stories about Qlik’s history on LinkedIn, X (Twitter), and YouTube in the comments of Qlik’s 30-Year Journey. Cheers to the next 30 years! #Qlik30Years
-
Flexible Circular Gauge Demo
Flexible Circular Gauge Demo AnyChart Go beyond the native capabilities for KPI visualization. Explore all major features of the Circular Gauge Extension for Qlik Sense in this demo app. Discoveries Explore all major features while checking out various custom gauges suitable for diverse use cases. See multiple options for pointers, shapes, angles, sizes, and much more demonstrated in action. Impact Advanced circular gauges for Ql... Show MoreFlexible Circular Gauge DemoAnyChartGo beyond the native capabilities for KPI visualization. Explore all major features of the Circular Gauge Extension for Qlik Sense in this demo app.Discoveries
Explore all major features while checking out various custom gauges suitable for diverse use cases. See multiple options for pointers, shapes, angles, sizes, and much more demonstrated in action.
Impact
Advanced circular gauges for Qlik Sense are capable of representing more than only a single measure value and providing more context.
Audience
Visualizers and analysts seeking to create customized and dynamic circular gauges within their Qlik Sense apps.
Data and advanced analytics
This application features Circular Gauges built with AnyChart's extension for Qlik Sense, utilizing fictional data to illustrate its capabilities.
-
Join a session with a Qlik Instructor exploring Qlik Sense topics!
Join us for the remaining live instructor sessions on #QlikSense topics and learn from an expert instructor!
-
Qlik Cloud Enhances Data Encryption with Customer Managed Keys
Qlik Cloud’s customer managed encryption keys offers a valuable layer of security and control and fulfills stringent compliance requirements like HIPAA. -
AI-Enhanced Features to Transform your Business - Do More with Qlik Episode 46
Insight Advisor – our intelligent AI-assistant supports a variety of advanced insight generation and automation experiences including search driven insights, conversational analytics, and analysis types – our unique framework for choosing a type of advanced analysis and generating visualizations, NLG, and even smart sheets. You’ll get a look at key driver analysis, to uncover the factors driving a selected metric. And you’ll get a deeper dive int... Show MoreInsight Advisor – our intelligent AI-assistant supports a variety of advanced insight generation and automation experiences including search driven insights, conversational analytics, and analysis types – our unique framework for choosing a type of advanced analysis and generating visualizations, NLG, and even smart sheets. You’ll get a look at key driver analysis, to uncover the factors driving a selected metric. And you’ll get a deeper dive into how you can customize insight generation and natural language processing through our business logic layer.