Unlock a world of possibilities! Login now and discover the exclusive benefits awaiting you.
Product Innovation
By reading the Product Innovation blog, you will learn about what's new across all of the products in our growing Qlik product portfolio.
Support Updates
The Support Updates blog delivers important and useful Qlik Support information about end-of-product support, new service releases, and general support topics.
Qlik Academic Program
This blog was created for professors and students using Qlik within academia.
Community News
Hear it from your Community Managers! The Community News blog provides updates about the Qlik Community Platform and other news and important announcements.
Qlik Digest
The Qlik Digest is your essential monthly low-down of the need-to-know product updates, events, and resources from Qlik.
Qlik Learning
The Qlik Learning blog offers information about the latest updates to our courses and programs, as well as insights from the Qlik Learning team.
Recent Blog Posts
-
Window関数
■はじめに Qlikロードスクリプトでデータテーブルに対して複雑な計算を実行し、データの粒度を失うことなく、異なるパーティションに対して集計を実行できるようになりました。集計テーブルを作ることなく、集計値を求めることができます。 ウィンドウ関数は、複数の行の値を使用して計算を実行し、各行の値を個別に生成します。ウィンドウ関数は、テーブル全体が読み取られた場合にのみ計算できます。 ■構文 Window関数の構文は次の通りです。 Window(入力数式, [パーティション1, パーティション2, ...], [ソートタイプ, [ソート式]],[フィルター式], [開始数式, 終了数式]) ■制限 Window関数関数の使用には下記の制限があります。 Windowはリソースを大量に消費する機能であり、特にメモリの消費量が大きくなります。 WindowはQlik Sense Mobileには対応していません。 チャート数式はWindowをサポートしていません。 Window関数を他... Show More■はじめに
Qlikロードスクリプトでデータテーブルに対して複雑な計算を実行し、データの粒度を失うことなく、異なるパーティションに対して集計を実行できるようになりました。集計テーブルを作ることなく、集計値を求めることができます。
ウィンドウ関数は、複数の行の値を使用して計算を実行し、各行の値を個別に生成します。ウィンドウ関数は、テーブル全体が読み取られた場合にのみ計算できます。
■構文
Window関数の構文は次の通りです。
Window(入力数式, [パーティション1, パーティション2, ...], [ソートタイプ, [ソート式]],[フィルター式], [開始数式, 終了数式])
■制限
Window関数関数の使用には下記の制限があります。
- Windowはリソースを大量に消費する機能であり、特にメモリの消費量が大きくなります。
- WindowはQlik Sense Mobileには対応していません。
- チャート数式はWindowをサポートしていません。
- Window関数を他のWindow関数内にネストすることはできません。
- Windowは集計関数内では使用できません。
- Windowはテーブル全体をスキャンできる必要があります。
- スライディングウィンドウ機能を使用する場合、WRank()、RecNo()、RowNo() は Window と一緒に使用できません。
■その他
Window関数の内部でのみ使用可能な Wrank もあります。
WRank() は、ロードスクリプトでテーブルの行を評価し、それぞれの行に対して、ロード スクリプトで評価された項目の値の相対位置を示します。この関数はテーブルの評価時に、結果を現在の列セグメントに含まれるその他の行の結果と比較して、セグメント内の現在の行のランキングを返します。
Qlik Tips で、デモを交えて詳しくご紹介しています。

-
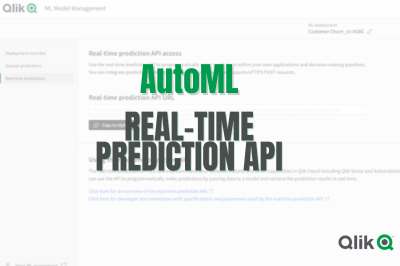
Exploring Qlik AutoML Real-time Predictions API
The ability to make data-driven decisions in real-time is a cornerstone for many businesses. Using Qlik AutoML's real-time prediction API let's you seamlessly integrate predictions on the fly in your web applications. In this guide, we will walk through the process of leveraging Qlik AutoML's real-time prediction capabilities using Node.js. Before using the API, we first need to create an ML experiment in Qlik cloud and deploy it. Creating the Au... Show MoreThe ability to make data-driven decisions in real-time is a cornerstone for many businesses. Using Qlik AutoML's real-time prediction API let's you seamlessly integrate predictions on the fly in your web applications.
In this guide, we will walk through the process of leveraging Qlik AutoML's real-time prediction capabilities using Node.js.
Before using the API, we first need to create an ML experiment in Qlik cloud and deploy it.
Creating the AutoML Experiment and deploying it
There are lots of help articles around this topic, but for our simple case, we will be using a Customer Churn dataset to train our model (You will find the file attached at the end of this post).
- Start by creating a new ML experiment from your Qlik cloud hub
- After uploading the Training file, select the “churned” column as the target to make our predictions. Make sure to de-select the “AdditionalFeatureSpend” and “DaysSinceLastService” columns if you want to follow along with this example.
The features (columns) selected in this step should later on match the schema of the input dataset we want to get real-time prediction on.
- Once we run the experiment to train the model, the best performing algorithm is automatically selected, you can now reconfigure a different version or simply press Deploy to create a new ML deployment, let’s do the latter.
- In the Deployment screen, you can run predictions on new apply datasets right in the hub, or in our case, we will use the Real-time prediction API to programmatically make predictions from our node.js app.
Creating the node.js app to make real-time predictions
Head to the Real-time predictions pane as shown above, this is where we will be able to grab the API URL.
To interact with the real-time prediction API, you'll require an API key from Qlik Cloud. Users with the 'Developer' role have the necessary privileges to generate this key. You can learn more about generating one here.
Setting up the Environment
Begin by initializing a Node.js environment and installing the necessary packages, run:
npm init -ythen
npm install axios dotenv fsAPI Configuration
In the .env file, define the Real-time prediction API URL and the API Key:
API_KEY=eyJhb....
API_URL=https://....
Next, create an index.js file and include the following:
Data prep:
We read from the csv file using fs and format the data to align with the real-time prediction API's requirements
const axios = require('axios');
const fs = require('fs');

require('dotenv').config();

const api_url = process.env.API_URL;
const api_key = process.env.API_KEY;

const rawData = fs.readFileSync('./customer-churn-apply-subset.csv', 'utf8');
const rows = rawData.split('\n').slice(1).filter(line => line.trim() !== '').map(row => {
    const [
        AccountID, Territory, Country, DeviceType, Promotion, HasRenewed, PlanType,
        BaseFee, NumberOfPenalties, CurrentPeriodUsage, PriorPeriodUsage, ServiceRating,
        ServiceTickets, StartMonth, StartWeek, CustomerTenure, Churned
    ] = row.split(',');

    return {
        "AccountID": AccountID,
        "Territory": Territory,
        "Country": Country,
        "DeviceType": DeviceType,
        "Promotion": Promotion,
        "HasRenewed": HasRenewed,
        "PlanType": PlanType,
        "BaseFee": parseFloat(BaseFee),
        "NumberOfPenalties": parseInt(NumberOfPenalties, 10),
        "CurrentPeriodUsage": parseFloat(CurrentPeriodUsage),
        "PriorPeriodUsage": parseFloat(PriorPeriodUsage),
        "ServiceRating": parseFloat(ServiceRating),
        "ServiceTickets": parseInt(ServiceTickets, 10),
        "StartMonth": StartMonth,
        "StartWeek": StartWeek,
        "CustomerTenure": parseFloat(CustomerTenure),
    };
});

const formattedRows = rows.map(record => [
    record.AccountID,
    record.Territory,
    record.Country,
    record.DeviceType,
    record.Promotion,
    record.HasRenewed,
    record.PlanType,
    record.BaseFee,
    record.NumberOfPenalties,
    record.CurrentPeriodUsage,
    record.PriorPeriodUsage,
    record.ServiceRating,
    record.ServiceTickets,
    record.StartMonth,
    record.StartWeek,
    record.CustomerTenure
]);
Crafting the API Request:
here, we define the headers and body content for the POST request to the API.
Notice that the schema matches the features we used to train our model.const json_data = { "rows": formattedRows, "schema": [ {"name": "AccountID"}, {"name": "Territory"}, {"name": "Country"}, {"name": "DeviceType"}, {"name": "Promotion"}, {"name": "HasRenewed"}, {"name": "PlanType"}, {"name": "BaseFee"}, {"name": "NumberOfPenalties"}, {"name": "CurrentPeriodUsage"}, {"name": "PriorPeriodUsage"}, {"name": "ServiceRating"}, {"name": "ServiceTickets"}, {"name": "StartMonth"}, {"name": "StartWeek"}, {"name": "CustomerTenure"}, ] }; const headers = { 'Authorization': `Bearer ${api_key}`, 'Content-type': 'application/json', 'Accept': 'text/json', };Sending the Request & Handling Response
We utilize axios to transmit the data and receive real-time prediction results (you can use any http client for this)
axios.post(
    api_url,
    json_data,
    {
        headers: headers,
    })
    .then(response => {
        console.log(response.data);
    })
    .catch(error => {
        console.error("Error:", error);
    });
Now you can run the node app:
node index.jsThe result we get are the predictions of the Customer Churn for our apply dataset with the second column representing whether the customer is predicted to Churn or not, 3rd column is the probability of Churned_no, and the 4th column is the probability of Churned_yes.
We can compare these results to the ones we get on the hub if we were to create predictions there:
With Qlik AutoML's real-time prediction API at your fingertips, you’re now ready to integrate real-time predictions into your web apps whether it’s to enrich your visualizations or build interactive what-if scenarios, you can easily make impactful real-time decisions.
API docs: https://qlik.dev/apis/rest/automl-real-time-predictions
You can find the full code and dataset files used below.
-
Kicking off the new term with a Qlik Sense Workshop
The Qlik Academic Program kicks off it's peak period in EMEA with two sessions. -
IMDb Top 1000 Movies
IMDb Top 1000 Movies AnyChart — Extensions for QS Using a decomposition tree, dig into the top 1000 movies of all time and their box office according to IMDb, an online database claiming to be the world's most popular source for movie content. Discoveries This app lets you identify the top actors and quickly learn which directors, genres, years, and individual films contributed the most to their success. Switch these dimensions as you... Show MoreIMDb Top 1000 MoviesAnyChart — Extensions for QS Using a decomposition tree, dig into the top 1000 movies of all time and their box office according to IMDb, an online database claiming to be the world's most popular source for movie content.
Discoveries
This app lets you identify the top actors and quickly learn which directors, genres, years, and individual films contributed the most to their success. Switch these dimensions as you like to view and explore the breakdown in the desired way.
Impact
A decomposition tree delivers a granular view of the top movies' box office, splitting the data into multiple dimensions (actors, directors, etc.) for an intuitive ad hoc exploration, enabling root cause analysis.
Audience
Box office analysts in the movie exhibition and distribution industry, film professionals, and others interested in the performance of movies. Also, all who want to see a real-world use case for a decomposition tree.
Data and advanced analytics
The app has been built using the Decomposition Tree extension for Qlik Sense released in January 2023. The data comes from the IMDb Top 1000 Movies dataset on Kaggle.
-
Notice of change in Qlik Cloud recovery login behavior
Hello Qlik Users, Beginning October 10, 2023, access to the tenant recovery URL for tenants (https://<tenant name>.<region>.qlikcloud.com/login/recover) will be restricted to the Service Account Owner of the tenant. This update is performed on all Qlik Cloud tenants to handle circumstances in which the service account owner for a tenant was changed or will be changed. If you are using the recovery login URL to access your tenant regularly, we rec... Show MoreHello Qlik Users,
Beginning October 10, 2023, access to the tenant recovery URL for tenants (https://<tenant name>.<region>.qlikcloud.com/login/recover) will be restricted to the Service Account Owner of the tenant. This update is performed on all Qlik Cloud tenants to handle circumstances in which the service account owner for a tenant was changed or will be changed.
If you are using the recovery login URL to access your tenant regularly, we recommend you use the standard login URL for your tenant (https://<tenant name>.<region>.qlikcloud.com/login) instead. You cannot access the tenant through the recovery login after October 10, 2023.
Thank you for choosing Qlik,
Qlik Support -
Qlik Sense August 2023 (Client-Managed) now available!
We are happy to announce the next version of our client-managed analytics offering, Qlik Sense August 2023. This version is primarily focused on visualization improvements including a variety of new customization and styling options, and enhancements to navigation and design. Users will also appreciate new support of parquet files, providing storage savings and enhanced performance for large data sets. In this release, you will find the fol... Show MoreWe are happy to announce the next version of our client-managed analytics offering, Qlik Sense August 2023. This version is primarily focused on visualization improvements including a variety of new customization and styling options, and enhancements to navigation and design. Users will also appreciate new support of parquet files, providing storage savings and enhanced performance for large data sets.
In this release, you will find the following new capabilities, many of which are already available in Qlik Cloud today:
-
【11/13(月)- 15(水)開催】Gartner IT Symposium/Xpo™ 2023
Qlik は、「Gartner IT Symposium/Xpo™ 2023」に、講演およびブース出展します。 Qlik は、最近の Talend 社との統合により、企業のデータ統合・データ品質・分析ソリューションを支援する、リアルタイムデータ・人工知能(AI)・機械学習(ML)・自動化などの最先端のテクノロジーを備えた業界をリードする製品ポートフォリオを提供します。 データとアナリティクスのリーダーが一堂に会する最大級の IT イベントに、ぜひご参加ください。Qlik 講演および Qlik ブースで、皆さまをお待ちしております。 詳細を見る【開催概要】日時:2023年 11月 13日(月)– 15日(水)会場:グランドプリンスホテル新高輪 国際館パミール 〒108-8612 東京都港区高輪3-13-1 詳細を見る -
-
Activity trackers and Analytics
The challengeGarmin have a great website, full of nice visualisations of activity and a mobile app where you can view tracked activity data.That's great, right up to the point you want to compare two activities, here it falls down. Other than seeing high level stats side by side, you cant.The solutionBuild my own analytics tool to allow me to compare not only statistical data, speed, stroke rate, distance, etc.. but look at the actual GPS trace o... Show MoreThe challenge
Garmin have a great website, full of nice visualisations of activity and a mobile app where you can view tracked activity data.
That's great, right up to the point you want to compare two activities, here it falls down. Other than seeing high level stats side by side, you cant.The solution
Build my own analytics tool to allow me to compare not only statistical data, speed, stroke rate, distance, etc.. but look at the actual GPS trace of the route.
Using a 'free' desktop version of the platform we have adopted to form the front end to our Insights platform, Qlik Sense and activity data downloaded from Garmin Connect I wanted to see how I could visualise the data and build something which gave me what I wanted.
Read more detail here on my blog: www.Analyticsandthings.com
-
Access Evaluator - Monitoring App for Qlik Cloud
The Access Evaluator is a comprehensive dashboard to analyze user roles, access, and permissions across a Qlik Sense tenant. -
Stacked Waterfall Chart Demo
Stacked Waterfall Chart Demo AnyChart — QS Extensions Discover the Stacked Waterfall Chart option! Stacked waterfalls are invaluable for visualizing cumulative data changes, simplifying the analysis of how values accumulate or deduct not only by categories but, notably, also by subcategories visualized as stacked sub-bars. They provide a clear view of data trends, aiding informed decision-making by highlighting the impact of these changes. ... Show MoreStacked Waterfall Chart DemoAnyChart — QS ExtensionsDiscover the Stacked Waterfall Chart option! Stacked waterfalls are invaluable for visualizing cumulative data changes, simplifying the analysis of how values accumulate or deduct not only by categories but, notably, also by subcategories visualized as stacked sub-bars. They provide a clear view of data trends, aiding informed decision-making by highlighting the impact of these changes. Explore all major features of AnyChart's Advanced Waterfall Chart extension for Qlik Sense in this Qlik demo app.Discoveries
* Cumulative Data Analysis: Understand the cumulative effect of added and subtracted values, categorized by both main and subcategories.
* Explore Major Features: Dive into visualizing sub-bars within main bars, different data modes, customizable labels, and more.
Impact
* Enhanced Data Insights: Gain precise, granular insights into data trends.
* Improved Decision-Making: Make informed decisions by understanding data effects over categories and subcategories.
Audience
This app is designed for data analysts, business professionals, and anyone interested in exploring the capabilities of advanced waterfall charting within Qlik Sense.
Data and advanced analytics
The application showcases stacked waterfall charts built with AnyChart's Advanced Waterfall Chart extension for Qlik Sense using a fictional dataset, providing a practical demonstration their capabilities for data analysis.
-
Now Live: Qlik Sense SaaS Simplified Authoring – Analytics Creation for Everyone
We are excited to announce the release of Simplified Authoring, a new Qlik Sense SaaS creation interface that surfaces frequently-used components, so you can easily build beautiful and sophisticated charts and visualizations. Particularly helpful for new and less-experienced users, this intuitive all-in-one experience offers a short learning curve, advanced filtering options, and the ability to explore your data as you perform analysis. This exte... Show MoreWe are excited to announce the release of Simplified Authoring, a new Qlik Sense SaaS creation interface that surfaces frequently-used components, so you can easily build beautiful and sophisticated charts and visualizations. Particularly helpful for new and less-experienced users, this intuitive all-in-one experience offers a short learning curve, advanced filtering options, and the ability to explore your data as you perform analysis. This extends governed self-service analytics to more users than ever across your organization and further reduces reliance on analysts and IT.
-
-
-
Connector Factory – September 2023 releases
This month, Connector Factory released more Qlik Cloud Analytics integration capabilities and some enhanced Qlik Application Automation connectors. -
Totals in Charts
The total in a chart is not the sum of the individual rows of the chart.Instead, the total and the subtotals are calculated using the expression – but on a larger subset of the data than for the individual row.Usually, the two methods result in the same numbers, but sometimes there is a huge difference. One example of this is if you use a non-linear function, e.g. Count(distinct …) as expression. The example below clearly shows this.The source da... Show MoreThe total in a chart is not the sum of the individual rows of the chart.
Instead, the total and the subtotals are calculated using the expression – but on a larger subset of the data than for the individual row.
Usually, the two methods result in the same numbers, but sometimes there is a huge difference. One example of this is if you use a non-linear function, e.g. Count(distinct …) as expression. The example below clearly shows this.
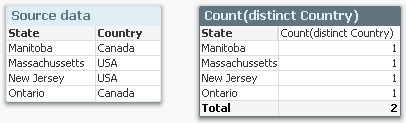
The source data to the left assigns a country to each state, and if you count the number of countries per state using a Count(distinct Country), you will get the chart to the right: Each state belongs to one country only, and the total number of countries is 2, also if the chart has four rows.
A second example is if you have a many-to-many relationship in the data. In the example below, you have three products, each with a sales amount. But since each product can belong to several product groups, the sales amounts per product group will not add up: The total will be smaller than the sum of the individual rows, since there is an overlap between the product groups. The summation will be made in the fact table.
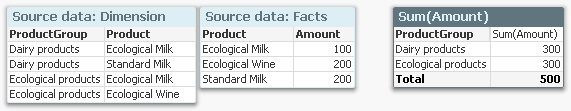
Another way to describe it would be to say that a specific dollar belongs to both product groups, and would be counted twice if you just summed the rows.
In both cases, QlikView will show the correct number, given the data. To sum the rows would be incorrect.
So, how does this affect you as an application developer?
Normally not very much. But it is good to be aware of it, and I would suggest the following:
- When you write your expression, you should have the total line in mind. Usually, the expression will automatically be right also for the individual rows.
- Always use an aggregation function. This will ensure that QlikView is able to calculate the total correctly.
- If you want an average on the total line, you should most likely divide your expression with Count(distinct <Dim>). Then it will work both for the individual rows (where the count is 1) and the total lines. Example
Sum( Amount ) / Count( distinct Customer )
- For cases where you want to show something completely different in the total line, you should consider the Dimensionality() function, that returns 0, 1, 2, … depending on whether the evaluation takes place in a total, subtotal or row. Example:
If( Dimensionality() = 0, <Total line expression>, <Individual line expression> )
But If I want to show the sum of the individual rows? I don’t want the expression to be calculated over a larger data set. What do I do then?
There are two ways to do this. First, you can use an Aggr() function as expression:
Sum( Aggr( <Original expression> , <Dimension> ) )
This will work in all objects. Further, if you have a straight table, you have a setting on the Expressions tab where you can specify the Total mode.
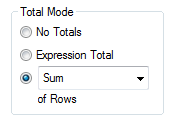
Setting this to Sum of Rows will change the chart behavior to show exactly this: The sum of the rows.

-
Engaging and fruitful visit to Hyderabad!
Last month, I had the opportunity to visit Hyderabad and meet some of the Academic Program Partner Universities there. Hyderabad, as a city in particular has been quite engaged towards the academic program. Its also where the first Centre of Excellence in Analytics of the Academic Program was set up in VJIT. This time around plan was to visit VJIT, Anurag University, NMIMS Hyderabad and BVRIT. After I landed at the airport, I headed straight t... Show MoreLast month, I had the opportunity to visit Hyderabad and meet some of the Academic Program Partner Universities there. Hyderabad, as a city in particular has been quite engaged towards the academic program. Its also where the first Centre of Excellence in Analytics of the Academic Program was set up in VJIT.
This time around plan was to visit VJIT, Anurag University, NMIMS Hyderabad and BVRIT.
After I landed at the airport, I headed straight to VJIT and like I said, this is a special relationship on account of the fact that the first CoE was set up and also we've had hundreds of students registering into the academic program and getting qualified as Qlik Sense Business Analysts and Data Architects from here. I met with the educators who are active in teaching students data analytics and related subjects and thereafter, addressed over 100 students in an auditorium
Thereafter, I proceeded towards the campus of NMIMS which is one of top private universities in India with multiple campuses across the country, including Hyderabad. A very special reason to visit NMIMS was Dr. Siddhartha Ghosh with whom the association began when he was with VJIT and instrumental in setting up the CoE and is now the Director of the NMIMS campus. After meeting him, it was nice to address a student crowd of around 100 who are pursuing their MBA studies. Various initiatives were discussed and the immediate one was to conduct a small hands on session on Qlik Sense for the students which is being organised on October 2nd. .
On the next day, I visited Anurag University and the Educators along with members of the Data Analytics Club. The University had organised a session with students to encourage their participation into the academic program. The Data Analytics Club which comprises of student members is a wonderful initiative to support the exchange of ideas in analytics and foster this subject among students. It was nice to address a large gathering of students and talk about various developments in analytics and also about the free resources of the academic program.
Next was a visit to BVRIT which is an all girls Engineering Institution. With BVRIT, we' ve had a special engagement due to the fact that a couple of years back, few students were recruited from the campus by a Qlik Partner, Diagonal. These students had completed the Qlik Sense Business Analyst Qualification and basis that, they were hired by Diagonal. During this visit, I interacted with the Director and other Educators and addressed a group of students. Most of them were learning data analytics as a specialised subject in their course.
Overall, an engaging and fruitful visit to Hyderabad! Look forward to embarking on the various initiatives discussed.
To know more about the Qlik Academic Program, visit qlik.com/academicprogram
-
Qlik Data Integration Newsletter - September 2023
Welcome to September's Qlik Data Integration newsletter. Each month, we cover one endpoint and share our top resources, best practices, release updates and upcoming webinars. Subscribe to the Qlik Data Integration topic to be notified of future editions! Index WebinarResource HighlightsQlik Replicate November 2023 and FIPSKnowledgebase ArticleEndpoint Spotlight: DB2New Issues ReportedTips!Best PracticeRelease UpdatesFixesUpcoming EnhancementsTr... Show MoreWelcome to September's Qlik Data Integration newsletter. Each month, we cover one endpoint and share our top resources, best practices, release updates and upcoming webinars.
Subscribe to the Qlik Data Integration topic to be notified of future editions!
Index
- Webinar
- Resource Highlights
- Qlik Replicate November 2023 and FIPS
- Knowledgebase Article
- Endpoint Spotlight: DB2
- New Issues Reported
- Tips!
- Best Practice
- Release Updates
- Fixes
- Upcoming Enhancements
- Troubleshooting tips
- Analyze Qlik Replicate Logs
- Qlik Replicate End of Life Versions
Webinar
Book your calendar for the upcoming Q&A with Qlik: Qlik Replicate Sources and Targets Q&A session scheduled for October 24th at 10:00 AM EDT. It is a live Q&A session with a panel of Qlik experts. Bring your questions, and we do our best to answer them.
Resource Highlights
Qlik Replicate November 2023 and FIPS
The November 2023 release of Qlik Replicate is not yet FIPS compliant. If you require a compliant environment, remain on the already FIPS compatible versions. See Qlik Replicate November 2023 and FIPS: Release not yet FIPS compliant for details.
Knowledgebase Article
Endpoint Spotlight: DB2
Find our latest knowledge base articles for DB2 endpoints.
New Issues Reported
- Qlik Replicate and R4Z after upgrade to 2023.5 SP02: additional download required
The Qlik Replicate service pack 02 release for 2023.5 includes old R4Z installation files from the previous SP01 build.To upgrade the R4Z component, additional files need to be downloaded and installed. See Qlik Replicate and R4Z after upgrade to 2023.5 SP02: additional download required for details.
- SQL0551N The statement failed because the authorization ID does not have the required authorization or privilege to perform the operation.
Qlik Replicate with a DB2 z/OS source endpoint (using R4Z) displays authorization and privilege errors. See Qlik Replicate DB2 z/OS - [SOURCE_CAPTURE ]E: RetCode: SQL_ERROR SqlState: 42501 NativeError: -551 Message: [IBM][CLI Driver][DB2] SQL0551N for more information and how to resolve the issue.
Tips!
- R4Z Db2 mainframe install is completed but no Changes are coming through
Check that the Tables you wish to be performing CDC replication upon, have been "turned on" for capturing the changes from the DB2 z/OS Logs. See Qlik Replicate: R4Z DB2z No CDC coming through for details. - Qlik Replicate DB2 z/OS task may stop/fail with R4DB2: ALL CB ENTRIES ARE IN USE
This means that a task is trying to start, but the maximum number of R4Z Control Blocks (in the R4Z CDC service environment on the mainframe) is in use. Find the resolution in Qlik Replicate: DB2 z/OS R4Z [SOURCE_CAPTURE ]W: R4DB2: ALL CB ENTRIES ARE IN USE.
Best Practice
- Match R4Z and Qlik Replicate versions
The Qlik Replicate and R4Z versions you install must be part of the same release, which can either be an initial release or a patch/service release. This means that if you upgrade Qlik Replicate, you must also upgrade your R4Z installation (to the version that correlates with the Qlik Replicate release you are installing), unless it has the same build number as your currently installed R4Z. Note that despite being part of the same release, the Qlik Replicate and R4Z build numbers (reflected in their file names) might not be the same.
For example, Qlik Replicate May 2022 SR2 includes the following files:
- QlikReplicate_2022.5.0.499_X64.zip (the Replicate installer)
- QlikReplicate_2022.5.0.290_r4z.zip (the R4Z installer).
- How to avoid WLM tasks being cancelled due to Work Load Manager Policy settings
When installing and using the DB2 z/OS endpoint in Qlik Replicate, WLM tasks on the mainframe may get cancelled. There are multiple root causes for this, but a common one can be addressed by reviewing the execution priority (WLM settings).
See Qlik Replicate and R4Z: Best practice to ensure DB2 z/OS Workload Manager (WLM) tasks are not cancelled for details.
Release Updates
Fixes
Qlik Replicate May 2023 Patch 3
ID: RECOB-7408
Type: Issue
Component/Process: IBM DB2 for z/OS Source
Description: The capture process would not recover from a communication error in the metadata connection.ID: RECOB-7385
Type: Issue
Component/Process: IBM DB2 for z/OS Source
Description: The following ambiguous warning message would sometimes be issued when resuming a task:
Transaction <> was committed after the Full Load started and the BEGIN TRANSACTION statement was not captured.
ID: RECOB-7220
Type: Issue
Component/Process: DB2 z/OS Source
Description: DB2 would sometimes abend in a data sharing environment when tasks moved back and forth between LPARs.Qlik Replicate May 2023 Patch 2
ID: RECOB-7311
Type: Enhancement
Component/Process: IBM DB2 for z/OS Target
Description: Performance was improved when using the zload utility to load files.ID: RECOB-7146
Type: Issue
Component/Process: IBM DB2 for z/OS Target
Description: The task log would display the following incorrect warning when replicating from IBM DB2 on z/OS 13.1 (which is certified): Replicate has not been certified to work with DB2 z/OS version '13.01.0005', and therefore any issues you may encounter with this version are not covered by your license agreement.ID: RECOB-7114
Type: Issue
Component/Process: IBM DB2 for z/OS Target
Description: The R4Z DO4GRANT JCL was updated to grant the R4Z user permissions on the SYSIBM.SYSTABLEPART and SYSIBM.SYSPARMS tables.Upcoming Enhancements
Qlik Replicate November 2023 IR
- Expose stream buffer tuning parameters in task settings (Replicate & QEM - Expose stream buffer tuning parameters in task settings )
- Confluent Schema Register using BOTH authentication methods (Public Key + Username & password)
- Snowflake - Support Transactions in Upsert Mode
- Boolean Data Type support for PG sources and Bit support for SQL Server targets
- Google BigQuery - Secure current authentication (no longer have credential files on customer file system)
- Aurora PostgreSQL source - without the "superuser" role certification
- Azure Database for MySQL Flexible Server - Source & Target Certification
- MariaDB 10.6 to 10.11 versions on MySQL - certification
- MariaDB 10.6 version on Amazon RDS - certification
- Google Cloud SQL for MSSQL Source endpoint
- Databricks 12.2 LTS Certification
- Databricks Serverless SQL warehouse certification
Troubleshooting tips
Analyze Qlik Replicate Logs
An evergreen pair of articles helps you read and analyze Qlik Replicate log files:
How to analyze a Qlik Replicate log
List of the error types in Qlik ReplicateQlik Replicate End of Life Versions
Version Release Date End of Support Date Qlik Replicate May 2023 May 9, 2023 May 9, 2025 Qlik Replicate November 2022 November 8, 2022 November 8, 2024 Qlik Replicate May 2022 May 10, 2022 May 10, 2024 Qlik Replicate November 2021 November 8, 2021 November 8, 2023 Qlik Replicate May 2021 May 11, 2021 May 11, 2023 Qlik Replicate November 2020 November 10, 2020 November 30, 2022 Qlik Replicate April 2020 (6.6) April 16, 2020 April 30, 2022 Qlik Replicate 6.5 November 14, 2019 November 30, 2021 Qlik Replicate 6.4 April 1, 2019 April 14, 2021 Qlik Replicate 5.5 August 1, 2017 November 30, 2020 For more information, see Qlik Product Lifecycles.
-
【オンデマンド配信】QlikWorld Tokyo オンライン
データ・分析・AI の最新トレンドを一挙ご紹介! 去る 9月 12日 、毎年恒例の一大イベント「QlikWorld Tokyo」が開催され、盛況のもとに終了しました。多数のデータ愛好家の方々にご来場いただき、データ・分析・AI の最新トレンドや成功例に関するインサイトなど、データの可能性を最大化するヒントをご紹介しました。この度、同イベントでの一部の講演を Web セミナーにてお届けいたします。Qlik のビジネスおよびテクノロジーの方向性と最新情報のほか、2 社の日本企業の事例をご紹介します。 ※参加費無料。パソコン・タブレット・スマートフォンで、どこからでもご視聴いただけます。 今すぐ視聴する 今すぐ視聴する -
"Dancin' in September" to share our latest Qlik Community Enhancements!
Read about the latest Qlik Community enhancements for the month of Septemer.