Unlock a world of possibilities! Login now and discover the exclusive benefits awaiting you.
Product Innovation
By reading the Product Innovation blog, you will learn about what's new across all of the products in our growing Qlik product portfolio.
Support Updates
The Support Updates blog delivers important and useful Qlik Support information about end-of-product support, new service releases, and general support topics.
Qlik Academic Program
This blog was created for professors and students using Qlik within academia.
Community News
Hear it from your Community Managers! The Community News blog provides updates about the Qlik Community Platform and other news and important announcements.
Qlik Digest
The Qlik Digest is your essential monthly low-down of the need-to-know product updates, events, and resources from Qlik.
Qlik Learning
The Qlik Learning blog offers information about the latest updates to our courses and programs, as well as insights from the Qlik Learning team.
Recent Blog Posts
-
Qlik Digest - September 2023
In this issue, we’re thrilled to introduce Qlik Staige, our all-encompassing AI solution that will help you bring better insights to your business, faster. Qlik Staige combines the technology, ecosystem, and expertise you need to harness the power of AI for data and analytics in a way that’s accurate, secure, and scalable. Read on to learn how Qlik Staige can enable you to drive transformative AI solutions today. Plus, don’t miss the latest updat... Show MoreIn this issue, we’re thrilled to introduce Qlik Staige, our all-encompassing AI solution that will help you bring better insights to your business, faster. Qlik Staige combines the technology, ecosystem, and expertise you need to harness the power of AI for data and analytics in a way that’s accurate, secure, and scalable. Read on to learn how Qlik Staige can enable you to drive transformative AI solutions today.
Plus, don’t miss the latest updates to our pricing model, and take advantage of your opportunity to provide feedback on how we can make Qlik Digest even more helpful.
-
What's the difference between conversational AI and generative AI?
With conversations around AI and its prevalence in news and media becoming much more commonplace, it can be helpful to have a good understanding of the two different types of AI. -
Slowly Changing Dimensions
As one creates QlikView applications one sometimes encounters a data modeling problem where a dimensional attribute varies over time. It could be that a salesperson changes department or a product is reclassified to belong to another class of products. This problem is called Slowly Changing Dimensions and is a challenge for any Business Intelligence tool. Creating an application with static dimensions is simple enough, but when a salesperson is... Show MoreAs one creates QlikView applications one sometimes encounters a data modeling problem where a dimensional attribute varies over time. It could be that a salesperson changes department or a product is reclassified to belong to another class of products.
This problem is called Slowly Changing Dimensions and is a challenge for any Business Intelligence tool. Creating an application with static dimensions is simple enough, but when a salesperson is transferred from one department to another, you will have to ask yourself how you want this change to be reflected in your application. Should you use the current department for all transactions? Or should you try to attribute each transaction to the proper department?
First of all, a changed attribute must be recorded in a way that the historical information is preserved. If the old value is overwritten by the new attribute value, there is of course nothing QlikView can do to save the situation:
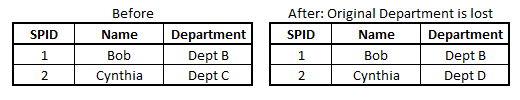
In such a case, the new attribute value will be used also for the old transactions and sales numbers will in some cases be attributed to the wrong department.
However, if the changes have been recorded in a way so that historical data persists, then QlikView can show the changes very well. Normally, historical data are stored by adding a new record in the database for each new situation, with a change date that defines the beginning of the validity period.
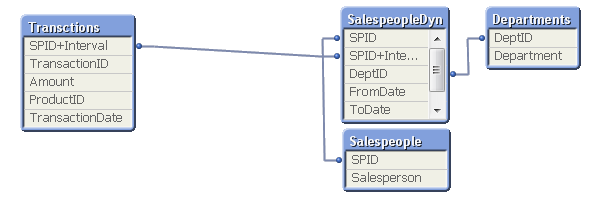
In the salesperson example, you may in such a case have four tables that need to be linked correctly: A transaction table, a dynamic salesperson dimension with the intervals and the corresponding departments, a static salesperson dimension and a department dimension. To link these tables, you need to match the transaction date against the intervals defined in the dynamic salesperson dimension.
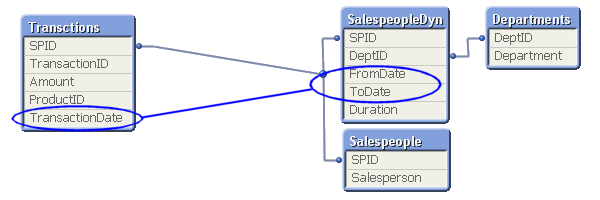
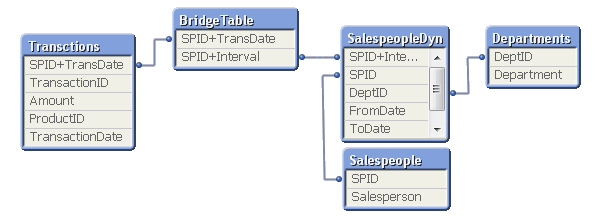
This is an intervalmatch. The solution is to create a bridge table between the transaction table and the dimension tables. And it should be the only link between them. This means that the link from the transaction table to the bridge table should be a composite key consisting of the salesperson ID (in the picture called SPID) and the transaction date.
It also means that the next link, the one from the bridge table to the dimension tables, should be a key that points to a specific salesperson interval, e.g. a composite key consisting of the salesperson ID and the beginning and end of the interval. Finally, the salesperson ID should only exist in the dimension tables and must hence be removed from the transaction table.
In most cases of slowly changing dimensions, a salesperson (or product, customer, etc.) can only belong to one department (or product group, region, etc.) at a time. In other words, the relationship between salesperson and interval is a many-to-one relationship. If so, you can store the interval key directly in the transaction table to simplify the data model, e.g. by joining the bridge table onto the transaction table.
A word of caution: If a salesperson belongs to several departments at the same time, such a join may cause QlikView to make incorrect calculations. Bottom line: Double-check before you join.
For a more elaborate description of Slowly Changing Dimensions and some script examples, see the technical brief IntervalMatch and Slowly Changing Dimensions.

-
【開催報告】QlikWorld Tokyo 2023
9月12日に QlikWorld Tokyo が開催され、300名を超える方にご参加いただきました。当日は最新の Qlik & Talend ソリューションをご確認いただくと同時に、ユーザー同士の交流も活発に行われました。その模様をお届けします。 -
Gantt Charts for Project Management
Gantt Charts for Project Management AnyChart — QS Extensions Gantt charts are an essential project management tool. Explore all major features of AnyChart's Gantt Chart Extension for Qlik Sense in this Qlik demo application, including different data structures, customizable tables and timelines, flexible milestones, dependency connectors, fiscal year settings, coloring patterns, and much more demonstrated in action. Discoveries Stream... Show MoreGantt Charts for Project ManagementAnyChart — QS Extensions Gantt charts are an essential project management tool. Explore all major features of AnyChart's Gantt Chart Extension for Qlik Sense in this Qlik demo application, including different data structures, customizable tables and timelines, flexible milestones, dependency connectors, fiscal year settings, coloring patterns, and much more demonstrated in action.
Discoveries
Streamline your project management with insightful start-to-finish timelines. Plan, schedule, and keep projects on track and within your budget.
Impact
Track progress across stages to spot bottlenecks and optimize workflows. Identify task dependencies and key milestones to prioritize effectively.
Audience
Project managers, team leaders, and anyone involved in project planning and management. Anyone interested in exploring the capabilities of Gantt charts within Qlik Sense.
Data and advanced analytics
This application features Gantt charts built with AnyChart's Gantt Chart Extension for Qlik Sense, utilizing fictional data to illustrate its capabilities.
-
【開催報告】2023年 第2回 Qlik Japan ユーザーミートアップ - アプリ自慢大会!
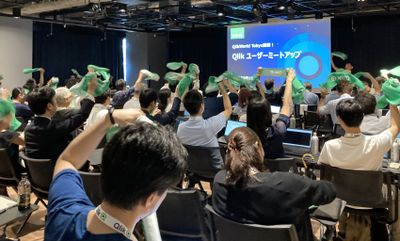
9月12日、Qlik Japanユーザーミートアップを実施しました。今回は、QlikWorld Tokyoとのジョイント・イベントという形でQlikWorld Tokyoと同日・同会場で実施されました。 2023年Qlik Japanユーザーグループは、ハンズオンやデータソン、もくもく会、ライブ配信など、様々な形でユーザーイベントを実施してきましたが、今回のユーザーミートアップは2月に実施して参加者に大変好評だった「アプリ自慢大会」をメインコンテンツとしてお送りしました。 会場受付では、今回のミートアップ限定の「Qlikタオル」が配られました。冒頭の写真でも確認できますが、要所でタオルを掲げて盛り上がりました! ■イベントスタート! 司会進行を務めた学研の渕さんから全体のアジェンダについてご紹介があり、続いてOGIコンサルティングオフィス荻本さんに開会のご挨拶をいただきました。 (学研 渕さんによる司会進行。渕さんはユーザー会幹事でもあります!) そして、セガの萬さんからQli... Show More9月12日、Qlik Japanユーザーミートアップを実施しました。今回は、QlikWorld Tokyoとのジョイント・イベントという形でQlikWorld Tokyoと同日・同会場で実施されました。
2023年Qlik Japanユーザーグループは、ハンズオンやデータソン、もくもく会、ライブ配信など、様々な形でユーザーイベントを実施してきましたが、今回のユーザーミートアップは2月に実施して参加者に大変好評だった「アプリ自慢大会」をメインコンテンツとしてお送りしました。
会場受付では、今回のミートアップ限定の「Qlikタオル」が配られました。冒頭の写真でも確認できますが、要所でタオルを掲げて盛り上がりました!
■イベントスタート!
司会進行を務めた学研の渕さんから全体のアジェンダについてご紹介があり、続いてOGIコンサルティングオフィス荻本さんに開会のご挨拶をいただきました。
(学研 渕さんによる司会進行。渕さんはユーザー会幹事でもあります!)
そして、セガの萬さんからQlikルミナリーとQlikアドボケイトのプログラムについてご紹介がありました。Qlikルミナリーはグローバルで、Qlikアドボケイトは国内で、それぞれQlikに関する情報発信などをするいわばエヴァンジェリストのようなプログラムです。ルミナリー・アドボケイト限定のイベントや特典もございますのでご興味ある方はぜひQlikにご相談ください。
(セガ 萬さんはグローバルで50名、日本からわずか3名しか選ばれていないQlikルミナリーのひとりです!)
■アプリ自慢大会!
続いて、アプリ自慢大会が始まりました。こちらのコンセプトは、「完全非公開!リアルな本番アプリをご紹介!」です。撮影や内容のSNS投稿は禁止する代わりに、誰もが知っている大手企業が実際に社内で使っている、リアルなBIアプリケーションを披露しました!今回は、セガ、学研、スズキ、富士通の4社に登壇いただきました。
登壇の様子を少しだけシェアします。ですが、コンセプトにもある通り内容は参加してのお楽しみということになります。毎回ユーザー様にとってすごい刺激になる発表ばかりですので、今回参加できなかったQlikユーザーは、ぜひ次回のイベントにお越しください!
・株式会社セガ 萬様、福山様
・株式会社学研ホールディングス 福田様、横尾様
・スズキ株式会社 仲江川様
・富士通株式会社 池田様
お見せできないのが本当に残念!それくらい、各社のビジネスにおける重要かつリアルなアプリが公開されていました。私自身も大変勉強になりましたね~。
■お楽しみ企画「Qlik Quiz」
さて、アプリ自慢大会の後は、お楽しみ企画「Qlik Quiz」。このパートは、Qlikのウェビナーでおなじみ、鈴木と中嶋(私)がMCを担当しました。
「Qlikのことをもっとよく知ってもらおう」という趣旨でQlikに関する2択クイズを10問出題しました。間違えた時点で脱落というサバイバル方式で、最後まで勝ち残った10名の方にQlikWorld Tokyo限定のQlik Tシャツをプレゼントいたしました!問題は意外と難しかったようです😅😅😅
(解答選択肢に応じてタオルか手を上げてもらう、というシンプルな方式。ここでもQlikタオルが大活躍!)
■フィナーレ
最後に、お知らせのコーナー。
なんと、これまで英語でしか受験できなかったQlikの認定資格「Qlik Senseビジネスアナリスト」がついに日本語で受験できるようになりました!ここで、Qlikアドボケイトである富士通の中川さんより、「これを機にみんなでQlik資格を取りましょう!」というメッセージもいただきました。
最後に、次回のミートアップ予定が発表されました。次回は、12月に大忘年会と称して、一年を振り返る会を実施します。日付やアジェンダはTECH PLAYのQlik Japan User Groupページから改めてご案内します。(グループのフォローもよろしくお願いします!)
それでは、次回大忘年会でお会いしましょう!
-
Inventario/ facturacion
Inventario/ facturacionRCDmuestra el inventario y facturacion emitida de terrenos Discoveriesla facturacion que no se emite en tiempoImpactun incremento en cobranza y emision de facturasAudienceGenrentes y personal de CxCData and advanced analyticspara el departamento tener en una sola vista todo el reporte y poder revisar el saldo por cliente en especifico -
Become a Data Leader!
Register for Applied Data Analytics using Qlik Sense Course and become a data expert!
-
Do you have what it takes to be a Qlik Academic Program Educator Ambassador?
Apply to become an Educator Ambassador today! -
The Generic Load
There are a number of prefixes in QlikView, that help you load and transform data. One of them is the Generic prefix.
-
Connector Factory – August 2023 Releases
This month, Connector Factory released more Qlik Cloud Data Integration and Qlik Application Automation connectors. -
End of Perpetual License Sales
Please read this important announcement from our Chief Marketing Officer regarding the End of Perpetual License Sales.
-
WoWizer Data Access Auditor
WoWizer Data Access Auditor Wowizer Qlik Sense offers a comprehensive approach to granting role-based access through streams, apps, sheets, and row and column-based section access. However, there is currently no way to verify what the user is seeing in real time, aside from asking them to share their screen. As a result, when a user experiences an issue, the Qlik champion is required to reset their access. Discoveries Access control a... Show MoreWoWizer Data Access AuditorWowizerQlik Sense offers a comprehensive approach to granting role-based access through streams, apps, sheets, and row and column-based section access. However, there is currently no way to verify what the user is seeing in real time, aside from asking them to share their screen. As a result, when a user experiences an issue, the Qlik champion is required to reset their access.Discoveries
Access control and Governance is at the heart of any Enterprise BI software such as Qlik. Several times granular access control is the real deal breaker in the decision-making of software choice.
For example, ensuring that only the Sales Team can see the Revenue sheet,
The sales reps can see just their own sales numbers,
Sales managers can see for their team and Region heads can see for their region is critical.
Impact
WoWizer DAA empowers organizations to embrace proactive access validation and compliance within their Qlik deployments. Leveraging its cutting-edge capabilities, Wowizer DAA addresses the limitations of the existing system and brings a host of benefits to the table.
Audience
Developers, business leaders, and regulatory authorities alike can all find common ground in the value that Wowizer DAA brings to the table. Secure, compliant, and confident that's the new standard that Wowizer DAA sets for Qlik dashboard auditing.
Data and advanced analytics
Business leaders must ensure that development teams comprehend the requirements and deploy them correctly.
In large organizations with multiple hierarchies, there may be ambiguity regarding which rule will take precedence.
Qlik champions face challenges in verifying that what they have implemented is accurate and has been deployed in production.
Data Protection Officers require testing evidence to comply with regulations such as GDPR.
🔑 Explore Wowizer Data Access Auditor and enhance your data security today! Get started with a FREE and visit the official website for more information.
Demo
YouTube: Dive into Wowizer DAA
Website: WoWizer.com 🔗
Data Access Auditor FREE: Free Download 🆓
Github Page: https://wowizer.github.io/DAA 📚
-
Qlik Data Integration Newsletter - August 2023
Welcome to August's Qlik Data Integration newsletter. Each month, we cover one endpoint and share our top resources, best practices, release updates and upcoming webinars. Subscribe to the Qlik Data Integration topic to be notified of future editions! Index Resource HighlightsReminder! Qlik Replicate Endpoint RetirementKnowledgebase ArticleEndpoint Spotlight: DatabricksNew Issues ReportedTips!Release UpdatesFixesUpcoming EnhancementsTroubleshoo... Show MoreWelcome to August's Qlik Data Integration newsletter. Each month, we cover one endpoint and share our top resources, best practices, release updates and upcoming webinars.
Subscribe to the Qlik Data Integration topic to be notified of future editions!
Index
- Resource Highlights
- Reminder! Qlik Replicate Endpoint Retirement
- Knowledgebase Article
- Endpoint Spotlight: Databricks
- New Issues Reported
- Tips!
- Release Updates
- Fixes
- Upcoming Enhancements
- Troubleshooting tips
- Analyze Qlik Replicate Logs
- Qlik Data Integration Product End of Life Versions
Resource Highlights
Reminder! Qlik Replicate Endpoint Retirement
As of July 31st, 2023, the following endpoints have been retired:
Source Endpoints:
- HP Non-Stop Source
- Open VMS RMS Source
- Hadoop Source
Target Endpoints:
- MapR Target
- MapR Streams Target
- MS APS PDW Target
- SAP Sybase IQ Target
- HP Vertica Target
- Actian Vector Target
- Netezza Target
- Pivotal Greenplum Target
See Retirement for Specific Qlik Replicate Endpoints for details.
Knowledgebase Article
Endpoint Spotlight: Databricks
Find our latest knowledge base articles for Databrick endpoints.
New Issues Reported
- Error SSL_connect: wrong version number when using Databricks Lakehouse (Delta) as target
- Performing operations in transactions apply mode is not supported with Databricks Lakehouse (Delta) as target
- The Apply Changes replication mode supports tables with a Primary Key only. For solutions see Qlik Replicate with Databricks Lakehouse (Delta) as target: Performing operations in transactions apply mode is not supported in log.
- Table is failing on full load when loading into Microsoft Azure Databricks Delta Target
- Qlik Replicate Server crashes when browsing databases in Microsoft Azure Databricks Target
- Clicking Browse in the database endpoint settings of a Microsoft Azure Databricks target crashes the Qlik Replicate server. Find the resolution in Qlik Replicate Server crashes when browsing databases in Microsoft Azure Databricks Target.
Tips!
- Qlik Replicate and Databrick Unity Catalog feature flag support
- Qlik Replicate added support for Databricks Unity Catalog using feature flag from 2022.11 SP02. See Qlik Replicate added support for Databricks Unity Catalog using feature flag from 2022.11 SP02 for details.
- Qlik Replicate: Databricks Operations per second is over the account limit
- Qlik Replicate tasks may fail with Operations per second is over the account limit errors. Find the resolution in Qlik Replicate: Databricks Operations per second is over the account limit.
- Best Practice: Qlik Replicate: Databricks Delta Wstring data type truncation
- Starting with Databricks Delta Driver version to 8.x and above, Varchar data type will be used for strings. Varchar data type is no longer limited by this character size so no truncation will occur when Wstring data type is used with limits higher than 255 characters.
Release Updates
Fixes
Qlik Replicate May 2023 patches
Component/Process: Databricks (Cloud Storage)
Description: When reconnecting after recoverable error on uploading file, the last file does not get uploaded, resulting in missing data.
Component/Process: Databricks Lakehouse (Delta)
Description: When using merge, if one of the columns in a Unique Index was NULL the changes would not be applied correctly. The issue was resolved using a Feature Flag at task and server level.
Upcoming Enhancements
Qlik Replicate August 2023 IR
- New Confluent Endpoint (based on Kafka)
- S3 authentication support with AWS IAM Roles Anywhere on S3/Redshift endpoints
- Ability to Set Isolation Level on ODBC with CDC (Ability to Set Isolation Level on ODBC with CDC)
Qlik Replicate November 2023 IR
- Expose stream buffer tuning parameters in task settings (Replicate & QEM - Expose stream buffer tuning parameters in task settings )
- Confluent Schema Register using BOTH authentication methods (Public Key + Username & password)
- Snowflake - Support Transactions in Upsert Mode
- Boolean Data Type support for PG sources and Bit support for SQL Server targets
- Google BigQuery - Secure current authentication (no longer have credential files on customer file system)
- Aurora PostgreSQL source - without the "superuser" role certification
- Azure Database for MySQL Flexible Server - Source & Target Certification
- MariaDB 10.6 to 10.11 versions on MySQL - certification
- MariaDB 10.6 version on Amazon RDS - certification
Troubleshooting tips
Analyze Qlik Replicate Logs
An evergreen pair of articles helps you read and analyze Qlik Replicate log files:
How to analyze a Qlik Replicate log
List of the error types in Qlik ReplicateQlik Data Integration Product End of Life Versions
Qlik Release Qlik Replicate / Enterprise Manager End of Support Date Qlik Compose End of Support Date February 2021 November 2020 SR1 November 2022 February 2021 February 2023 May 2021 May 2021 May 2023 May 2021 May 2023 August 2021 May 2021 SR1 May 2023 August 2021 August 2023 November 2021 November 2021 November 2023 November 2021 November 2023 For more information, see Qlik Product Lifecycles.
-
Working with the Qlik REST Connector, Pagination and Multiple JSON Schemas
Recently, I worked with a Qlik Community member to help them understand the Qlik REST Connector with Qlik Sense and QlikView. At first it appeared simple, but then he soon realized he needed to understand a bit more about how the data came back (the response), what the pagination settings were (pages of data used to retrieve more rows) and finally how to link (join, associate) other attributes that came back from the results of multiple REST API ... Show More Recently, I worked with a Qlik Community member to help them understand the Qlik REST Connector with Qlik Sense and QlikView. At first it appeared simple, but then he soon realized he needed to understand a bit more about how the data came back (the response), what the pagination settings were (pages of data used to retrieve more rows) and finally how to link (join, associate) other attributes that came back from the results of multiple REST API endpoints / resources. We got it all working and the results were pleasing. Needless to say were able to perform text analytics from a barrage of Facebook comments. However, as I finalized all this in my head, I wanted to share what I've learned but in the simplest way possible. So I decided to find a very simple, publicly available RESTful service API in which I can demonstrate my findings easily. The below video presents those findings in a educational and entertaining way using the Star Wars API. Yes, that is correct, I said the Star Wars API. As a bonus, stick to the end of the video to see the Media Box Extension in action.
See this video on YouTube as well. Using the Qlik REST Connector - Pagination and Multiple JSON Schemas - YouTube

Do you know of other simple and fun, publicly available RESTful services? Share them with the Qlik Community in the comments below.
Regards,
Michael Tarallo (@mtarallo) | Twitter
Qlik
Special shout out to: Paul Hallett (@phalt_) | Twitter - for creating an awesome resource http://swapi.co/about that allowed me to easily demonstrate the Qlik Sense REST Connector.
Resources used in this video:
- Qlik Sense Desktop: Free Data Visualization Tool | Qlik Sense Desktop
- https://www.swapi.co/ - Star Wars Rest API
- Endpoint People:
http://swapi.co/api/people/ - Endpoint Species:
http://swapi.co/api/species/ - Qlik Branch - Media Box Extension
- Star Wars REST API - Qlik Sense App (attached below)
- Qlik Sense - Introduction to Extensions (video)
Other Resources:
If using Qlik Sense Desktop please copy .qvf file to your C:\Users\<user profile>\Documents\Qlik\Sense\Apps and refresh Qlik Sense Desktop with F5. If using Qlik Sense Enterprise Server please import .qvf into your apps using the QMC - Qlik Management Console.
Disclaimer: Star Wars, the Star Wars logo, all names and pictures of Star Wars characters, vehicles and any other Star Wars related items are registered trademarks and/or copyrights of Lucasfilm Ltd., or their respective trademark and copyright holders.

-
Qlik Cloud Analytics brings Capacity Model Pricing
We are pleased to announce new capacity model pricing for Qlik Analytics. The new pricing model is an extension of the capacity functionality we introduced earlier this year for data integration. We believe this pricing model aligns with modern customer expectations and will: Provide more predictability as you plan deployments Make it easier to take advantage of available capabilities in Qlik Cloud Give more flexibility to organizations wan... Show MoreWe are pleased to announce new capacity model pricing for Qlik Analytics. The new pricing model is an extension of the capacity functionality we introduced earlier this year for data integration.
We believe this pricing model aligns with modern customer expectations and will:
- Provide more predictability as you plan deployments
- Make it easier to take advantage of available capabilities in Qlik Cloud
- Give more flexibility to organizations wanting to expand analytics usage
Today, we offer three capacity pricing tiers: Standard, Premium, and Enterprise.
You can find additional details on our website Qlik Cloud® Analytics Plans & Pricing
With the Qlik Cloud capacity model, the primary value meter is Data for Analysis or Data Moved, except for Qlik Cloud Analytics Standard where Full Users is the value meter.
See in detail what it means here: Subscription value meters
Additionally, we understand the importance of Qlik Cloud administrators to monitor their tenants' data consumption. Therefore, we are pleased to introduce:
- A monitoring dashboard
Located in the home pane of the Management Console, this overview provides a summary of user allocations, data capacity consumption, reports, and other capacity-based resources to understand your usage. - A specialized Qlik Sense Application
For more in-depth analysis, a detailed consumption report is delivered in a Qlik Sense Application allowing you to further understand how your organization uses Qlik Cloud.
For more information on how to deploy the report, please see our Qlik Help for details: Monitoring usage with detailed consumption reports.
Additional resources:
- Capacity Pricing and Usage Telemetry in Qlik Cloud available
- Qlik Cloud® Analytics Plans & Pricing
- Qlik Cloud Analytics specifications and capacity
- Subscription value meters
- Monitoring resource consumption
- Monitoring usage with detailed consumption reports
Thanks for choosing Qlik!
Qlik Global Support
-
The Crosstable Load
There are a number of prefixes in QlikView, that help you load and transform data. One of them is the Crosstable transformation.
-
HR ANALYTICS
Goal Achieved for Hr department: Employee Data Compiling Salary Information Employee Performance Details on any disciplinary action taken against an employee Smooth Reporting experience across dashboard Use Case: Target Area : Display’s important HR metrics using interactive visualizations. It helps the HR department to improve recruiting processes, optimize the workplace management as well as to review the overall employee performance as per ... Show MoreGoal Achieved for Hr department:
- Employee Data
- Compiling Salary Information
- Employee Performance
- Details on any disciplinary action taken against an employee
- Smooth Reporting experience across dashboard
Use Case:
Target Area :
- Display’s important HR metrics using interactive visualizations.
- It helps the HR department to improve recruiting processes, optimize the workplace management as well as to review the overall employee performance as per manager’s rating.
Requirement :
- Dashboard should be representation of key measures of human resource
- Employee achievements
- Productivity and other factors important to the organization
- Factors measured include hiring, performance management and employee attrition report
Solution & Benefits :
- In this dashboard we have showcased a basic dashboard with all employee details form their joining to performance/rating.
- HR Admin can add Employee who have applied for separation & can also retain the employee
- Custom extension is used to make the reports
- MIS report
- Performance / Rating report
- Input Form for adding data to database
Key KPI:
- Joinee/Separation Report
- Performance Report
- Employee Salary
- Employee Outgo
Highlight of this Application:
- Table/Report Extension
- Variance Bar Chart Extension
- Breadcrumb Extension
- Circular Gauge Extension
- Oval KPI Extension
- Image Color Fill Extension
- Custom Theme developed for this Application
- AdHoc report made using show/hide option in table object
-
A new look and feel is here!
Learn more about the August enhancments for Qlik Community. -
Focusing on Scatter Plots
An overview of scatter plots and how users can take apply them within their own apps.