Unlock a world of possibilities! Login now and discover the exclusive benefits awaiting you.
Analytics & AI
Forums for Qlik Analytic solutions. Ask questions, join discussions, find solutions, and access documentation and resources.
Data Integration & Quality
Forums for Qlik Data Integration solutions. Ask questions, join discussions, find solutions, and access documentation and resources
Explore Qlik Gallery
Qlik Gallery is meant to encourage Qlikkies everywhere to share their progress – from a first Qlik app – to a favorite Qlik app – and everything in-between.
Qlik Community
Get started on Qlik Community, find How-To documents, and join general non-product related discussions.
Qlik Resources
Direct links to other resources within the Qlik ecosystem. We suggest you bookmark this page.
Qlik Academic Program
Qlik gives qualified university students, educators, and researchers free Qlik software and resources to prepare students for the data-driven workplace.
Recent Blog Posts
-
No Code Transformation Workflows For Your Data Pipelines
No Code Transformation Workflows For Your Data Pipelines Data transformations and manipulations are usually the domain of experts in SQL, Python, or o... Show MoreNo Code Transformation Workflows For Your Data Pipelines
Data transformations and manipulations are usually the domain of experts in SQL, Python, or other programming languages. Because data transformations were hand-coded in past, developing them was a resource intensive undertaking. Moreover, once the transformations were implemented, they needed to be updated and maintained as business requirements changed and new data sources were added or modified. One of the goals of Data Integration solutions is to assist users in their quest to manage and transform data by removing barriers to this process. What if you could automate and build your transformation workflows with zero manual coding using a visual interface?
Transformation flows from Qlik Talend Cloud help bring advanced transformation capabilities to users of all levels. Transformation flow relies on a no-code graphical interface to guide the user on the data transformation.
The interface only requires knowledge of the data and the desired transformation output. As the user builds the transformation flows, the system generates the SQL code, optimized for the target platform, and displays the results for verification as one goes along.
The key to transformation flows “no-code” approach is the concept of configurable processors. These processors function as building blocks that take raw data from a source table or preceding processor as input and perform an operation to transform and produce data as output. A wide range of processors are available as part of the Qlik Talend Cloud including processors to aggregate, cleanse, filter, join and more (see below). Currently, all processors execute using a push-down ELT paradigm. That is to say the processors generate SQL instructions compatible with the target database platform or data warehouse for the project, then execute these instructions utilizing the compute and data present on the target Cloud platform – such as Snowflake, Databricks or others.
Getting Started with Transformation Flows
If you are already using Qlik Talend Cloud Data Pipelines, you can create transformation flows inside the transformation objects of data integration projects.
If you are new to Qlik Talend Cloud, or new to Qlik, contact your sales team to start a new project.
Let us look at a couple of examples for transformation flows in the context of customer data. First, we are going to filter and split customer data from SAP by geography. Then we are going to combine it with data from other systems to arrive at a consolidated customer list.
Filter and split example
The steps to filter and split customer data by location/ geo are as follows.
- On an existing transformation task, select the customer master (KNA1) and transformation flow.
- Fill in the details, name of the transformation and default output data set and optionally materialization settings. Materializing will store the results of the transformation flow as data as a physical table in the target database. Not materializing the transformation flow will store the transformation results as a view that is rendered on-demand by downstream data pipeline objects. In order for the transformation task to manage incremental loads using the incremental filter processor, materialization must be set to ON.
- Our default transformation appears as follows.
When you create a transformation flow, the Qlik Talend Cloud user interface will display the input data set(s) selected in the prior step and the output data set by default. The output dataset will have the name of the transformation, but the output dataset name can be changed by the transformation flow developer.
Quick tip: A tip for getting started with building a transformation flow is selecting the input data set and turning on the data preview. This will show the fields and data available to use in your transformation flow. Note the LAND1 field has the country of the customer.
- We then select the Filter processor and insert it between input and output.
- We then configure the filter to limit the customers data to US customers. and click Save. With our Split customers filter transformation select, we see the data preview at the bottom of the screen refreshed to rows matching the filter.
- Next, we configure an output for the non-matching records. The non-matching target will contain all the customers that are not US customers.
- Finally define a key for both data sets. Keys can be defined in the metadata of each object by clicking edit and choosing the columns. You can check that the dataset conforms to your defined keys by clicking the validate data button.
- Do not forget to click Save to exit and apply your changes.
- The completed transformation flow looks like this.
Combining data from multiple sources
Building upon the previous transformation, we will now combine the filtered SAP customer data with a different set of customers from an Oracle based system.
- Similar to the above step, select the two datasets to combine into a transformation flow. With Qlik Talend Cloud, it is easy to bring in and combine new data sets. You can automatically and continuously ingest data without job scheduling or scripting, just by dragging and dropping sources.
- The canvas is now drawn with the two input data sets and the output data set.
- We can then inspect both customer data sets by clicking on them and reviewing the preview pane.
- Notice that customer contact information appears readily combinable, addresses and telephone numbers have similar format. The customer names are different with the Oracle source having separate fields for first and last name and SAP having a single name field. For this example, we will standardize on a single field and use a concatenate processor on the Oracle source.
- We will then use a Select columns processor to select and order the columns of both data sets in preparation for the union.
- We will then use the union processor to combine the data sets.
- Well then add a UUID column to the combined data set to use as key.
- We will then configure the output with this key.
- Our transformation flow is now complete.
Conclusion
Transformation flows in Qlik Talend Cloud allows users without extensive data programing skill levels (SQL, Python, etc.) to easily and effectively transform their data for analytics. The graphical interface levels the playing field for implementation by abstracting data knowledge and design from syntactical language constructs and presenting them as configurable processors. Seemingly complex nuances like having the transformation flow process incremental changes or adding filters to reduce the set of data being processed can be handled by the product automatically. Simply enable the incremental load option and include the Incremental filter processor. But be aware, incremental loading is only available if the data set has been materialized. Making data transformations more accessible improves requirements communication, which can shorten data pipeline build times and make the pipelines easier to update when requirements evolve. Transformation flows are at the core of Qlik Talend Cloud’s transformation capabilities and available for use today.
Learn more about Qlik Talend Cloud
-
The Evolution of Insight Advisor – Continuing the path forward with Augmented An...
But in 2023, the arrival of ChatGPT and generative-AI changed the game. Qlik was quick to respond, but not in haste. We introduced a new AI new strat... Show MoreBut in 2023, the arrival of ChatGPT and generative-AI changed the game.
Qlik was quick to respond, but not in haste. We introduced a new AI new strategy coined Qlik Staige, which is comprised of three pillars – a trusted data foundation for AI, AI-enhanced analytics, and self-service AI solutions. The foundational aspect of our AI-enhanced analytics strategy is to take Insight Advisor to the next level, modernizing the architecture and language model to take advantage of the latest generative-AI capabilities. We are pleased to introduce the first step on that journey – LLM driven language generation.
Insight Advisor now features generative-AI driven language generation as a private preview feature, both in Insight Advisor Chat and in-app search experiences. Users will now get more "chat GPT like" answers when asking questions, with human sounding narrative for improved readability and a wider range of observations, summarizations, and additional insights. Qlik has partnered with Amazon Bedrock to utilize state of the art LLM technology, through a fully built-in solution that takes advantage of Qlik's security and governance. And of course, all analytical calculations are still generated by the trusted Qlik engine, with the LLM being utilized to enhance and improve output. Going forward, we will continue to modernize the language model in Insight Advisor, improving intent recognition and enhancing the overall capabilities and experience.
In addition, in the coming months we will be introducing automated authoring. Business analysts might be great at building visualizations, but it’s a time-consuming and complex process. Automated authoring is a new AI-driven creation experience that speeds and simplifies authoring in Qlik. With a wide variety of analysis types to choose from, you can now drag-and-drop AI-generated analyses directly onto your sheets, select applicable data from a list of suggestions, and let Qlik do the rest. In a few clicks you get a sophisticated analysis that would have taken far longer to build manually. This enables business analysts and authors who know what they want to gain efficiency, shorten time-to-value, and spend more of their effort actually analyzing the business.
Both of these exciting new features were demonstrated at our annual user conference, Qlik Connect, and received great feedback. The new LLM-driven language generation capability is now offered in private preview, and automated authoring will be generally available later this summer.
Stay tuned as we continue to lead the way in AI-powered analytics – lots more to come.
-
VJIT hosts a successful datathon
Vidya Jyothi Institute of Technology ( VJIT), a leading educational institution in Hyderabad and one of the close Qlik Academic Program partners, host... Show MoreVidya Jyothi Institute of Technology ( VJIT), a leading educational institution in Hyderabad and one of the close Qlik Academic Program partners, hosted a successful datathon recently.
Vidya Jyothi Institute of Technology was established in 1998 by Vidya Jyothi Educational Society created by a group of committed academicians and enterprising educationists. The institute offers many programs in engineering and is one the most recognized campuses in the State of Telangana in India. The first "Centre of Excellence in Analytics powered by Qlik" was started at VJIT and so far, many students have leveraged the academic program of Qlik along with qualifications and certifications.
In another step to build this relationship further, VJIT organised a datathon where more than 200 students participated in a Qlik only datathon event. The departments of IT, CSE, CSE- DS and AI participated. One of the distinct feature of this datathon was that all the student participants had completed the Qlik Sense Business Analyst Qualification.
Students were shared datasets and they created dashboards and presented them to the audience. The final selection of students was based on the quality of analysis using Qlik Sense, presentation and knowledge of the technology. In the end, five teams were shortlisted for the final round and three winners were declared.
For more information on the Qlik Academic Program free resources and many other engagement opportunities, visit qlik.com/academicprogram -
Santa's Challenge
Santa's ChallengeBildenThe purpose of this app is to showcase the customization and interactivity capabilities of Qlik Sense through a holiday-themed ... Show MoreSanta's ChallengeBilden The purpose of this app is to showcase the customization and interactivity capabilities of Qlik Sense through a holiday-themed simulation, where users assist Santa in optimizing his gift delivery route across Brazilian cities. The app displays a map-based route with time and weight constraints, showing how adjustments to delivery order and speed impact the journey time. It uses factors like population and distance to demonstrate real-time data processing and visualization. This app is designed for BI enthusiasts, Qlik users, and potential clients, offering an engaging way to explore Qlik Sense’s flexibility in building interactive experiences beyond standard dashboards. By providing a fun, hands-on example, the app illustrates how Qlik Sense can be a powerful tool not only for data insights but also for planning and operational simulations, adding value in fields that require dynamic decision-making and strategy testing.
Discoveries
Optimization of Route Order: Experimenting with different city sequences reveals that the order of stops significantly affects total travel time. Users discover that planning an efficient sequence can save valuable minutes, especially with a time constraint. Real-Time Decision Making: The app demonstrates how real-time adjustments, such as changing routes or redistributing speed points, impact overall performance, mirroring the decision-making process in real logistics scenarios.
Impact
The app demonstrates how Qlik Sense can be used beyond traditional analytics, enabling businesses to simulate and optimize complex logistical operations in real time. By providing insights into route efficiency and resource allocation, it can help companies streamline delivery processes, reduce costs, and improve overall operational efficiency.
Audience
This idea of app is designed for logistics managers, BI analysts, and operations teams who would use it to explore and refine delivery strategies.
Data and advanced analytics
The total time calculation provides valuable insights derived from the interplay of speed points and total weight on each route. In a real-world scenario, additional variables would come into play, but this app effectively demonstrates the foundational concept of leveraging data to optimize complex logistics operations.
-
【オンデマンド配信】AI 時代に求められるデータ連携機能とその役割
近年、AI 活用に向けたデータ基盤構築が重要視されるようになりました。さらに、ETL の近代化が求められ、データ連携ツールの選択に頭を抱えられる担当者の方も多くいらっしゃるのではないでしょうか。 本 Web セミナーでは、AI 時代に求められるデータ連携機能を徹底解説。自社のデータ戦略に沿ったデータ... Show More近年、AI 活用に向けたデータ基盤構築が重要視されるようになりました。さらに、ETL の近代化が求められ、データ連携ツールの選択に頭を抱えられる担当者の方も多くいらっしゃるのではないでしょうか。
本 Web セミナーでは、AI 時代に求められるデータ連携機能を徹底解説。自社のデータ戦略に沿ったデータ連携ツールを選定するためのポイントを、機能・コスト・データ信頼性などの観点からご説明します。信頼できる AI を設計するために必要な正しいデータ活用の姿や具体的な事例をご確認いただけます。
<こんな方にお勧め>- AI 活用に向けて情報収集中の方
- データ基盤構築をする際のボトルネックを理解しておきたい方
- データ連携製品の選定に課題を抱えている方
<本 Web セミナーで学べること>
- AI 時代に求められるデータ基盤構築のポイント
- ETL の近代化 - 先進的なデータ連携機能と選定観点
- 失敗しない AI およびデータ活用の姿と事例
※参加費無料。パソコン・タブレット・スマートフォンで、どこからでもご参加いただけます。
今すぐ視聴する -
Learn your way. Save your way!
Qlik offers a wide variety of courses and delivery methods to suit your learning needs. Take the training you need to achieve your learning goals with... Show MoreQlik offers a wide variety of courses and delivery methods to suit your learning needs. Take the training you need to achieve your learning goals with great promotions:
Looking to take a traditional, classroom training approach, where our expert instructor leads you through demonstrations and hands-on exercises? Attend instructor-led training virtually, available in different time zones and languages; or with a private session just for your team:
- 30% off Public training courses – Discount Code: Classroom30
- Try one of our newest courses:
- 25% off all Private Classroom training - Contact your Account Manager, Services Sales contact or e-mail us at education@qlik.com to receive a quote and schedule your training.
Purchase self-paced subscriptions to Qlik Continuous Classroom and Talend Academy where all the learning you need is right at your fingertips – anytime, anywhere, always.
- 20% off Qlik Continuous Classroom Individual & Unlimited subscriptions – Discount Code: Selfpaced20
- Business Analyst Individual Subscription
- Data Architect Individual Subscription
- Full Access Individual Subscription
- Full Access Unlimited Corporate Subscription
- 20% off Talend Academy Individual subscription - Discount Code: Selfpaced20
Discount is valid on purchases made by December 31, 2024.
- 30% off Public training courses – Discount Code: Classroom30
-
Seamless Public Data Sharing with Qlik's New Anonymous Access Capability
Introducing Qlik Anonymous Access. Here are a few ways it can help: Building Trust Through Transparency When organizations openly share data, they d... Show MoreIntroducing Qlik Anonymous Access. Here are a few ways it can help:
- Building Trust Through Transparency
When organizations openly share data, they demonstrate that they have nothing to hide. This transparency enhances customer trust, builds brand loyalty, and fosters a positive public image.
Example: Imagine you're a company committed to sustainability. By using Qlik Anonymous Access to publish a dashboard illustrating how your products are ethically sourced, you demonstrate your commitment and differentiate yourself in a crowded market.
- Data-Driven Marketing and Customer Insights
Sharing aggregated (and anonymous) data can position you as an industry leader. Your insights can attract new business partners and customers.
Example: Consider a marketing software company that regularly publishes reports on the latest digital marketing trends. By sharing these reports, they become a go-to resource in the field—boosting their sales pipeline.
What is Qlik Anonymous Access?
Qlik Anonymous Access is your no-login-required gateway for sharing data. It allows organizations to host dashboards, reports, and analytics for public use—whether through a web portal, an app, or directly embedded on a website. Best of all, the data is always up-to-date, thanks to automatic refreshes. No complicated logins, no hassle.
Key Benefits of Qlik Anonymous Access
- Improved User Experience:
Without the need for user accounts or authentication, anyone can engage with your data seamlessly. - Expanded Reach:
Your data can now reach a wider audience—including partners, clients, and even curious citizens—without the need for account management or password resets. - Increased App Value:
Third-party apps can embed your analytics directly, providing users with instant insights without the hassle of creating a login. - Scalability and Flexibility:
As a cloud-based capability, Qlik Anonymous Access allows you to scale to meet growing user demand. - Competitive Advantage:
Delivering a frictionless experience for users keeps them engaged and loyal—this level of convenience can set you apart from competitors.
Key Use Cases for Qlik Anonymous Access
Wondering how Qlik Anonymous Access can work for your organization? Here are some impactful use cases:
- Government Transparency and Accountability
Governments can use Qlik Anonymous Access to publish data on public services, budgets, or demographics. Citizens can easily access this information, promoting transparency and encouraging accountability. - Corporate Social Responsibility (CSR) Reporting
Companies can share data on environmental impact, diversity initiatives, and community engagement. This demonstrates commitment and provides stakeholders with valuable insights into your CSR efforts. - Environmental Monitoring
Climate change activists, rejoice! Qlik Anonymous Access makes it easy for organizations to publish real-time data on pollution, biodiversity, and other environmental factors. This can raise awareness or influence policy change. - Research and Academic Collaboration
Academic institutions can publicly share research datasets, fostering collaboration and sparking new ideas within the academic community.
How Does Qlik Anonymous Access Work?
Here’s how Qlik Anonymous Access makes publishing public-facing analytics simple:
- Dedicated Cloud Tenant:
Each customer receives a dedicated cloud tenant, where all public data is managed. - No-Code/Low-Code Embedding:
You don’t need to be a coding expert to embed Qlik dashboards into websites or portals. It’s simple, fast, and effective. - Automatic Data Refresh:
Forget manual updates—Qlik Anonymous Access keeps your data refreshed automatically. - Managed Space:
Apps intended for public access are published to a Managed Space and shared individually. - Security:
Concerned about security? Custom roles need to be created to enable select users in your tenant to make content publicly accessible to ensure protection. Safeguarding your data is always a top priority for us.
With Qlik Anonymous Access, sharing your analytics and public data has never been easier or more secure. Whether you’re a government looking to enhance transparency, a company showcasing CSR efforts, or an academic sharing groundbreaking research, this solution helps you share your insights with the world.
Want to see it in action?
Check out the “SaaS in 60” video and learn how Qlik Anonymous Access can help you turn public data into a competitive advantage. -
Qlik Cloud 10 月の新機能
分析の新機能 階層データファイルの管理 スペースのデータファイルを階層化して管理することができるようになりました。個人スペース、共有スペース、管理スペース、データ スペースにフォルダを作ることができます。データスペースを階層化して分析に利用することができますが、データパイプラインからはスペース内の最... Show More分析の新機能
階層データファイルの管理
スペースのデータファイルを階層化して管理することができるようになりました。個人スペース、共有スペース、管理スペース、データ スペースにフォルダを作ることができます。データスペースを階層化して分析に利用することができますが、データパイプラインからはスペース内の最上位パスにファイルが保存されるため、ファイルをフォルダに移動する必要があります。
スペースの詳細>データファイル、または管理コンソールのコンテンツ>データファイルタブからフォルダを作成し、ファイルを移動することができます。
URL によるチャートの背景画像
チャートの背景にURLによる画像を設定できるようになりました。動的に背景を変更することも可能となります。
ユースケースの例は下記のとおりです。
- 外部ソースからの画像をリンクする。
- インライン SVG をデータ URI として使用する数式を使用して、動的な画像を構築する。
- 数式と API を使用してメディア ライブラリから画像を取得する。
プロパティパネルのスタイル指定の背景画像でURLを選択して設定します。
ボタンによるサイクリック軸の変更
ボタンにサイクリック軸を切り替えるアクションが追加されました。
- サイクリック軸に移動:軸を順に切り替え
- アクティブな項目を設定:指定した軸に切り替え
ボタンをクリックする都度、サイクリック軸の軸を切り替えて表示することができます。
カスタムテーマで選択バーのスタイリング
カスタムテーマで、選択バーとリストボックスの色を設定できるようになりました。画面に統一感を持たせることができます。
データゲートウェイ直接アクセスの新バージョン
Direct Access gateway 1.6.9がリリースされました。
- プロセス分離の分割がデフォルト設定
これまではプロセス分離モードはデフォルトではオフになっていましたが、当バージョンからはオンとなります。ただし、クリーンインストールと時のみ。アップデート時は以前の設定を保持。
- configuration.propertiesファイルの削除
誤りによる変更を防ぐため、インストールフォルダからconfiguration.properties テンプレートファイルが削除されました。現在はC:¥ProgramData¥DirectAccessGatewayに1ファイルのみとなります。
JSONファイルのロード
RESTコネクタ無しで、JSONファイルを直接アプリに読み込むことができるようになりました。
- コネクタを追加することなく、.jsonファイルをQlik Senseに直接読み込むことができます。
- ワイルドカードローディングを使用して、ファイル構造が異なっていても複数のJSONファイルを結合できます。
- ソースファイル間で見つかったすべてのデータを動的にモデル化し、対応させます。
- フィールド選択パラメーターを使用して、JSON配列から特定のフィールドまたはすべてのフィールドをロードします。
- 大規模で複雑なJSONファイルのロードを可能にします。
- JSONロードのユーザーインターフェイスではウィザード駆動のステップでセットアップが簡素化されます。
- JSON ファイルは、データファイルとカタログでサポートされ、データのプロファイリングと管理が可能です。
その他の機能改善
- ストレートテーブルのスタイル改善(Visualization bundle)
フォント、ヘッダの文字と背景色、グリッドの高さや境界線や区切り線の色、ホバーの色、Null値のフォント 等
- アプリの自動化の改善
Get Chart Image ブロックにより、直接チャート画像を生成できるようになりました。
トリガーされた実行トークンの更新をサポートするようになりました。自動化エディタのStartブロックから行うことができます。
- AutoML の改善
時間軸を持つデータのトレーニング時にデータ漏洩を防ぐ機能として、タイムウェアモデルが導入されました。
データ統合の新機能
追加の アプリケーション コネクタ
データ ソースとして使用できる保険およびセキュリティ関連のアプリケーションへのコネクタを追加しました。
- Guidewire BillingCenter (Lite)
- Guidewire ClaimCenter (Lite)
- Guidewire InsuranceNow (Lite)
- Guidewire PolicyCenter (Lite)
- Invicti (Lite)
- LevelBlue USM Anywhere (Lite) (旧 AlienVault)
- Microsoft InTune (Lite)
- Sophos (Lite)
データ品質のカスタマイズ
ユーザーはリソースの使用を最適化しながら、データ品質プロセスをビジネス ニーズに合わせてカスタマイズして調整できるようになりました。カタログ、もしくはデータ製品からデータセットを開き、「更新」をクリックして、「品質とプロファイリング」画面を開きます。
サンプルサイズ:データ品質を計算するためのデータセットの行数またはパーセンテージを設定
処理モード : プッシュダウン モード (Snowflake のパワーを活用) またはプルアップ モード (Qlik Cloud のエンジンを使用)
その他の機能改善
- Qlik Data Gateway - Data Movement 2024.5.16
いくつか問題が解決されています。Data Movement gateway バージョン履歴をご確認ください。
- 変換フローがAmazon Redshift をサポート
Amazon Redshiftをターゲットとして使用するデータ・パイプライン・プロジェクトで、変換フローがサポートされるようになりました。
- プロジェクトの削除
タスクが実行中でなければ、ワンクリックでプロジェクトとそれに含まれるタスクをまとめて削除できるようになりました。
管理者・管理の新機能
OIDC ベースの ID プロバイダーにキーペアをサポート
OIDC ベースの ID プロバイダーをプロビジョニングするときに、パブリック キーとプライベート キーのペアを生成できるようになりました。これにより、ID プロバイダーは、ユーザー認証時に暗号化された安全な方法でユーザー ID トークンを Qlik Cloud に送信できるようになります。
パブリック キー: ID プロバイダーがトークンを暗号化するために使用
プライベート キー: Qlik Cloud がトークンを解読し、トークンが含む情報にアクセスするために使用
詳細は下記ヘルプをご参照ください。
Qlik 匿名アクセスサブスクリプション ー Qlik Anonymous Access
匿名アクセスサブスクリプションによってログインや認証をせずにQlikのアプリやコンテンツを共有することができます。インターネットに接続できる人なら誰でもこれらの開くことができるアプリのリンクを作成したり、アプリのコンテンツをウェブ サイトやアプリケーションに直接統合するために使用できる埋め込みコードを生成します。
2種類のユーザー
- テナントユーザー:コンテンツの作成
- 匿名ユーザー:
- アプリを開く
- 公開シートを開く (使用可能な場合)
- ビジュアライゼーションを表示 (使用可能な場合)
- 公開ブックマークを適用
- 選択を実行
- アプリのコンテンツのダウンロード
- (ストーリー、メモ、レポート、アラートなどは使用できません。)
テナントはスウェーデンとなります。
仕様と容量の制限については下記をご参照ください。

-
Inject AI into your Databricks Qlik Talend Cloud Data Pipeline
Qlik Talend Cloud enables you to build data pipelines that capture data from numerous sources – including streaming and traditional data sources - and... Show MoreQlik Talend Cloud enables you to build data pipelines that capture data from numerous sources – including streaming and traditional data sources - and transform it to feed data lakes, lake houses or data warehouses. Adding AI capabilities to their data lakehouses is at the top of many IT organizations’ priority list because these capabilities represent a savings of time and manual effort for data consumers. Databricks is an extremely popular and versatile data lake platform, based on Delta tables, for which Qlik provides out-of-the-box seamless data integration solutions. With Qlik Talend Cloud’s advanced smart data pipeline execution capabilities, changes at the source can be automatically applied throughout the pipeline to Databricks Delta tables. Together, Qlik and Databricks provide a platform that will help customers leverage complex analytic capabilities throughout their data lifecycle.
Introducing Databricks AI SQL functionality
Databricks AI SQL functions enhance traditional SQL with advanced capabilities for predictive(??) data analysis and transformation. The SQL functions integrate machine learning models directly into SQL queries, which allow users to perform complex operations, predictions and analytics with SQL. These include, for instance, built-in support for model inference, and seamless application of AI models on data stored within Databrick's Delta tables. Some of these functions can be leveraged for executing complex tasks such as sentiment analysis, grammar correction, language translation, data summarization, and data masking. The AI functions streamline the process of directly integrating AI into data stored within the Databricks platform.
How Databricks AI SQL functions work with Qlik Talend Cloud
Below is a depiction of a data flow for Qlik Talend Cloud ingesting data into Databricks and generating SQL with Databricks AI SQL functions. Qlik Talend Cloud (QTC) Data Integration transformations generate SQL within the transformation flow, which is executed on the Databricks platform resulting in Databricks Delta tables storing the results of the AI functions.
Qlik offers a no-code solution to use the Databricks AI functions. Your organization can utilize Qlik Talend Cloud for real-time CDC data ingestion, data transformation, data quality, and governance, while feeding data into your Databricks Lakehouse. Within the data pipeline, you can utilize the processors for AI functions by simply dragging and dropping them on the transformation flow canvas.
Get Started with Databricks AI SQL functions with Qlik Talend Cloud
Setting up and running Databricks AI functions
In Qlik Talend Cloud you can use AI SQL functions within transformation tasks within a data-pipeline project. Transformations can be leveraged whether you use Qlik Talend Cloud Data Integration for onboarding data or any other tool to ingest data into Databricks.
Below is an example of a typical Qlik Talend Cloud Data Integration pipeline. It consumes data from multiple sources and transforms that data into analytics-ready structures such as SQL-derived data views and automated data marts.
Within the data pipeline, transformation workflows can be accessed by creating a transformation data task.
The transform view provides an interface to map onboarded source data to the target dataset. To build a transformation, select the source datasets and add a transformation flow.
From within the transformation flow, AI processors can be dragged to the canvas to create a data flow (see below).
With the new AI processor selected, properties of the Databricks AI functions can be configured using the properties box on the right edge of the screenshot below. Databricks function names can be selected with the column as input for the function. Output column names can be selected. (Some of the Databricks AI functions will have additional input parameters required by the function.)
In the example below, we are going to illustrate using the AI processor, that will call the ai_summarize SQL function to generate a summary for product categories in a table within a transformation workflow
The screenshot shows how the Databricks Summarize AI function can be configured. The Summarize Databricks AI function will use AI to summarize the items found within that categorization on a single line of descriptive text. This will help downstream data consumers understand the data within a specific table –- in this case product categories -- without having to spend time and effort on additional research and / or writing additional queries.
Qlik Talend Cloud will generate the SQL to be executed downstream by the Databricks SQL Warehouse.
If Data preview is enabled in the Qlik Talend Cloud tenant. A sample of data results will be shown in the canvas. The DESCRIPTION_SUMMARY column will show the results of the AI_SUMMARIZE function.
The transformation flow will show an output dataset with a primary key. The dataset will be created in Databricks once the task is prepared and ready for data to be loaded.
After completion of running the task, Databricks Data will be loaded with the results of the AI function. (Results of the function are shown in the DESCRIPTION_SUMMARY column.)
Conclusion
Databricks AI functions can be leveraged for use today in Qlik Talend Cloud to provide AI capabilities to data directly using transformation flows without writing code. However, AI SQL functions can still be leveraged in custom code written within your transformation task. Utilizing Qlik to build your data pipeline can reduce the complex nuances of integrating AI capabilities with your data by utilizing a graphical interface for implementation of your transformation flow. This will help organizations quickly adapt to harnessing the power of AI for problem-solving with the Databricks platform.
-
Techspert Talks - Managing Qlik Cloud Remotely Using Qlik-CLI
Hi everyone, Want to stay a step ahead of important Qlik support issues? Then sign up for our monthly webinar series where you can get first-hand ins... Show MoreHi everyone,Want to stay a step ahead of important Qlik support issues? Then sign up for our monthly webinar series where you can get first-hand insights from Qlik experts.The Techspert Talks session from November lookat at Managing Qlik Cloud Remotely Using Qlik-CLI.But wait, what is it exactly?Techspert Talks is a free webinar held on a monthly basis, where you can hear directly from Qlik Techsperts on topics that are relevant to Customers and Partners today.This Techspert Talks session will discuss how to remotely manage:- Spaces
- Apps
- Users
- Roles

-
Quizz App
Quizz App Quizz Quizz application, I used Qlik questions that I found in my Chest (“laughs”), for the purpose of illustrating the application on... Show MoreQuizz AppQuizzQuizz application, I used Qlik questions that I found in my Chest (“laughs”), for the purpose of illustrating the application only. It brings an approach serving as a basis for those who want to create an application with choice questions. File is available at qvf for downloadDiscoveries
This application will guide you in the construction of a questionnaire, with selection questions for correct or incorrect choices
Impact
Agility in creating a questionnaire, Save time spent Ease of use. Of course, as I said, these are simple applications that require adjustments to achieve better results, but this is a starting point for your construction.
Audience
Education and related areas HR
Data and advanced analytics
The data composes questions, alternatives and templates
-
New Security capability in Talend 8.0.1 - Native JWT Token Validation
In Patch Release 8.0.1 R2024-07 Talend introduced native product support for JWT (JSON Web Token) validation, fulfilling a long-standing feature reque... Show MoreIn Patch Release 8.0.1 R2024-07 Talend introduced native product support for JWT (JSON Web Token) validation, fulfilling a long-standing feature request. This new functionality significantly enhances security by enabling OIDC (OpenID Connect) / OAuth2 integration with REST services developed in Talend Studio. Prior to this update, Talend only supported the following authentication mechanisms:
- Basic Authentication: Known for its weak security, as credentials are sent in an easily decodable format.
- Proprietary SAML Token Authentication: While secure, it lacked interoperability with common standards and external identity providers.
- Misleading "Open ID Connect" Support: Despite the name, Talend's OIDC support was actually a custom OAuth2 implementation using the outdated "Resource Owner Password Credentials" (ROPC) grant type. ROPC is no longer recommended due to inherent security vulnerabilities, as it requires direct handling of user credentials.
With the introduction of JWT token validation, Talend now supports modern, robust security integrations. This allows for seamless authentication using external identity providers like Azure Entra ID or Keycloak, empowering users to authenticate against these providers and retrieve a signed JWT token tied to a specific service.
What is JWT?
JWT (JSON Web Token) is an open, industry-standard method (RFC 7519) for securely transmitting information between parties as a JSON object. It's widely used for authorization and information exchange in modern web applications, particularly in OIDC and OAuth2-based security systems.
JWTs are compact, URL-safe tokens that consist of three parts:
-
Header: This part typically consists of two fields: the type of token (JWT) and the signing algorithm being used (e.g., HMAC SHA256).
-
Payload: The payload contains the claims. Claims are statements about an entity (typically, the user) and additional metadata. There are three types of claims:
- Registered claims: Standard claims like
iss(issuer),exp(expiration time),sub(subject), etc. - Public claims: Custom claims that can be defined in your own application context.
- Private claims: Claims agreed upon by both parties, generally used for sharing specific details between the client and the server.
- Registered claims: Standard claims like
-
Signature: The signature is used to verify the token wasn’t tampered with. It's created by signing the header and payload with a secret (or private key) using the specified algorithm.
When a JWT is generated, it typically looks like this:
eyJhbGciOiJIUzI1NiIsInR5cCI6IkpXVCJ9.eyJzdWIiOiIxMjM0NTY3ODkwIiwibmFtZSI6IkpvaG4gRG9lIiwiaWF0IjoxNTE2MjM5MDIyfQ.SflKxwRJSMeKKF2QT4fwpMeJf36POk6yJV_adQssw5c. This compact format makes JWT ideal for inclusion in HTTP headers and other parts of a request.Benefits of JWT in Talend
-
Interoperability: JWT is widely adopted and interoperable with numerous modern identity providers, allowing Talend to integrate smoothly with services like Azure AD, Okta, Keycloak, and many more.
-
Enhanced Security: JWT offers a more secure approach to authentication than the methods previously supported by Talend. The token's structure ensures that user credentials are never exposed, and its digital signature prevents tampering.
-
Stateless Authentication: One of the key advantages of JWT is that it’s stateless, meaning the server does not need to maintain session data. This reduces overhead and makes JWT ideal for microservices or distributed environments.
-
Role-based Access Control (RBAC): JWT tokens often carry role-based information, enabling fine-grained access control within Talend projects and services.
-
Scalability: JWT’s stateless nature makes it well-suited for distributed systems and scalable cloud architectures, aligning with modern software practices.
How JWT Improves Talend’s OAuth2 Support
By supporting JWT token validation, Talend now complies with modern OAuth2 practices and OIDC standards. OAuth2 flows like Authorization Code Flow and Client Credentials Flow, which utilize JWT tokens, provide improved security and flexibility. These flows are widely adopted across cloud and enterprise environments.
This change enables developers to move away from legacy practices like Basic Authentication and ROPC, which are vulnerable to security risks, and to implement scalable, secure APIs using OAuth2-based authentication strategies.
Integrating Talend JWT Validation with Azure Entra ID
Azure Entra ID (formerly known as Azure AD) is a robust cloud-based identity management service that provides OAuth2 and OIDC support, making it an ideal candidate for integrating with Talend’s REST services.
JWT Scenario
Let's take the above use case as an example. A user wants to access a web portal. He uses OIDC to login to the portal. The portal can either reuse the provided access token to call a backend REST service, or authenticate with its own client credentials against the identity provider (IDP) to get an access token for the REST Service. The REST service validates the JWT access token and loads some data from a DB. The REST service needs to call a legacy SOAP service to perform some calculations based on the loaded data. To invoke the SOAP service the REST service needs to exchange the JWT token against a SAML token at the local STS. With the new features in Talend this scenario could be implemented. However in my blog I want to keep it a bit simpler and only focus on getting a JWT access token for my portal application to call a REST service which will validate the JWT access token. For this purpose I need to setup two applications in Azure. The frontend portal and my backend REST service.
1. Register the backend REST service
First, you need to register your REST backend service as an application within Azure Entra ID.
- Sign in to Azure Portal and go to Azure Active Directory.
- Under Manage, select App registrations and click New registration.
azure-app-registration
- Provide a Name for the application (e.g., "Customer Service").
azure-app-registration-2
- Redirect URI can be left empty, as the users will only login to the frontend portal, but not to the backend REST service.
- Click Register to complete the process.
2. Configure API Permissions
As your talend service does not need to query the Azure Graph API to get additional user information, you can safely delete the existing “User.Read” permission.
3. Expose an API
To allow other applications to request an access token for your service, you need to define at leastone scope. E.g. execute, read, write, etc.A scope is similar to a permission that a client application can request to interact with your service.What the service will finally do, depends on your service implementation. Your implementation canperform actions based on the user identity or user roles for example. The scope only defines that aclient application wants to use your service for a defined purpose.Scopes require a user and/or admin consent screen to approve that the client can invoke theservice with the requested scope. User scopes only make sense if the user wants to delegate hisresources to the client application. For example his assigned tasks, records, etc.If a client application (e.g. the web portal) is explicitly added as a trusted application the consent screen will not be shown.The scope of an azure application will always be prefixed with an Application ID URI. By default thiswill be api://<app_id>. E.g. api://33ff1479-ca82-4926-8149-e67fe87e221aIt is recommended to change this prefix to match with your service URL. E.g. https://my.server.com:8040/services/myDemoServiceEach defined scope can be used (in a token request) by combining the prefix with the scope name.To add a scope:- Click on: Add a scope
- Define your scope name. E.g. execute
- Select who can consent this scope. E.g. Admins only
- Define your admin consent display name: E.g. Execute webservice
- Define your Admin consent description: Allows the app to execute my demo service
- If user consent was selected you need to define user consent settings as well, otherwise these fields can be left blank.
- State needs to be: Enabled
- Click on: Add scope
azure-app-scope
azure-app-scope-2
azure-app-scope-3
4. Restrict Access to Application
By default any user or application from your Azure tenant could request a JWT token for your Talend REST service. If you want to restrict this access, you need to- define an Application Role
azure-app-role
- disable global access:
- Go to enterprise applications
enterprise applications
- Select your new "Customer Service" and change Assignment required? to be Yes
Restrict Access
- Go to enterprise applications
5. Register frontend web portal application
Next you need to register your frontend web portal as an application within Azure Entra ID.
- Under Manage, select App registrations and click New registration.
App Registration
- Provide a Name for the application (e.g., "Customer Portal").
Register Frontend Portal
- Redirect URI should match with your portal OIDC endpoint, but can also be left empty for my demo case, as we are only using the application to get a JWT token from azure. We will not host an actual portal.
- Click Register to complete the process.
After registration:
- Take note of the Application (client) ID and as you'll need them later as the client_id of the client credentials OAuth2 flow.
- You can find the relevant Azure security URLs if you click on Endpoints on the top overview page. Here you will find the OAuth2 authorization endpoint as well as the token endpoint URL that is applicable for your application. These endpoints need to be used to request access tokens for your talend webservice.
- Under Certificates & secrets, create a new Client Secret and note this value as well.
App Overview
6. Grant access to REST Service for Portal Application
- Go to API permissions of the Customer Portal application
- Remove the existing User.Read permission as it is not needed.
- Add a permission for your REST service
Add permission
Assign Permission
- Grant admin consent
Consent
7. Fetch JWT token via Postman
- Create a new folder e.g. "Customers"
- Go to Authorization and setup your OAuth2 configuration
OAuth2
Endpoints
resource
If you use token endpoint v1, the resource key needs to match with your REST service Application ID URI. If this value is not set, the issued token will not have the correct audience restriction, but will point to the Azure Graph API instead. (e.g. "00000002-0000-0000-c000-000000000000")
If you use token endpoint v2, the scope needs to match with your default service scope, and the resource key can be omitted:endpoint v2
- You can review the token content by copy pasting it on jwt.io
Token Parsing
Token Extract
8. Update Talend to Support JWT Token Validation
Now that you’ve registered your Talend service with Azure Entra ID, you need to configure JWT token validation in Talend to accept tokens issued by Azure.
In Talend Studio:
-
Add a REST service to your Talend job or microservice that will be protected by JWT validation.
-
Configure OAuth2 Settings: In Talend’s REST service settings, you need to enable OAuth2 and specify JWT validation.
Studio JWT Setup
Studio advanced settings
- If you want to parse the JWT token within your Job you need to get the Authorization HTTP header.
HTTP Header
- Decode the JWT token
Decode in Studio
(Get_list_of_customers.Authorization != null && Get_list_of_customers.Authorization.toLowerCase().startsWith("bearer ")) ? new String(java.util.Base64.getDecoder().decode(Get_list_of_customers.Authorization.substring(7).split("\\.")[1]), java.nio.charset.StandardCharsets.UTF_8) : null
9. Test the JWT Validation
Now that everything is set up, you can test the JWT validation flow by obtaining a token from Azure Entra ID and using it to access your Talend REST service.
Test without a valid token
missing token test
Test with a valid TokenDue to a limitation in CXF we cannot use the JSON Web Keys URL from azure directly.Therefore we need to import the certificates from the JWKS URL (https://login.microsoftonline.com/e802cfd6-3314-4a12-8978-0efd5875022b/discovery/v2.0/keys) into a java keystore and use this keystore instead.- Copy certificates from URL into local text files:
- Use keytool commands or under Windows you can use the Keystore Explorer
- Update the tRESTClient JWT configuration
- Restart the service and rerun the test. This time it is working just fine:
Talend will validate the token based on the configuration you set, ensuring that only requests with a valid JWT from Azure Entra ID can access the protected resource.10. Troubleshooting
- Invalid Token: Make sure the audience (client ID) and issuer (Azure token endpoint) are correctly set in Talend’s configuration.
- Expired Token: JWT tokens have an expiration (
expclaim). Ensure that the token hasn’t expired. - Signature Validation Failed: Ensure that the public keys for verifying the JWT signature are correct.
Conclusion
Integrating Talend’s new JWT validation feature with Azure Entra ID is a significant improvement for securing REST services. By leveraging Azure’s robust identity platform, you can ensure that only authenticated users or services can access your APIs, while benefiting from the scalability and security offered by JWT.
-
【オンデマンド配信】The AI Reality Tour Tokyo ダイジェスト
去る 10月 2日(水)に開催しました「The AI Reality Tour Tokyo」 では、データの世界で起きている AI の現実に焦点を当て、Qlik の最新の AI イノベーションや先進的なユーザー事例をご紹介しました。 本 Web セミナーでは、特別ゲストと Qlik のエグゼクティブ... Show More去る 10月 2日(水)に開催しました「The AI Reality Tour Tokyo」 では、データの世界で起きている AI の現実に焦点を当て、Qlik の最新の AI イノベーションや先進的なユーザー事例をご紹介しました。
本 Web セミナーでは、特別ゲストと Qlik のエグゼクティブによるパネルディスカッション、3 社の日本企業による先進的な事例をお届けします。
※本 Web セミナーは、2024年 10月 2日(水)開催の「The AI Reality Tour Tokyo」 における一部の講演を録画したものです。
※参加費無料。パソコン・タブレット・スマートフォンで、どこからでもご視聴いただけます。
今すぐ視聴する【開催概要】
日時:オンデマンド配信
講演企業:富士通株式会社 / Snowflake 合同会社 / QTnet 株式会社
NEC パーソナルコンピュータ株式会社 / SEGA -
Welcome to the exciting world of Qlik Application Automation!
Introducing our new course: Qlik Application Automation! This comprehensive course is designed to empower you with the skills and knowledge needed to ... Show MoreIntroducing our new course: Qlik Application Automation! This comprehensive course is designed to empower you with the skills and knowledge needed to harness the full potential of Qlik's powerful automation capabilities and enable you to seamlessly integrate and orchestrate data flows, ensuring timely and accurate insights that drive business success.
All done with a no-code visual interface that helps you easily build automated analytics and data workflows!
In just one day, you will be able to:
- Understand Application Automation and its key features
- Create automations from scratch
- Learn about the automation templates
- Provide examples of external connectors that could be used to enhance Qlik Cloud
- Identify potential use cases where Application Automation is beneficial
Our first session is scheduled for November 7 so book your seat now for this exciting new course! Remember to use the code CLASSROOM30 at checkout to get 30% off!
Happy Learning!
-
New: Efficiently Manage Your Local Qlik Cloud Analytics Data Files with Enhanced...
Experience the convenience of a smarter, more efficient file management system today! We have introduced our new Enhanced File Management feature in Q... Show MoreExperience the convenience of a smarter, more efficient file management system today!
We have introduced our new Enhanced File Management feature in Qlik Cloud—making organization effortless. Now you can seamlessly structure your uploaded and cloud-generated files into directories and subdirectories, giving you full control over your data.
With batch actions like move, copy, cut, and paste, managing multiple files has never been easier or faster. Streamline your workflow, reduce clutter, and stay organized with just a few clicks.
This feature has been rolled out in the following regions as per:
- Oct 7th (Mon): SE+JP+UK - 14:00 CET/08:00 ET
- Oct 9th (Wed): DE+SG+AP - 14:00 CET/08:00 ET
- Oct 14th (Mon): US - 15:00 CET/09:00 ET
- Oct 16th (Wed): EU 14:00 CET/08:00 ET
In this blog post we will cover:
- Where to access the folder structure
- Create folder hierarchies and organize files into them
- Perform bulk operations on files and folders
- Reference space folder structure in Sense app and script development
- LOAD statements in the load script
- Store statements
- Inserting QVS code
- Documentation
Where to access the folder structure
The new features are accessible in your Data files menu for each space.
- First, navigate to your Space and click Space Details
- Choose Data files
- You'll now have access to additional options, such as creating, copying, or deleting folders
Create folder hierarchies and organize files into them
Each space (Personal, Shared, Managed, and Data) in Qlik Cloud Analytics contains its own structure of folders organized in a hierarchical fashion. Data files can be organized in nested folder structures. For example, within your personal space, you might want to have separate folders for Order Data and Budget Data.
The location of a file or folder within a space is shown in its path. The path uses / symbols to represent when a folder is nested within other folders.
For example, suppose within your personal space, you have separate folders for Order Data and Budget Data. If you have a data file named Orders_2024_December.QVD in your Order Data folder, this file would be located in the following folder path within your personal space:
Personal/Order Data
Perform bulk operations on files and folders
Files and folders can be moved to different spaces or locations within the same space. You can also move multiple items at a time using the Cut and Paste actions, either from the menu or through keyboard shortcuts (CTRL-C, CTRL-V, CTRL-X).
Reference space folder structure in Sense app and script development
LOAD statements in the load script
When you use files in spaces to add data to apps and scripts, the folder location in the space is referenced and required.
Examples: Reference to file at the top-level path of a space
This example loads the file orders.csv from a personal space. The file is not located within any specific folder but sits at the top-level path in the space.
LOAD * FROM [lib://DataFiles/orders.csv];
This example loads the file orders.csv from a shared, managed, or data space. The name of the space is TeamSharedSpace. The file is not located within any specific folder but sits at the top-level path in the space.
LOAD * FROM [lib://TeamSharedSpace:DataFiles/orders.csv];Examples: References to specific folder path within a space
This example loads the file orders_Europe.csv from the folder Orders By Region within a personal space.
LOAD * FROM [lib://DataFiles/Orders By Region/orders_Europe.csv];
This example loads the file orders_Europe.csv from the folder Orders By Region within a shared, managed, or data space. The name of the space is SalesSpace.
LOAD * FROM [lib://SalesSpace:DataFiles/Orders By Region/orders_Europe.csv];
Store statements
When you add a Store statement to store data from a load script into Qlik Cloud Analytics, the folder location in the space is referenced and required.
Example: Storing file at the top-level path of a space
In this example, the entire table mytable is exported into Qlik Cloud Analytics as a file named myfile.qvd. The file is added to the shared space TeamSharedSpace. The file is not located within any specific folder but sits at the top-level path in the space.
Store * from mytable into [lib://TeamSharedSpace:DataFiles/myfile.qvd];
Example: Storing file to a specific folder path within a space
In this example, the entire table mytable is exported into Qlik Cloud Analytics as a file named myfile.qvd. The file is added to the folder SalesData within the space TeamSharedSpace.
Store * from mytable into [lib://TeamSharedSpace:DataFiles/SalesData/myfile.qvd];
Inserting QVS code
When inserting QVS code into a load script, the folder location in the space is referenced and required.
Example: Referencing QVS file at the top-level path of a space
In this example, the file test.qvs is referenced in the load script. The file is located in the space TeamSharedSpace. The file is not located within any specific folder but sits at the top-level path in the space.
$(Must_Include=lib://TeamSharedSpace:DataFiles/test.qvs)
Example: Referencing QVS file in a specific folder path within a space
In this example, the file test.qvs is referenced in the load script. The file is located in the folder SalesData within the space TeamSharedSpace.
$(Must_Include=lib://TeamSharedSpace:DataFiles/SalesData/test.qvs)
Documentation
The Qlik Cloud Documentation has been updated with comprehensive information about the new feature.
- Managing data files
- Adding datasets from local files
- Inserting QVS code from spaces in Qlik Cloud Analytics
- Storing files to spaces in Qlik Cloud Analytics
- Loading files from spaces in Qlik Cloud Analytics
Thank you for choosing Qlik,
Qlik Support -
Talend 7.3.1 Reaches End of Support
Talend 7.3.1 Reaches End of Support Talend version 7.3.1, released in February 2020, will reach the end of support on November 30, 2024, as detailed... Show MoreTalend 7.3.1 Reaches End of Support
Talend version 7.3.1, released in February 2020, will reach the end of support on November 30, 2024, as detailed in the Talend Product Documentation. After this date, Talend version 8 will be the only regularly supported version of the Talend Platform.
What are the options for Talend 7.3.1 customers?
If you are currently using Talend version 7.3.1 in a mission-critical production environment, we encourage you to consider one of the following options:
- Transition to fully supported Talend 8 and purchase Talend 7.3.1 Limited Extended Support. We realize that you might need more time to migrate to Talend 8, so this option includes a limited Talend 7.3.1 support offering, covering one additional 13-month period ending December 31, 2025.
- Transition to fully supported Talend 8 only. Talend 8 includes many features and improvements that enhance your productivity and efficiency, not to mention that upgrading to a supported version helps ensure that your software stays relevant, secure, and usable for years to come. You can continue operating Talend 7.3.1, but it will not be supported by Qlik.
Note: Every active Talend subscription is entitled to a current Talend version 8 license. If you do not already have a Talend 8 license, please contact Qlik Customer Support via the customer portal to request one. Active subscriptions with renewal dates before December 30, 2025, can also buy the Talend 7.3.1 Limited Extended Support offer if needed.
Frequently Asked Questions
This knowledge article provides answers to the frequently asked questions that customers have posed about the End-of-Support for Talend 7.3.1.
Next Steps
For renewal and purchase information, contact the following:
- If you purchased Talend 7.3.1 from a Talend or Qlik Partner, please contact that Partner to discuss pricing and options.
- If you purchased Talend 7.3.1 directly from Talend or Qlik, please contact your Qlik Talend representative directly or via email at sales@qlik.com.
Finally, for all other upgrade and troubleshooting information, contact Qlik Customer support at https://customerportal.qlik.com/.
-
【開催報告】AI Reality Tour Tokyo
本年は久しぶりに Qlik US 本社のスピーカーを迎えての幕開けです。グローバルの戦略・市場開発部門 部門長である Josh Good からは Qlik のビジョンと新製品をご紹介しました。 続いては、富士通 執行役員EVP, CDXO 兼 CIO 福田様をゲストに迎え、「世界で一つの Sing... Show More本年は久しぶりに Qlik US 本社のスピーカーを迎えての幕開けです。グローバルの戦略・市場開発部門 部門長である Josh Good からは Qlik のビジョンと新製品をご紹介しました。
続いては、富士通 執行役員EVP, CDXO 兼 CIO 福田様をゲストに迎え、「世界で一つの Single of Truth のデータに基づく意思決定」に向けた One Fujitsu の取り組み, そしてAI を使った具体的な意思決定の例と将来への期待についてお話を伺いました。続く Snowflake 社長執行役員の東條様は、「Snowflake に蓄積されたデータと AI の掛け算」の取り組みから、Snowflake と Qlik で実現するしっかりとしたデータ基盤の重要性を訴求されました。ジェネラルセッションの最後は AWS パートナーソリューションアーキテクト 吉田様より同社と Qlik による生成 AI データ分析基盤をご紹介いただきました。
コーヒーブレイクを挟み、ビジネスセッションとテクノロジーセッションとなります。ビジネスセッションでは富士通池田様から同社の AI とデータ分析の最新の取り組みをご紹介いただきました。今回も九州からわざわざお越しいただいた QTnet 様は 2012年からの QlikView ユーザーですが、2021年に Qlik Sense に完全移行し、データ整備には Talend をご利用いただいています。その活用成果や実際のダッシュボードをご披露いただきました。
NECPC 様は「オンプレからクラウドへ、人手から自動化へ。NECPC のデータ統合・活用戦略とは」と題し、同社のビジョンである「リアルタイムでのデータ活用とアナリティクスの民主化」を Qlik を使ってどのように実現したかをご説明されました。SEGA 様からは、データアナリストとデータエンジニアが共通して使えるデータ分析・AI 活用のための分析基盤構築の取り組みとデータを使ってビジネス成果を生み出した AI 活用事例をご説明いただきました。
パートナーセッションでは、インサイトテクノロジー児玉様より、生成 AI のランドスケープの概観と、そこに対する Qlik Talend Cloud の可能性をお話しいただきました。日鉄ソリューションズ様は、データマネジメント基盤の必要性と Qlik 製品を使った同社のプラットフォームをご紹介されました。アシスト様は 2013年から AI ビジネスをスタートしており、その経験に基づき、企業が生成 AI を導入する際に考慮すべきポイントと同社の AI 活用サービス「AI Buddy」をご紹介されました。
サブステージでは 7つのテクノロジーセッションが展開されました。Qlik プリセールスチームによる製品ロードマップ、ビジュアライゼーション、SAP データ統合ソリューション、新製品となる Qlik Talend Cloud、Qlik Data Product、Qlik Answersなどをデモを交えてご紹介しました。また、ゲストスピーカーの Snowflake 様からは Snowflake と Qlik 連携で実現するデータ駆動型ビジネスをご紹介いただきました。
展示エリアではスポンサー様のソリューションブースで多くの方がお立ち寄りになり、また Qlik は、データマイグレーションを気軽にご相談できる「スナックマイグレ」を開店しました。
すべてのプログラム終了後の懇親会では、ユーザー、パートナー、Qlik 社員による、AI とデータ活用について活発な情報交換が行われました。
かつては BI だけだった Qlik が、最先端の AI やデータ基盤をテーマとして開催した本イベントでは、参加された皆様に新生 Qlik を十分に実感いただいたと思います。なお、12月5日より、本イベントのハイライトをオンラインで配信いたします。ご参加いただけなかった方はぜひご視聴ください。
-
Release Cadence Update: Qlik Sense Enterprise Client-Managed
Beginning with the May 2024 release, Qlik Sense Enterprise Client-Managed will release two major releases a year (May and November). This adjustment ... Show MoreBeginning with the May 2024 release, Qlik Sense Enterprise Client-Managed will release two major releases a year (May and November).
This adjustment aligns our release cycle with the preferred cadence of our customers, enhancing communication around our major releases. Qlik continues to add new functionality to Qlik Sense Client-Managed versions following their initial release to the cloud. As always, we will continue to deliver patches as needed under our Release Management Policy.
We look forward to helping you optimize your release experience. Be sure to follow the release notes area in Qlik Community and review our updated policy.
-
Unlock Scalable, Secure and Effortless Public Data Sharing with Qlik Anonymous A...
Imagine making Qlik content available to the public without requiring users to log in. And now imagine no more and get started with Qlik Anonymous Ac... Show MoreImagine making Qlik content available to the public without requiring users to log in.
And now imagine no more and get started with Qlik Anonymous Access, a feature we hope you are as excited about as we are. Qlik Anonymous Access will strengthen your community, drive engagement, and help you unlock the full potential of your public data.
See our full Innovation blog here.
The Highlights
Making data available to the public is one thing—making it easy to access and consume is another. This is where Qlik’s Anonymous Access shines. By allowing users to interact with dashboards without a login, Qlik simplifies data access for a broad audience, allowing:
-
No Barriers to Entry: Any website visitor can navigate and explore interactive dashboards and reports without login
-
Inclusive Data Access: This simplifies access, ensuring that a broader audience, from policymakers to concerned citizens, can engage with the data.
-
Seamless Embedding: Qlik’s dashboards, apps, and sheets can be embedded into web portals, transforming static reports into interactive, easily navigable experiences.
-
Continuously up to date: Qlik Anonymous Access provides automatic refresh, keeping the information current.
-
Interactive Engagement: Dashboards allow users to filter, explore, and interact with data, fostering deeper understanding and insights.
-
Empowering Conversations: Encourages meaningful discussions by directly providing real-time, actionable insights through intuitive, dynamic tools.
-
Centralized Knowledge Hub: Embedding Qlik dashboards into internal and public portals creates a unified space for information and decision-making.
-
Security: The security feature, defaulted to "not allowed," prevents unauthorized public data sharing, enhancing security when sharing with anonymous users. To enable it, you must create a custom role, set the scope to "allowed," and assign it to authorized users or groups.
-
Enhanced Accessibility: The cloud allows users to access public data from anywhere, making it easier for communities and organizations to engage with the information.
How to get started
Anonymous Access is controlled at the app level. Users with the correct permissions can turn anonymous access on and off as needed. These users can also configure access code settings, as well as view and copy links and codes that provide anonymous access.
- How to get started: Sharing app content with anonymous access
- Using Anonymous Access with qlik-embed: Anonymous Access with qlik-embed
Subscriptions and Offerings
With a Qlik Anonymous Access subscription, you create an anonymous access tenant in Qlik Cloud. The cloud infrastructure is hosted and managed by Qlik. In an anonymous access tenant, the user experience is very similar to other Qlik Cloud subscriptions. The main differences are assignment of user entitlement by administrators, limitations on using certain add-on capabilities, and capacities for data loading and app development.
See Qlik Anonymous Access subscriptions for details.
Thank you for choosing Qlik,
Qlik Support -
-
What does the TOTAL qualifier do?
@What does the TOTAL qualifier do when used in a chart expression? I have used TOTAL in an expression when I want to perform an aggregation across al... Show More@What does the TOTAL qualifier do when used in a chart expression? I have used TOTAL in an expression when I want to perform an aggregation across all dimensions. For instance, if I need to show the percentage of employees in a specific office in a KPI object, I would use the TOTAL qualifier in an expression like this:

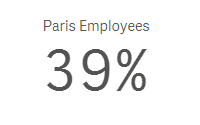
I would sum the number of employees in the Paris office and divide that by the total number of employees across all offices. In this expression, TOTAL disregards the dimension value (which is City in this case) and adds all employees. Now if I make a selection in my app and select Paris, then my KPI would change to 100% because the total is based on the possible field values. To get around this, I can add set analysis to the expression to look at the data before any selections were made. The expression would look like the expression below and would remain 39% even if city selections are made.

I often use the TOTAL qualifier in KPI objects when I need to highlight a value but it can be used in any chart expression. In the pivot table below, you can see how an expression value can differ with the use of TOTAL.
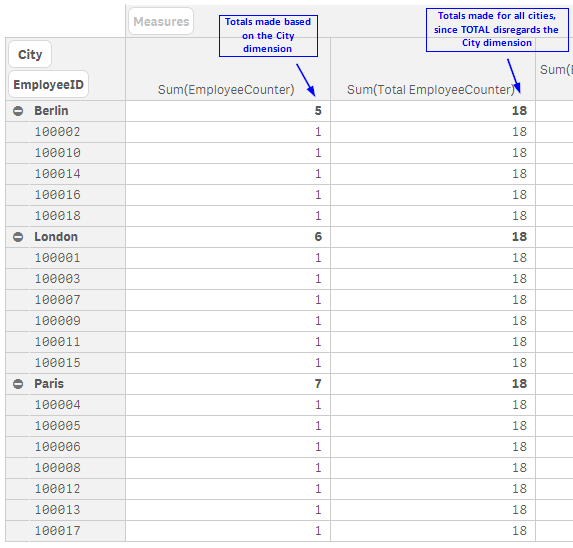
The TOTAL qualifier is useful when you want to see the shares of something similar to when you use a pie chart to see the percentage of parts that make up the whole. In my case, it is helpful when I want to see the shares without making a selection first. Henric Cronstrom wrote a great blog on The Aggregation Scope which talks about this topic is more detail.
Thanks,
Jennell