Unlock a world of possibilities! Login now and discover the exclusive benefits awaiting you.
Analytics & AI
Forums for Qlik Analytic solutions. Ask questions, join discussions, find solutions, and access documentation and resources.
Data Integration & Quality
Forums for Qlik Data Integration solutions. Ask questions, join discussions, find solutions, and access documentation and resources
Explore Qlik Gallery
Qlik Gallery is meant to encourage Qlikkies everywhere to share their progress – from a first Qlik app – to a favorite Qlik app – and everything in-between.
Qlik Community
Get started on Qlik Community, find How-To documents, and join general non-product related discussions.
Qlik Resources
Direct links to other resources within the Qlik ecosystem. We suggest you bookmark this page.
Qlik Academic Program
Qlik gives qualified university students, educators, and researchers free Qlik software and resources to prepare students for the data-driven workplace.
Recent Blog Posts
-
Introducing the New Layout Container - Tips, Tricks, Nuances
The layout container, part of the Qlik Analytics dashboard bundle, is a new object that enables free layout of charts, the ability to stack visualizat... Show MoreThe layout container, part of the Qlik Analytics dashboard bundle, is a new object that enables free layout of charts, the ability to stack visualizations, combine charts into new visualizations, as well as multi-select and group objects for easier sizing, positioning and alignment. The layout container is a great addition to the many easy to use and powerful capabilities available in Qlik Analytics
SaaS in 60

-
Qlik Digest - October 2024
Welcome to the October Qlik Digest, your one-stop source for the latest updates from Qlik. This month, discover exciting updates, including enhancemen... Show MoreWelcome to the October Qlik Digest, your one-stop source for the latest updates from Qlik. This month, discover exciting updates, including enhancements to Qlik Cloud Reporting Services, the launch of Qlik Anonymous Access, and the save-the-date for Qlik Connect 2025. Don’t miss out on new learning opportunities designed to elevate your Qlik experience!
Qlik Cloud Reporting Services is “pretty perfect.”
Qlik Cloud Analytics Reporting Services is receiving a significant upgrade with several new features. The update includes report cycling, allowing developers to produce reports per dimension value, and an expanded report task guardrail supporting up to 500 reports. A new report task history feature will provide visibility into past runs, retaining up to 3 months of execution data, coming soon this quarter.
Moreover, we are introducing PixelPerfect authoring which enables the creation of advanced document composition templates for high-fidelity reports. These enhancements build upon the tabular reporting capabilities introduced last year, further expanding Qlik Cloud's reporting offerings.
New Reasons to Move to the Cloud with Qlik Anonymous Access, available later this month!
Qlik Anonymous Access allows organizations to publish Qlik Analytics solutions (apps, sheets, charts) directly onto public-facing websites or portals, providing access to public users — a feature previously available only in Client-Managed environments. With this, you can:
- Boost transparency, visibility, and engagement with public data sharing.
- Seamlessly embed public data insights into websites and applications.
- Cost-effective and easy to maintain with a cloud deployment and automatic refresh
- Safely publish public data while ensuring security and control.
This powerful customer story on the Federal Senate of Brazil highlights how they leveraged Anonymous Access to map gender violence in Brazil.
Where Innovation Meets Magic!
Get ready for Qlik Connect 2025 at Disney’s Coronado Springs Hotel in Orlando, May 13-15!
Join us for three days of learning, networking, and big ideas—save the date, you won’t want to miss it!
Sign up now to be the first to know when registration opens and receive an exclusive VIP discount code!
Qlik Learning Opportunities and Discounts
Validate your Qlik Sense Skills
The Business Analyst and Data Architect Qualification Exams have been recently updated! Are you ready to validate your fundamental level of Qlik Sense skills? Take the new Qualifications exams and earn your digital Credly badge!
Limited-time Training Discounts
Until December 31st, Instructor-Led Training courses come with special discounts. Use your available credits to take advantage of this offer!
Our first Instructor-led Qlik AutoML course is ready for you to register with a limited-time offer!
In just one day, you will be able to:
- Understand what kinds of problems AutoML can solve.
Upcoming Customer Survey
Join Our Customer Survey: We Value Your Feedback!
We're excited to announce that we'll be launching our semi-annual customer survey on November 4th! This is your opportunity to share your thoughts and experiences with us, helping us better understand your needs and preferences.
Look out for our survey invitation!
-
Under the Hood of Qlik Cloud Data Services and Hybrid Data Delivery
Qlik Cloud Data Services and Hybrid Data Delivery Summary Qlik’s vision is to deliver a whole set of cloud services that make it easier for you to wo... Show MoreQlik Cloud Data Services and Hybrid Data Delivery Summary
Qlik’s vision is to deliver a whole set of cloud services that make it easier for you to work with data throughout your enterprise. The general term for a suite of related data services is EiPaaS, or Enterprise Integration Platform as a Service and Qlik Cloud Data Services is the umbrella name for Qlik’s EiPasS offering. Qlik’s EiPaaS is accessed from Qlik Cloud and uses many of the foundational services like catalog and Qlik Cloud Analytics.
Hybrid Data Delivery is the first Qlik Cloud Data Services offering that is designed to replicate data in near real-time from on-premises source systems directly into Qlik Cloud. The service automatically ingests on-premises data into your tenant, catalogs the data and transforms it into a QVD format immediately ready for consumption by Qlik analytics without the need for job scheduling or scripting. What’s more, these QVD files are automatically and continually updated whenever the source data changes without any manual intervention. They are quite literally active. Hence, we call them ActiveQVD’s. Consequently, your analytics apps will always have the most up-to-date data for action and insight, whenever you need it.
The Hybrid Data Delivery Architecture
Suffice to say the new service borrows heavily from our market-leading, high-performance, change data capture technology with a bunch of new components running in Qlik Cloud. Once you’ve defined your data pipeline within Qlik Cloud and remotely started the delivery tasks, data is automatically and continuously delivered in QVD format into your Qlik tenant. A stylized representation of a running ingest pipeline is below:
Now let’s peel the onion and dive a little deeper. The diagram below represents the major architectural elements of the new service. Our on-premises data sources are at the bottom of the picture: the databases, mainframes, enterprise apps etc. (currently the GA service supports relational sources only) and a server pre-installed with Qlik Replicate and Qlik Enterprise Manager. The Qlik Replicate server will “talk” to the data sources and the enterprise manager facilitates communication between Qlik Cloud and Qlik Replicate. The large grey box represents Qlik Cloud, with two white boxes: one represents the new data services and the other our analytics apps. The top left box represents an external cloud store, such as an AWS S3 bucket where raw change data is temporarily ‘’landed”. Solid lines represent data and metadata flow, while dashed lines represent control flows.
Incidentally, our vision is to rework the need for the current Qlik Replicate / Enterprise Manager combo and replace it with “headless” data gateway technology. The gateway acts as a data broker only, with all command and control driven by the Qlik Cloud User Interface. Stay tuned for more details.
Back to the diagram. Data flows clockwise and begins in Qlik Cloud with a new component called a Landing Asset. This correlates to a pre-defined, on-premises Qlik Replicate task that lands change data into an S3 bucket. Currently, the data service only allows you to remotely start and stop a task, (1) on the diagram. After the task is started, data is replicated to the landing zone whenever a change happens to the source database (2).
(3) highlights the data flowing into another new Qlik Cloud component called a Storage Asset. The Storage Asset performs many steps because it’s responsible for continuously fetching data from the AWS S3 bucket, transforming the change data to QVD format, cataloging the fetched tables, and storing the result. There are currently two options for storing QVD files:
- Qlik managed inside Qlik Cloud.
- Customer-managed AWS S3 buckets.
(My tip would be to stick with Qlik-managed for now 😊 )
Note: The Storage Asset synchronization process runs continuously but only applies the changes to the QVD in micro-batches after a change data partition is closed. The batch frequency is determined to the “configured interval” in the Qlik Replicate task.
Since the QVD’s are continually updated with data, we call them Active QVD’s. Once the Storage Asset creates and catalogs the Active QVD’s, then they are ready to be consumed by your analytics applications. Eventually, the goal is to have the analytics apps automatically refresh too.
I totally understand if this all sounds a bit complicated, and it would be far easier to see the solution in action. Well, today is your lucky day! @Michael_Tarallo has 2 great items for you. The first is a fantastic summary video and the second is a “Do More with Qlik - Webinar Recording” session dedicated to Hybrid Data Delivery.
You can sign up for future Do More Session here:
Click here for video transcripts
How Does Hybrid Data Delivery Compare to Qlik DataTransfer?
I’ve summarized the various ways to load data into Qlik Sense SaaS in the diagram below:
The goal of Qlik DataTransfer and Hybrid Data Delivery on the surface sound very similar, however, the use cases and scope are quite different. Qlik DataTransfer is a good utility for individuals to schedule data imports into Qlik Sense SaaS. But Hybrid Data Delivery is architected for the enterprise. The goal of Hybrid Data Delivery is to provide an enterprise-scale data movement solution that can import masses of on-premises data to Qlik Cloud, with future plans to stream data to other popular cloud platforms like Snowflake and Microsoft Azure Synapse.
What Happens to Qlik Data Integration?
Since I’ve just addressed Qlik DataTransfer, the other elephant in the room is to naturally ask about Qlik Data Integration. Firstly, Qlik Data Integration is not going anywhere. We’re adding new cloud services to complement our existing offerings. Our vision is to offer a Qlik hosted and managed EiPaaS (Enterprise Integration Platform as a Service). One that provides a single experience for all integration design patterns—including batch, streaming, CDC, ELT, ETL and a collection of data services (hybrid data delivery, transformation, application automation, data quality) to improve your analytics insights.
Starting today Qlik Sense Enterprise SaaS customers will see a new “Data Services” icon in the switcher menu of your tenant which will take you to the new Qlik Cloud Data Services home (below). From here you can explore the new user interface, watch getting started videos and read the documentation.
Conclusion
Every company is either building or re-evaluating their data and analytics infrastructure, but many still struggle to incorporate data from their historical enterprise infrastructure and applications which leaves an informational void. The new hybrid data delivery service, part of Qlik Cloud Data Services, can fill that gap by automatically and continuously supplying on-premises enterprise data in near real-time to your business-critical Qlik analytics applications.
Regards,
Clive Bearman
Product Marketing Manager -
Sales Dashboard
Sales DashboardPredoole Aanalytics Pvt LtdThe purpose of the sales dashboard is to provide a comprehensive overview of key sales metrics, enabling dec... Show MoreSales DashboardPredoole Aanalytics Pvt Ltd The purpose of the sales dashboard is to provide a comprehensive overview of key sales metrics, enabling decision-makers to monitor performance, identify trends, and take strategic actions. The app consolidates data related to sales revenue, customer insights, and performance indicators to ensure informed decision-making. Value of the Dashboard: Real-time Decision-Making: Access to up-to-date sales data allows for quick adjustments in strategy. Improved Sales Performance: By tracking key metrics, teams can optimize their efforts and improve overall sales productivity. Customer Retention and Growth: The dashboard provides insights into customer trends, helping improve retention and grow customer base. Strategic Planning: Helps in forecasting and long-term business planning through detailed revenue and performance insights.
Discoveries
Data Visualization Increases Decision-Making Speed: Visual representations of data make it easier for users to identify patterns, trends, and anomalies. Customer Segmentation Boosts Revenue: Understanding customer segments—such as top customers by revenue, region, or purchase behavior—enables more targeted sales and marketing strategies.
Impact
Salesperson Performance Metrics Increase Accountability: Clear performance tracking improves accountability, encouraging higher productivity and goal achievement. Management can easily identify top performers and areas needing coaching or development.
Audience
Sales Managers/Team Leads: Role: Responsible for overseeing the performance of the sales team, tracking key performance indicators (KPIs), and managing the sales pipeline. Need: They use the dashboard to monitor team performance, identify bottlenecks, track conversion rates, and take corrective actions if needed.
Data and advanced analytics
Improved Sales Forecasting and Planning Impact: Predictive analytics, powered by historical data, enables accurate sales forecasting, identifying potential revenue streams, future sales volumes, and market demands.
-
Introducing Conversational Analytics in Microsoft Teams
Conversational analytics give people a faster and easier way to ask questions, get insights, and make data-driven decisions using natural language – b... Show MoreConversational analytics give people a faster and easier way to ask questions, get insights, and make data-driven decisions using natural language – boosting adoption and unlocking the power of data for less sophisticated users. People can quickly ask questions in a simple manner and get answers even when they don’t know where to look for data. And you can now do this from any device that supports Teams – including mobile devices – to share and collaborate in real-time and take the best actions to capture the business moment.
With the new Qlik app in Microsoft Teams, you can do the following:
- Ask questions using natural language through individual or group chat
- Auto-generated data visualizations and natural language insights
- Search across all your Qlik apps for the right data
- Share insights and collaborate with others
- Access conversational analytics through mobile devices
- Natural language processing and generation in 10+ languages
Qlik helps accelerate BI, ML, and AI initiatives for Microsoft customers with a suite of solutions. As a long-standing, Microsoft Top Tier partner for the Azure Data+AI competency, our solutions have helped thousands of customers deliver data and analytics initiatives. Insight Advisor within Teams provides a powerful new way to help more people find the right answers, make better decisions and collaborate together where and how they work. Install the Qlik app from the Teams App Store to get started.
Microsoft Teams is another step in our ongoing strategy of helping organizations realize the power of AI – Qlik Staige. For more information on Staige, click here.
Microsoft Teams Integration - Part 1 - Initial Setup
Conversational Analytics Using Microsoft Teams Integration - Part 2 - Usage and Tips
If you can't see any of these videos because YouTube is blocked by your organization or region, you can view them here:
-
Upgrade advisory for Qlik Replicate 2024.5: Known issues
Edit 17th September 2024: Added Oracle-to-Oracle bidirectional tasks issueEdit 9th November 2024: Replaced expired links A set of problems were identi... Show MoreEdit 17th September 2024: Added Oracle-to-Oracle bidirectional tasks issue
Edit 9th November 2024: Replaced expired linksA set of problems were identified in the Qlik Replicate 2024.5 release and actively addressed.
If you are planning to upgrade or have already done so and are seeing unexpected behavior, please review the highlighted knowledge articles for details:
Qlik Replicate 2024.5 and DB2i Source Endpoint leads to conversion errors with NUMERIC Datatype
After an upgrade to Qlik Replicate 2024.5, capturing changes (CDC) for a Table defined on a DB2i Source leads to conversion errors with the NUMERIC Datatypes with precision and scale greater than zero.
To mitigate, upgrade to 2024.5 SP03 (GA). Download it here (expires: 1/31/2025).Read more here.
Qlik Replicate 2024.5 Upgrade SAP HANA Trigger Version 1 migrates to Version 3 CTS Mode
As a part of a Qlik Replicate upgrade to 2024.5, SAP HANA Source Endpoints using Version 1 configuration are converted to Version 3 CTS Mode.
To mitigate, upgrade to 2024.5 SP03 (GA). Download it here (expires: 1/31/2025).
Read more about the available workaround here.Qlik Replicate 2024.5 GA Build 144: Store Changes using the new use_manipulation_pk_for_apply Option
With Store Changes (see Change Processing) turned on for CDC tasks, Qlik Replicate tasks may crash or stop unexpectedly with the new feature use_manipulation_pk_for_applyenabled.
To mitigate, upgrade to 2024.5 SP03 (GA). Download it here (expires: 1/31/2025).
Read more about the available workaround here.Qlik Replicate tasks crash due to changes to the redo log format after installing Oracle July 2024 patch on Oracle 19
Qlik Replicate tasks using Oracle as a Source Endpoint fail after installing the Oracle July 2024 patch.
To mitigate, upgrade to 2024.5 SP03 (GA). Download it here (expires: 1/31/2025).
Read more about the issue here.Qlik Replicate 2024.05 and Oracle-to-Oracle: Bidirectional Tasks fail after upgrade
Oracle-to-Oracle bidirectional tasks fail after an upgrade to Qlik Replicate 2024.05. The tasks crash without an error or start failing with a duplicate constraint error on the attrep_loopback_prevention table.No workaround or solution is yet available. Qlik will provide a timeline for a patch at the end of September 2024.
Read more about the issue here.Don't hesitate to contact us if you have any questions or concerns about the upgrade. We will monitor this blog post for your queries.
Thank you for choosing Qlik,
Qlik Support -
1:1 Private Session with Expert Arthur Fantaci!
That’s right! On top of everything you’ll learn in the course and the live session, if you join the first edition of the course, you will also get a 3... Show MoreThat’s right! On top of everything you’ll learn in the course and the live session, if you join the first edition of the course, you will also get a 30-minute private session with Arthur Fantaci.
This is your chance to talk one-on-one with one of the top experts in Qlik AutoML, and the time will be all yours!
Why is this bonus so special?
During this 1:1 session, you will have the opportunity to:
- Talk about your own projects and get personalized advice on how to use Qlik AutoML in your daily work.
- Get direct feedback from Arthur to help you solve any specific problems or challenges you’re facing.
This is an exclusive opportunity you won’t find in just any course. Having an expert focused on you for 30 minutes could make a huge difference in how you apply what you learn and improve.
With these three bonuses, the first edition of the course will be unforgettable and will change the way you work with data. But remember, only the first 10 people who sign up for the November 13th session will get the full experience.
Don’t miss this amazing chance:
- 30% off when you use the code CLASSROOM30 at checkout.
- A live session with an expert, where a real Qlik AutoML case will be explained.
- 1:1 session with our expert to get specific feedback on your Qlik AutoML projects.
Sign up now and make sure you get all the exclusive bonuses. You don’t want to miss this!
-
WhatsApp for Qlik Answers
WhatsApp for Qlik Answers DataGlow IT WhatsApp for Qlik Answers gives you the power to converse with Qlik Answers assistants in a completely ope... Show MoreWhatsApp for Qlik AnswersDataGlow ITWhatsApp for Qlik Answers gives you the power to converse with Qlik Answers assistants in a completely open and conversational way through WhatsApp.Discoveries
Able to immediately interrogate Qlik Answers Assistants directly through WhatsApp. No browser or direct Qlik access needed!
Impact
Huge impact in customer service scenarios where it is not always possible to get a laptop out and interact with Qlik Answers natively. Great example is a field engineer that needs to request how to repair a particular model.
Audience
WhatsApp is a great option where mobility is an important part of the role. Also a preferred tool for those who are not "dashboard savvy" and don't want to have to log in and access systems to gain important insights on their unstructured data.
Data and advanced analytics
Inclusive access to Qlik Answers through secured Qlik APIs. Instant notification and convenience using WhatsApp.
-
Dissecting the New UI: Insights
In my most recent blog entry, we went over an overview of the new UI for Qlik Cloud. Today we’ll start a series of blog entries which will dive deeper... Show MoreIn my most recent blog entry, we went over an overview of the new UI for Qlik Cloud. Today we’ll start a series of blog entries which will dive deeper into the individual sections of the new UI starting with Insights. Insights is the first selection inside of the waffle menu comprised of five different sections: Home, Favorites, Collections, Browse and Alerts.
Starting from top to bottom, we’ll dive into the ‘Home’ select. Home is usually the first screen that users will see after signing into their tenant. Here users will find their apps and data sets along with any monitored charts they may have selected. In this home section, users can also select to ‘create page’ which will allow them to further customize a page for their home screen.
Continuing down the list, we’ll arrive at the ‘Favorites’ section. The Favorites section is comprised of the apps and charts that a user has selected as a favorite. To add the favorite tag to an app or a chart, users simply hover over the content you’d like to favorite and select the star.
After selecting the star, your content will appear in the Favorites section along with any other content that has been favorited.
The third section of Insights is ‘Collections’. Collections allow users to categorize their content and assign them to different collections for easier access and organization. To assign a piece of content to a collection, click the three dots on the content to bring up the menu then select ‘Add to collection’.
From there, a list of your collections will appear, simply select the collection you’d like to associate the piece of content with and it will appear in that collection.
Collections are a great way for users to organize their tenant when they have many apps and pieces of content they are working on.
The fourth section of Insights is called Browse. The ‘Browse’ sections allows users to view the various pieces of content they have loaded into their tenant. In this section, users can filter their content by name, space, types, and owner.
Furthermore, users can access the ‘All filters’ selection which will provide an extended selection of filters to narrow down their search even further.
Browse can be a great way for users to find the exact piece of content they are looking for without having to search through their entire catalog.
The fifth and final section of Insights is the ‘Alerts’ section. In this section users will find the various alerts that have been set up in their tenant. In this section, users can view and manage their alerts through a few selections and can be accessed by pressing the three dots at the end of each alert. Selecting any of these options will provide specific information on each metric of the alert while also allowing for the editing of this alert.
An alert can be set up inside of an app, connected to a visualization. To begin, find the visualization you’d like to connect to the alert, select the three dots in the top right-hand corner of the alert and select ‘Alerts’ in the menu that appears. From here, you’ll find the alerts already tied to this visualization or can select the option to create a new alert. Once you select ‘Create alert’ you’ll be taken to a menu allowing you to establish the various parts of the alert, ‘Details & Data’, ‘Conditions’, and ‘Distribution’.
After establishing these sections, your new alert will appear in the ‘Alerts’ section.
Alerts are a great way for users to stay up to date on their data, getting messages, emails and notifications on the parameters they set so they can stay knowledgeable about the content important to them.
Thank you for taking the time to read this blog entry, I hope that you learned something about the new Qlik Cloud and the new UI. Next time we’ll cover the Analytics section of Qlik Cloud.
-
Announcing a new Qlik Academic Program contact in the Americas!
Hello! I’m Brittany Fournier, the new Academic Program Project Manager at Qlik for the Americas. I have been part of the Qlik family for the past four... Show MoreHello! I’m Brittany Fournier, the new Academic Program Project Manager at Qlik for the Americas. I have been part of the Qlik family for the past four years, excelling in my previous role as a Business Development Representative where I coordinated customer meetings, nurtured executive relationships and built strategies.
With a Bachelor of Business Management degree from Worcester University in Massachusetts, I am well-equipped to lead our efforts in enhancing and expanding our Academic Program. My vision is clear: to grow and support the program by forging strong connections with universities, increasing our presence at current institutions, and collaborating with educators and students to promote what we offer.
On a personal note, I live in Massachusetts with my beloved dog, Tucker, who doubles as my loyal co-worker. Tucker’s favorite pastime is being close by my side as I navigate my day.
When I’m not busy at work, I have a variety of hobbies that keep me engaged. I enjoy getting lost in thrillers and historical non-fiction books, cultivating my gardening skills (especially my passion for roses—just ask me about them!), and cheering for my favorite football and baseball teams. Additionally, I love expressing my creativity through arts and crafts.
I am excited to use my passion and expertise to drive our Academic Program to new heights. If you have any questions about the program or would like to discuss ways that I can support you, please do not hesitate to reach out to me!
Here’s to a bright future together!
To learn more about the Academic Program go to qlik.com/academicprogram
-
New Addition to Automations: Chart image support
Announcing a significant enhancement to Qlik Application Automation with the introduction of the Get Chart Image block in the Qlik Reporting connector... Show MoreAnnouncing a significant enhancement to Qlik Application Automation with the introduction of the Get Chart Image block in the Qlik Reporting connector. This new feature allows users to generate chart images directly within their automation workflows, streamlining the process of sharing visual insights.
Key Features
Generate Chart Images: Easily create images from your charts without the need for manual screenshots or additional tools.
Distribute Effortlessly: Utilize various connectors within Qlik Application Automation to share these images across multiple platforms, including popular chat tools like Slack and Microsoft Teams.
Embed in Emails: Seamlessly embed chart images into HTML emails, ensuring that your recipients receive immediate visual insights.
Store in Cloud Services: Safeguard your generated images by storing them on cloud storage solutions such as Microsoft SharePoint, Amazon S3 or Dropbox.
This update significantly enhances the reporting process by enabling:
- Automation of Workflows: Automate the entire cycle from data analysis to chart generation and distribution, saving valuable time and reducing potential errors.
- Real-Time Collaboration: Keep your team informed with up-to-date visualizations shared through their preferred communication channels.
- Flexibility and Accessibility: Easily access and share insights across various platforms, making data-driven decision-making more efficient.
More information on using the block and example automations are available on Qlik Community.
-
Handling Multiple Languages
Today’s corporate environment is global. QlikView application developers are required to support many regions and many languages. So how does a QlikVi... Show MoreToday’s corporate environment is global. QlikView application developers are required to support many regions and many languages. So how does a QlikView application developer handle multiple languages? Well, that depends on how the data is captured and the overall goal of the application developer. Let’s look at two scenarios.
Scenario 1: The developer only needs to translate the labels and textboxes within the application and not the actual data.
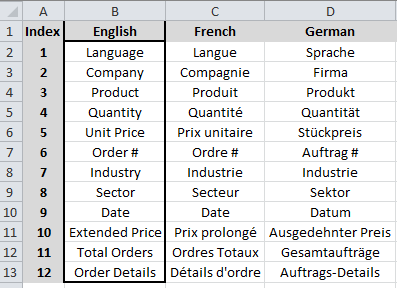
- Create a translation spreadsheet that contains an index column to be used for reference and columns for every language that each label and text entry that needs to be translated.
- Fill in the English language column with the text to be translated and have translators fill out their language.
- In the script load the translation spreadsheet and create an inline table that contains all of the language translations. Then create a variable, say vDataLanguage, that reads the Language field.
- Using set analysis, create an expression that references the index number and the language to display
=Only({<Index={12}>} [$(=vDataLanguage)])
for all textbox and object captions that need to be translated.
Scenario 2: The data from which the QlikView application developer is developing is recorded in English but he/she needs to have some of the actual data translated into other languages.
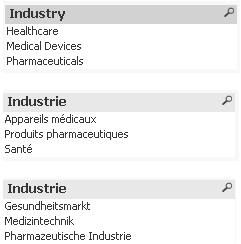
- The first thing that he/she needs to do is determine the fields that need to be translated and create a translation spreadsheet that contains a worksheet for each of the fields to be translated. For example, we need to translate the Industry data. Now we need to load the data translation file into QlikView as a Mapping Load for each language. For this example we need to translate into German and French so we’ll create a mapping file for French_Industry and a mapping file for German_Industry.
- Create an inline table that contains all of the language translations.
- Create a variable that reads the Language field (vDataLanguage).
- In the script, find the Industry Field that we need to translate. Using the Applymap function we can translate the English data into the different languages and be sure to name the translated field as Fieldname_Language (e.g. Industry_French) .
- We now need to create a variable for each translated field. So for industry we’ll create vIndustry. The expression in vIndustry is
=chr(91)&'Industry' &chr(95) & '$(vDataLanguage)' & chr(93) . - Now to get the correct language to display in a list box you need a calculated dimension using this expression, which is
=$(vIndustry).
That’s it! Easy, right? Well, it is a bit time consuming if you are trying to translate data in fields but translating text and labels is really not that difficult. I created a technical overview that walks you through the two scenarios mentioned in this blog as well as a third scenario which can be found here. This resource includes a How-To, sample data files and 2 QVWs.
Good luck with the translations! Lycka till med översättningarna! 翻訳で頑張ってください!

-
Chart Level Scripting - Use Cases, Samples and Examples
Hi Guys - I'd like to introduce you to some use cases, samples and examples of Qlik Sense Chart level scripting courtesy of Qlik Solution Architect, V... Show MoreHi Guys - I'd like to introduce you to some use cases, samples and examples of Qlik Sense Chart level scripting courtesy of Qlik Solution Architect, Venkat Subharaman. You can learn more about Venkat at then end of this blog.
Recently we released a new capability in Qlik Sense, that allows you to provide and manipulate data directly within a chart object using script. It allows users to modify the data set behind a chart using a subset of the Qlik scripting language, using techniques such as variables and loops. Rows and columns can be added or modified that were not in the original data set enabling calculations that have previously not been possible in chart expressions or with variables. Offering a new way to analyze your data such as simulations and goal seeking.
Venkat was so excited when he developed a few use cases for Qlik Sense Chart level scripting and worked out a few examples he wanted to share with everyone that might need them. (attached to this post)
Note that official documentation is available on the Qlik Help site and additional examples will be made available so stay tuned.
I'd like to thank Venkat for his valuable contribution. Take it away Venkat!
With Chart level scripting I can create simple data models and write complex logics on a subset of data on the fly. Here are some of the benefits:
- Customization
- Flexibility
- Maintainability
I have found it especially useful where working with financial reports when performing the following:
- Running totals (Sounds so simple)
- I have more complex % to be calculated based on business rules
- I want calculation on the current row to be based on the rows above or below.
Traditionally I can use out-of-the-box functions like RangeSum and achieve the desired result. BUT, depending on the business use case and the requirements, formulas can get complex very quickly. Even though our we achieved the desired result, it is always at the back of my mind how will it be maintained going forward if something changes.
Chart Level Scripting gives you a simple way of doing complex calculation with the added ease of working with just a small subset of data that is utilized in the chart or table.
Let's take a look at 3 simple examples that will highlight only a small percentage of the power of Chart level scripting.
First I want to just set the stage and familiarize you with some terminology and functions.
- HCNoRows(): returns the number of rows in the chart or table
- HCValue : Function that is used to return the value in a row for a dimension or measure
- HC1: Prefix used to represent the subset of data from the Hyper Cube that is utilized in the current chart or table.
- HC1.Measure.<MeasureNo> : Represents the measure in the chart or table
- HC1.dimension.<dimensionNo> : Represents the dimension in the chart or table
Example 1: Running total and percentage calculated at aggregate level
Steps:
- Assumption : Enabled Chart Level Scripting
- I have created a straight table with
- Dimensions: Division and Financial Month
- Measure: Actuals (Sum(Actuals))
- Create 2 additional dummy measures
- Additional Measure 1: Give Sum(0) as the Expression and Running Total as the label
- Additional Measure 2: Give Sum(0) as the Expression and % as the label
- Copy the script from the attached Example1.txt in the attached .zip file.
Add the division filter and select the required division, you will see that the totals and % will be re calculated and will adapt as per the selections. In the above example we just created running totals and percentage at the total level. Let us look at example 2 where we will do the calculation at the aggregate level as well as at the divisional level.
Example 2: Running total and percentage calculations at the aggregate level and at the divisional level
Steps:
- Assumption : Enabled Chart Level Scripting
- I have created a straight table with
- Dimensions: Division and Financial Month
- Measure: Actuals
- Create 2 additional dummy measures
- Additional Measure 1: Give Sum(0) as the Expression and Running Total as the label
- Additional Measure 2: Give Sum(0) as the Expression and % as the label
- Additional Measure 3: Give Sum(0) as the Expression and Divisional Total as the label
- Additional Measure 4: Give Sum(0) as the Expression and Divisional % as the label
- Copy the script from the attached Example2.txt in the attached .zip file.
Now the totals will be calculated at the aggregate level and at the Divisional Level.
Please note that I have just written the script in a simple fashion to showcase the functionalities like
- Control statements
- Regular statements
- Prefixes (We will look at this in example 3)
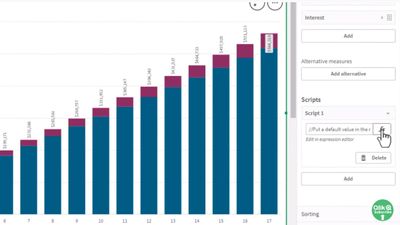
Example 3: Aggregated measures and dimensions in a bar graph
Steps:
- Assumption : Enabled Chart Level Scripting
- Drag and drop a bar graph on a sheet and
- Dimensions: Financial Month
- Measure: Actuals
- Copy the script from the attached Example3.txt in the attached .zip file.
The above 3 samples are simple uses cases to showcase the power of chart level scripting. Share with me your use cases where you can apply Chart level scripting .
In summary Chart level scripting provides a simpler and compact way of solving specific business problems.
Happy Qliking!!!!!!!!!
Useful References
- Turning on chart level scripting ‒ Qlik Cloud
- Using chart level scripting and Limitations of Chart Level Scripting ‒ Qlik Cloud
- Chart level scripting ‒ Qlik Cloud
About Venkat
Venkat is a Solution Architect, currently working with the presales team at Melbourne (Australia), having a broad experience in leading and systematizing BI Initiatives. With 25+ years of experience. Venkat has participated in various development projects & has played a key development role in the Enterprise Level Data warehouse & Business Intelligence Applications. Venkat has a deep interest in research and data analysis, drawing actionable insights from the raw data to help further the business’ goal.
www.linkedin.com/in/venkitasubharaman
-
Qlik Sense Enterprise for Windows - New Security Patches Available Now
Edited August 30th, 15:55 CET: Added clarification on older Qlik Sense Enterprise on Windows versionsEdited August 31st, 13:10 CET: Added clarificatio... Show MoreEdited August 30th, 15:55 CET: Added clarification on older Qlik Sense Enterprise on Windows versions
Edited August 31st, 13:10 CET: Added clarification on possible workarounds (none exist) as well as information regarding what authentication methods (all) are affected and that HTTP and HTTPS are impacted
Edited November 21st, 8:40 CET: Added clarification to apply the latest patchesHello Qlik Users,
Two security issues in Qlik Sense Enterprise for Windows have been identified and patches made available. Details can be found in Security Bulletin Critical Security fixes for Qlik Sense Enterprise for Windows (CVE-2023-41266, CVE-2023-41265).
This announcement from August 2023 and the mentioned releases only cover CVE-2023-41266 and CVE-2023-41265. Apply the most recent patches as documented in Critical Security fixes for Qlik Sense Enterprise for Windows (CVE-2023-48365) (September 2023), which resolve CVE-2023-48365 as well.
Today, we have released five service releases across the latest versions of Qlik Sense to patch the reported issues. All versions of Qlik Sense Enterprise for Windows prior to and including these releases are impacted:
- May 2023 Patch 3
- February 2023 Patch 7
- November 2022 Patch 10
- August 2022 Patch 12
All prior versions of Qlik Sense Enterprise on Windows are affected, including releases such as May 2022, February 2022, and earlier. While no patches are currently listed for these versions, Qlik is actively investigating the possibility of patching older releases.
No workarounds can be provided. Customers should upgrade Qlik Sense Enterprise for Windows to a version containing fixes for these issues. August 2023 IR released today already contains the fix.
- August 2023 Initial Release
- May 2023 Patch 4
- February 2023 Patch 8
- November 2022 Patch 11
- August 2022 Patch 13
This issue only impacts Qlik Sense Enterprise for Windows. Other Qlik products including Qlik Cloud and QlikView are NOT impacted.
All Qlik software can be downloaded from our official Qlik Download page (customer login required). Follow best practices when upgrading Qlik Sense.
The information in this post and Security Bulletin Critical Security fixes for Qlik Sense Enterprise for Windows (CVE-2023-41266, CVE-2023-41265) are disclosed in accordance with our published Security and Vulnerability Policy.
Clarifications and Frequently Asked Questions:
What can be done to mitigate the issue?
No mitigation can be provided. An upgrade should be performed at the earliest. As per Qlik's best practices, the proxy should not be exposed to the public internet, which reduces the attack surface significantly.
What authentication methods are affected?
All authentication methods are affected.
Are environments with HTTP disabled impacted?
Environments will be affected regardless if HTTP or HTTPS are in use. These vulnerabilities affect the HTTP protocol overall, meaning even if HTTP is disabled, the environment remains vulnerable.
These attacks don’t rely on intercepting any communication, and therefore, are indifferent whether the HTTP communication is encrypted or not.
Kind regards, and thank you for choosing Qlik,
Qlik Global Support
-
Expert Arthur Fantaci Joins the First Qlik AutoML Session!
As part of this special edition, we’ve added an extra live session with Arthur Fantaci, one of our top experts. He will share a fascinating success st... Show MoreAs part of this special edition, we’ve added an extra live session with Arthur Fantaci, one of our top experts. He will share a fascinating success story in which he used Qlik AutoML to solve a big challenge in the healthcare industry.
What’s the story?
Arthur worked with a healthcare media company that needed to sort its anonymous website visitors into medical specialty groups. At first, they used 12 different machine learning models to do this, but the process was slow, manual, and full of errors. With Qlik AutoML, Arthur created an automated solution that reduced the 12 models to just one, making everything faster and more accurate!
Why is this bonus so awesome?
Getting to see how an expert tackles a real-world problem is something you don’t find in just any course. Plus, you’ll be able to ask questions live, clear up any doubts, and take away practical lessons that you can start using right away!
Arthur Fantaci is usually busy helping our clients, so having him in this course is a huge privilege. His experience in predictive analytics is something that won’t be available again for a long time.
Don’t miss this amazing chance:
- 30% off when you use the code CLASSROOM30 at checkout.
- A live session with an expert, where a real Qlik AutoML case will be explained.
- And one big surprise that we will reveal soon!
Don’t wait—sign up now and grab this amazing opportunity!
-
Connector Factory - August & September 2024 releases
Qlik Talend Data Integration Additional Qlik Talend Cloud application connectorsWe’re continuing to expand the connectivity of Qlik Talend Cloud with ... Show MoreQlik Talend Data Integration
Additional Qlik Talend Cloud application connectors
We’re continuing to expand the connectivity of Qlik Talend Cloud with the addition of more insurance and security-related applications that can now be used as a data source. By eliminating the need to develop custom connectors to access these sources, these connectors will help companies streamline their insurance workflows and accelerate their ability to fully assess security risks & compliance. The new connectors are for:- AWS Security Hub
- Guidewire BillingCenter
- Guidewire ClaimCenter
- Guidewire InsuranceNow
- Guidewire PolicyCenter
- Invicti
- LevelBlue USM Anywhere (formerly Alienvault)
- Microsoft InTune
- Sophos
Support for key pair authentication with Snowflake
Qlik Talend Cloud now provides support for key pair authentication when connecting with Snowflake. Using key pair authentication provides enhanced security versus basic authentication, such as username and password. This key pair approach is recommended for workloads such as data loading (replication or landing tasks) and transformations.Qlik Analytics
New version of Direct Access gateway
The Qlik Data Gateway - Direct Access allows Qlik Sense SaaS applications to securely access behind-the-firewall data, over a strictly outbound, encrypted, and mutually authenticated connection. We just released Direct Access gateway 1.6.8 which, in addition to several bug fixes, introduced the following enhancements:- Support for sending missing or corrupted data chunks.
- Removes the requirement for .NET 6.0.x. New customers should install .NET 4.8 (needed for the installation) as well as .NET 8.0 and ASP.NET Core Runtime
- Improved batch operations for dependent processes by checking them in parallel instead of sequentially
- Improved troubleshooting by adding more context to the resource usage warnings in the logs.
Qlik Application Automation
Updated Connectors
- Qlik Cloud Government now supports the Qlik Application Automation connector for Amazon DynamoDB.
- The Qlik Cloud connector now has blocks to download, import and upload a file from temporary content
- The Qlik Reporting connector now has a Get Chart Image block. You can learn more about this new feature here.
- The Slack connector now has an Upload File to Channel block
- One can now create webhooks in the management console of target tenants using the Qlik Platform Ops connector
-
Social networks analysis
Social networks analysisActium DigitalThis application is used Instagram, Twitter and Google analytics. Folowers, posts and visits.DiscoveriesYou can ... Show MoreSocial networks analysisActium DigitalThis application is used Instagram, Twitter and Google analytics. Folowers, posts and visits.Discoveries
You can analyze visits to your web, views to you instagram profile
Impact
You can review impact on your posts.
Audience
Marketing people
Data and advanced analytics
You can check most visited pages on your web
-
Learning from hackathons is the new trend
In recent times, there have been hackathons being organised by colleges on various topics and technologies. Clearly, there is a big interest from stud... Show MoreIn recent times, there have been hackathons being organised by colleges on various topics and technologies. Clearly, there is a big interest from students and professors to organize such events. One of the key reason is that the academic community feels that this is a great way to learn and engage the student community.
According to digit.in, there are several benefits of a hackathon and they are as follows:
1. Learning a new technical skill2. Creating a sense of accomplishment
3. Enhancing your soft skills
4. Beefing up your resume
5. Networking
6. Paving the path for a start up
7. Getting inspired
8. Giving back to the community
9. Winning a prize
10. Having fun
One of Qlik's academic partners, ICT Academy's CEO, Mr V Srikanth, mentioned in a recent article in The Times of India, that Learning based on Hackathon is the way forward.
The Qlik Academic Program has collaborated for three hackathons ( datathons) this year with Anurag Engineering College, Hyderabad, Kristu Jayanti College, Bangalore and the third one coming up with VJIT Hyderabad. There has been a good amount of participation in all these events. Students are more engaged, they are able to present their outcomes and get feedback on their creations from experts.
Overall, this is a win win for everyone and in some cases, prospective employers are able to gauge the skills of students from an event and offer opportunities. This way, hackathons have many benefits and are clearly a great way to engage students and make them industry ready.
For information on the Qlik Academic Program and to find out the resources including training and certifications for students and professors, please visit: qlik.com/academicprogram
-
Qlik Cloud 9月の新機能
分析の新機能 コンボチャートの改善 お客様の要望に基づき、コンボチャートが改善されました。 マーカーに値ラベルを追加 積み上げ棒の値ラベルを追加 グリッドの幅の設定を追加 選択バーの改善 選択バーの選択された項目の表示名に、マスターアイテムで指定したラベル名が表示されるようになりました。オ... Show More分析の新機能
コンボチャートの改善
お客様の要望に基づき、コンボチャートが改善されました。
- マーカーに値ラベルを追加
- 積み上げ棒の値ラベルを追加
- グリッドの幅の設定を追加
選択バーの改善
選択バーの選択された項目の表示名に、マスターアイテムで指定したラベル名が表示されるようになりました。オートカレンダーの項目などについてもすっきりした項目名で選択バーに表示することができます。
Qlik AutoML のアップデート
ML展開内のモデルの承認として、アクティブ化・非アクティブ化する機能が追加されました。ML展開を開くと、モデル承認のステータスが表示され、権限があればステータスを変更することができます。管理者は契約による使用可能なモデル数と使用数をみながら承認するモデルの数をコントロールすることができます。
- アクティブ: モデルはアクティブ化されており、予測を生成できます。
- 非アクティブ: モデルは非アクティブ化されており、予測を生成できません。
- リクエスト済み: モデルの承認はリクエストされていますが、まだ提供されていません。
学習データをcsv、qvd、parquet ファイルにエクスポートできるようになりました。ML実験の比較または分析タブから出力できます。
組み込み分析で、ユーザーが選択したUI言語にローカライズされるようになりました。
データゲートウェイ直接アクセス
Direct Access gateway 1.6.8 がリリースされ、下記の機能が導入されました。
データチャンクの復旧メカニズム
欠損または破損したデータチャンクの送信がサポートされました。再読み込みデータチャンクのメモリ使用量を制御するため、設定ファイル(configuration.properties)に新しいプロパティ「RELOAD_CACHE_MEMORY_MB」が追加されています。
.NET 6.0.x が不要に
Direct Access Gateway の実行には .NET 6.0.x が不要になりました。新規導入には、.NET 4.8(インストールに必要)と、.NET 8.0 および ASP.NET Core ランタイム(Direct Access Gateway の使用に必要)をインストールしてください。
依存プロセスのバッチ処理の改善
このバージョンでは、依存プロセスが順次ではなく並行して確認されるようになり、実行時にプロセスリストが変更されることによる例外処理が回避されます。
トラブルシューティングの改善
ログのリソース使用警告に「プロセスID」や「コミットサイズ」など、より多くの情報が追加されました。
その他
プラットフォーム ナビゲーションの変更
新しいプラットフォーム ナビゲーションがすべてのテナントの規定になりました。
シートボタンの削除
[シート] ボタンは表示されなくなりました。代わりに、左側の [アセット] ボタンを使用してください。
新しいピボットテーブルの改善(Visualization bundle)
画像やPDFのダウンロード、ストーリーテリングのスナップショット、レポートのサブスクライブ、ハブのチャート監視に対応しました。
レイアウトコンテナの改善
チャートがプロパティ・パネルのリストで選択されると、コンテナ内でハイライトされるようになりました。
データ統合の新機能
変換タスクビューの改善
変換タスクのビューで、系列が可視化されるようになりました。
- ソース データセットからターゲット データセットへのフローを視覚化するためのすべての変換が表示されます。
- 変換を選択すると、どのソース データセットが使用され、どのターゲット データセットが作成されるかを確認できます。
- ソースを選択すると、そのソースが使用されているすべての変換と、結果のターゲットが表示されます。
ターゲットを選択して、ソース データセットと、このターゲット データセットを作成した変換を確認します。
変換・マート作成タスクのターゲットベースデータモデル
変換およびデータ マート タスク用の新しいデータセット モデルであるターゲット ベース モデルを導入します。変換とデータ マート タスクがより自己完結的になり、ソース メタデータの変更の影響を制御できます。
ターゲットベースデータモデルでは、データセット メタデータはソース メタデータの変更から分離され、ターゲット データセットは、ソース データセットから明示的にマッピングされます。
ソースに対して列が追加または削除されても、次のダウンストリーム タスクに自動的に伝達されず、必要に応じてマッピングを調整できるようになります。また、列の順序を変更することや、データ ソースを置換することができます。
- ランディングやストレージのような取り込みタイプのタスクや、既定の列が維持されている場合(例:SQL 変換で SELECT * from XYZ を使用)は、ソースベースのデータモデルとなります。
- 変換やマート作成タスクで、SQL 変換または変換フローが列選択を実行する場合(例: SQL 変換で SELECT A, B, C from XYZ を使用)、データセットはターゲットベースになります。
既存のプロジェクトは条件に該当する場合は、プロジェクトをはじめて開くときに新しいデータセットモデルに更新されます。
変換フローにAIプロセッサーの追加
Databricks プラットフォームを利用した変換フローに下記のAIプロセッサーが追加されました。
- sentiment analysis
- grammar issues fix
- translation
- text summary
- string similarity
- data masking
- classification
データ製品カタログのリリース
データ製品とは、同じドメインに関連する信頼できるデータセット、またはビジネスに適した任意のグループを収集してパッケージ化できるエンティティのことです。データ製品を使用するには、Qlik Talend Cloud Enterprise サブスクリプションが必要です。
- データマーケットプレイスで、データ製品マネージャーがデータを選択して、追加情報を付加してデータ製品を作成し、コンシューマーに提供します。
- データ製品からデータのプロファイルやサンプル、系列と影響分析を確認できます。
- Snowflakeについてはデータ品質が計算され、有効性と完全性を確認することができます。
- 選んだデータからすぐに分析アプリを作成することができます。
その他の機能改善
テーブル再作成の強化
データパイプラインの画面からテーブルの再作成をできるようになりました。テーブルを再作成すると、ダウンストリーム タスクは、ソース データセットで切り捨てとリロードのアクションが実行されたかのように動作します。これまでは、タスクを開いてテーブルを再作成する必要がありました。
複数のテーブルからメタデータを並行して取得するサポート
メタデータを複数のテーブルから問題なく並行して取得できるようになりました。以前はエラーが発生することがありました。
Snowflake のキーペア認証をサポート
キーペア認証は、ユーザー/パスワードよりも堅牢です。この方法は、データロード(レプリケーションまたはランディングタスク)や変換などのワークロードに推奨されます。