Unlock a world of possibilities! Login now and discover the exclusive benefits awaiting you.
Analytics & AI
Forums for Qlik Analytic solutions. Ask questions, join discussions, find solutions, and access documentation and resources.
Data Integration & Quality
Forums for Qlik Data Integration solutions. Ask questions, join discussions, find solutions, and access documentation and resources
Explore Qlik Gallery
Qlik Gallery is meant to encourage Qlikkies everywhere to share their progress – from a first Qlik app – to a favorite Qlik app – and everything in-between.
Qlik Community
Get started on Qlik Community, find How-To documents, and join general non-product related discussions.
Qlik Resources
Direct links to other resources within the Qlik ecosystem. We suggest you bookmark this page.
Qlik Academic Program
Qlik gives qualified university students, educators, and researchers free Qlik software and resources to prepare students for the data-driven workplace.
Recent Blog Posts
-
Sheet Actions
I am always learning something new when it comes to Qlik products. This week, while working with a colleague, I learned about the sheet action “select... Show MoreI am always learning something new when it comes to Qlik products. This week, while working with a colleague, I learned about the sheet action “select values matching search criteria” that I had never used before, so I decided to blog about it. I have used sheet actions in the past to clear selections or to select a bookmark when navigating to a sheet, but this sheet action performs a search to make selections. My colleague needed to make a series of selections to include and exclude data based on specific criteria. Using this sheet action, he was able to execute a complex expression to make selections on a sheet saving the users time when they navigate to that sheet.
Up to five actions can be added and they will run in the order they are listed. Sheet actions can be added from the Properties panel of a sheet. In this example, I have 3 actions.
Quantity > 100 action
Babywear action
Year action
In the first action, I am selecting quantities greater than 100. Notice in the Quantity > 100 action that single quotes are required when using an expression for the search criteria. It is possible for an action to deselect a previous action. For example, the first action selects 110, 120, 130 and 150 from the Quantity field. Then, in the second action, Babywear is selected from the CategoryName field, deselecting 110, 130 and 150 from the Quantity field. The last action selects 2021 from the Year field which deselects Babywear. So once all the actions are performed, these are the selections made.
Here is a list of all the sheet actions that are available:
- Apply bookmark – Apply an existing bookmark when navigating to a sheet.
- Clear all selections – Clear all selections when navigating to a sheet.
- Clear selections in other fields – Clear all selections from all fields except the one specified.
- Move forwards in your selections – Move one step forward in selection history.
- Move backwards in your selections – Move one step backwards in your selection history.
- Clear selections in field – Clear all selections from a specified field.
- Lock all selections – Lock all selections in the app.
- Unlock all selections – Unlock all selection in the app.
- Unlock a specific field – Unlock selections in a specified field.
- Select all values in a field – Select all values in a specified field.
- Select values in a field – Select value(s) in a specified field.
- Select values matching search criteria – Select values that match specified search criteria.
- Select alternatives – Select alternative values in a specified field.
- Select excluded – Selected excluded values in a specified field.
- Select possible values in a field – Select possible values in a specified field.
- Toggle field selection – Set a button to toggle between current selections and a selection that adds selections defined by a search string.
- Set variable value – Assign a value to a variable.
Most of these are very straightforward but you can find more details on sheet actions in Qlik Help. Some important things to note:
- You cannot set an action based on the results of another action because they are all evaluated before they are performed.
- Sheet actions will not be triggered if the sheet is used in a mashup or an embedded sheet.
- Some of these actions give you the option to override locked selections. See Qlik Help for list.
- You cannot use fields with date, timestamp, or money data type.
With the “select values matching search criteria” sheet action, you can use an expression or simply a value to search for and make selections in a specified field. This can be useful if you have a sheet in your app designed to perform a specific analysis that requires some selections to be made to begin. Using an action makes it easier for the user to get started and leaves little room for error by forgetting to make needed selections. I love that I am always learning something new with Qlik. Try out sheet actions in your app to automatically apply selections.
Thanks,
Jennell
-
Get More Control with New Macros in Qlik Cloud Data Integration
Introducing Initial and Incremental Load Macros The main enhancement is the addition of two macros – one for initial loads (Q_RUN_INITIAL LOAD) and th... Show MoreIntroducing Initial and Incremental Load Macros
The main enhancement is the addition of two macros – one for initial loads (Q_RUN_INITIAL LOAD) and the second for incremental loads (Q_RUN_INCREMENTAL). These macros allow you to customize what logic executes during initial loads when tables are first built, vs incremental runs that process new or changed data.
To use them, simply wrap any logic unique to initial or incremental loads in the corresponding macro tags. For example:
SELECT * FROM orders
{{#QLIK_FUNC_IF Q_RUN_INCREMENTAL}}
WHERE update_tx > DATEADD(day, -1,GETDATE())
{{/QLIK_FUNC_IF}}
This query would select all order records during initial loads, but only newer records from the past day for incremental updates. The macro tags tell QCDI to only apply that filter logic when running incrementally.
Benefits of Load-Specific Macros
These new macros provide two major benefits:
- Improved efficiency by limiting incremental data volumes
- More flexibility to tailor logic independently
With macros, you can significantly reduce the data processed incrementally by filtering or sampling datasets. QCDI still performs change detection on the subset but avoids reprocessing your full history each run.
You also gain more flexibility to customize SQL logic independently for initial and incremental loads. For example, you may want to:
- Add filters or joins only for incremental loads
- Map columns or calculate values differently
- Union data sets only during initial loads
- Use different table variants like change history
The possibilities are endless since you can fully customize the SQL within each macro!
Incremental Load Patterns and Examples
Let’s walk through some example patterns that leverage the new macros:
-
Limit to recent changes only
Filter to only new or recently modified records, reducing incremental data volumes.
SELECT * FROM orders
{{#QLIK_FUNC_IF Q_RUN_INCREMENTAL}}
WHERE update_tx > DATEADD(day, -1, GETDATE())
{{/QLIK_FUNC_IF}}
-
Use different tables
Join the history table for initial loads, and for incremental loads leverage the current records using from/to time stamps.
{{#QLIK_FUNC_IF Q_RUN_INITIAL_LOAD}}
SELECT oh.*, ch.* FROM orders_history oh
JOIN customers_history ch ON oh.CUST_ID = ch.CUST_ID
{{/QLIK_FUNC_IF}}
{{#QLIK_FUNC_IF Q_RUN_INCREMENTAL}}
SELECT o.*, c.* FROM orders o
JOIN customers c ON o.CUST_ID = c.CUST_ID
WHERE o.OrderTimestamp >= DATEADD(DAY, -1, CAST(GETDATE() AS DATE)) AND o.OrderTimestamp < CAST(GETDATE() AS DATE);
{{/QLIK_FUNC_IF}}
-
Add derived columns
Calculate or set values differently on initial load versus incremental loads
SELECT od.ODID, o.ORDERID, od.PRODUCTID, od.QUANTITY, o.ORDERDATE,
{{#QLIK_FUNC_IF Q_RUN_INITIAL_LOAD}} 'INIT' as LOADED_BY
{{/QLIK_FUNC_IF}}
{{#QLIK_FUNC_IF Q_RUN_INCREMENTAL}} 'INCR' as LOADED_BY {{/QLIK_FUNC_IF}}
FROM ${ORDERS} o
JOIN ${ORDER_DETAILS} od ON o.ORDERID= od.ORDERID
{{#QLIK_FUNC_IF Q_RUN_INCREMENTAL}}
WHERE o.ORDERDATE > DATEADD(hour, -12, CURRENT_TIMESTAMP())
{{/QLIK_FUNC_IF}}
Get Started with Macros Today
The new macros enable you to greatly improve incremental processing efficiency and flexibility in QCDI. You can start applying them to your custom SQL tasks today using the latest QCDI release.
For more information, please refer to the Qlik Cloud Data Integration documentation. We can’t wait to see all the innovative ways our users will leverage macros to optimize their incremental data pipelines!
Check out a self-guided tour of Qlik Cloud Data Integration here.
-
Join Me Next Week November 1st 10AM ET - for Set Analysis Redux on the next Do M...
Registered now! Hey guys! Just a quick note to join me next week Wed, November 1st at 10AM ET for the next Do More with Qlik webinar. I’ll be covering... Show MoreHey guys! Just a quick note to join me next week Wed, November 1st at 10AM ET for the next Do More with Qlik webinar. I’ll be covering Set Analysis, which allows users to perform advanced and customized analysis on their data. I’ll kick it off with some of the basics and then I’ll focus on the improvements and new features that make it even easier to use, including some #AI capabilities to help generate the analysis for you. So please join me next week November 1 at 10 AM ET – you don’t want to miss it.

-
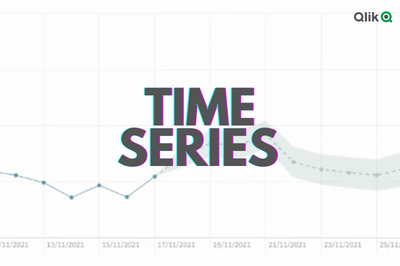
Time Series Analysis in Qlik Sense
What is Time Series Analysis? Time series analysis helps us understand and learn about the changes in our data over time. It involves collecting data ... Show MoreWhat is Time Series Analysis?
Time series analysis helps us understand and learn about the changes in our data over time. It involves collecting data points at consistent intervals over a set period of time, and using statistical methods to identify trends, patterns, and relationships in the data.
Time series analysis can also be used for forecasting future data based on historical trends and patterns as we will see later in this post.
Qlik Demo showing UK Crime trends: Explore demo here
Where can it be used?
Time series is used in a variety of industries, including finance, economics, retail, and meteorology, to help understand trends/patterns or make predictions and forecasts based on historical data, or simply to develop insights into how things change over time.
For instance Retailers can use time series data in a number of ways to support their decision making and improve business performance, including:
- Sales forecasting to project sales trends in the future and predict demand, plan for inventory, and optimize supply chain to avoid overstocking or shortages.
- Customer behavior analysis to understand how their customers’ habits change over time and identify spending habits and purchasing patterns which can help optimize marketing targeting efforts.
- Pricing analysis to understand how prices change over time affect sales and customer behavior.
- Inventory management to identify demand for specific products.
Ways to visualize Time Series data:
When it comes to looking at time-based data, we usually tend to use a Line Chart as it offers a simple and quick way to view changes related to a measure (Y-axis) over the course of time (X-axis).
Avg Temp over time comparison between 3 countries
Other charts however can help visualize the information better, here are some examples:
- A heatmap chart as seen on Github’s commit history shows a darker colored squares when more commits are made during a day and lighter color for less commits allowing us to easily notice the more productive days.
- A simple slope chart can be used when the time interval is limited and we want to see direct transitions over time, for instance comparing total sales data by industry between two years. Check out my other post to learn more about how this slope chart was created using Qlik's open source libraries.
Time Series Forecasting in Qlik Sense
Time series forecasting allows us to predict where a particular metric is going to be in the future based on historical data.
Qlik Sense makes it easy to do this on the Line chart.
Let’s build a chart with forecast that looks at average temperatures in the US (The QVF for this example is downloadable at the end of the post)
- Create a filter pane and select United States to limit data to one country.
- Create a Line Chart using:
- Dimension: MonthYear
- Measure: Sum(AverageTemperature)
- Expand the Measure field and turn ON the “Forecast” setting
- Move to the Dimension field and you can see that 2 new settings have appeared:
- Forecast steps: the number of data points to be forecasted (we choose 12). Keep in mind that the further we go out in time, the broader the confidence becomes due to the increased uncertainty.
- Step size: the granularity of the forecast steps (we choose Month to forecast for the upcoming year)
- You can also change the method used for the forecast (SSA or OLS) and the appearance of the trend line
- Confidence level describes the probabilistic range of the forecast and can be adjusted from 0 to 1. If 0.9 is selected, that means that 90% of the time, we will be within the blue range.
Using Insight Advisor:
Qlik has recently added the “Trend with Forecast” analysis type to Insight advisor. You can simply use the suggested measure and dimension and generate the chart:
To learn more about time series forecasting, check out this help article.
Thank you!
-
Qlik Data Integration Newsletter - October 2023
Welcome to October's Qlik Data Integration newsletter. Each month, we cover one endpoint and share our top resources, best practices, release updates ... Show MoreWelcome to October's Qlik Data Integration newsletter. Each month, we cover one endpoint and share our top resources, best practices, release updates and upcoming webinars.
Subscribe to the Qlik Data Integration topic to be notified of future editions!
Index
- Webinar
- Resource Highlights
- Reminder: Qlik Replicate November 2023 and FIPS
- Knowledgebase Article
- Endpoint Spotlight: SAP
- New Issues Reported
- Tips!
- Best Practice
- Release Updates
- Fixes
- Upcoming Enhancements
- Troubleshooting tips
- Analyze Qlik Replicate Logs
- Qlik Replicate End of Life Versions
Webinar
Book your calendar for the upcoming Q&A with Qlik: Qlik Replicate Sources and Targets Q&A session scheduled for October 24th (tomorrow!) at 10:00 AM EDT. It is a live Q&A session with a panel of Qlik experts. Bring your questions, and we do our best to answer them.
Resource Highlights
Reminder: Qlik Replicate November 2023 and FIPS
The November 2023 release of Qlik Replicate is not yet FIPS compliant. If you require a compliant environment, remain on the already FIPS compatible versions. See Qlik Replicate November 2023 and FIPS: Release not yet FIPS compliant for details.
Knowledgebase Article
Endpoint Spotlight: SAP
Find our latest knowledge base articles for SAP endpoints.
New Issues Reported
- Qlik Replicate: Replicating from SAP DB Source changing the precision on Currency Data Type to the Target
Currency data from SAP appears to replicate incorrectly when source values are compared to the target system. See Qlik Replicate: Replicating from SAP DB Source changing the precision on Currency Data Type to the Target for details.
- Qlik Replicate SAP Application (DB) Cluster Tables missing data in the Target
SAP Cluster Tables has missing data in the Target during CDC process. See Qlik Replicate SAP Application (DB) Cluster Tables missing data in the Target for details.
Tips!
- Qlik Replicate Trigger SAP HANA conversion from Version 1 to Version 2 or Version 3
The Qlik Replicate SAP HANA source endpoint allows you to convert to using the log table with CDC changes. This article documents how to convert the existing triggers into Version 2 or CTS Mode Version 3. See Qlik Replicate Trigger SAP HANA conversion from Version 1 to Version 2 or Version 3 for details.
Contact Qlik Support if you plan to convert your triggers, as additional migration steps may be needed to avoid data loss.
Best Practice
- Qlik Replicate SAP HANA Trigger Base using SAP Application (DB) as the Source
Qlik Replicate can now use SAP HANA as the Backend Database, which you can define on the SAP Application (DB) Source Endpoint setting with Triggers in SAP HANA.
Release Updates
Fixes
Qlik Replicate May 2023 Patch 3
(Build 2023.5.413)Jira issue: RECOB-7506
Type: Issue
Component/Process: SAP Application (DB)
Description: When the last batch contained operations on clustered tables, some changes would sometimes not be captured after detach/attach or stop/resume.Jira issue: RECOB-7477
Type: Issue
Component/Process: SAP Extractor Source
Description: An ABORT of a delta extractor job during change capture would result in a table being suspended, instead of a recoverable error.Jira issue: RECOB-7456
Type: Issue
Component/Process: SAP ODP
Description: When unloading failed, it would be reported as completed instead of failed.Jira issue: RECOB-7440
Type: Enhancement
Component/Process: SAP ODP
Description: Added support for CDS views that have mandatory parameters.Jira issue: RECOB-7414
Type: Issue
Component/Process: SAP Extractor Source
Description: Import of the Transport to a SAP Application Server would fail due to vulnerability issues.Jira issue: RECOB-7415
Type: Issue
Component/Process: SAP ODP
Description: When Current Data mode was enabled, Full Load would not replicate any records and the following error would occur during CDC: java.lang.String incompatible with java.math.BigDecimalQlik Replicate May 2023 Patch 2
(Build 2023.5.322)Jira issue: RECOB-6976
Type: Enhancement
Component/Process: SAP HANA Source (Trigger CTS mode)
Description: Added support for a configurable sleep interval after an empty Trigger Table session.Jira issue: RECOB-7390
Type: Issue
Component/Process: SAP Extractor Source
Description: When Extractor unload job failed or was canceled on the SAP side, the extractor status would be changed to Completed instead of Suspended.Jira issue: RECOB-7323
Type: Issue
Component/Process: SAP Extractor Source
Description: When a specific Extractor Full Load was aborted, the next Full Load would replicate the data retrieved by the aborted Extractor Full Load.Jira issue: RECOB-7348
Type: Issue
Component/Process: SAP Application (DB)
Description: SAP Pool table numeric values less than 0.1 would be replicated incorrectly.Jira issue: RECOB-7334
Type: Issue
Component/Process: SAP ODP Source
Description: Scheduler log messages would show an incorrect data set name and wrongly formatted time.Jira issue: RECOB-7262
Type: Issue
Component/Process: SAP ODP Source
Description: Data conversion problems would result in task failure or incorrect data replication.Jira issue: RECOB-7158, RECOB-6925
Type: Issue
Component/Process: SAP Extractor Source
Description: This resolves the following issues:- DELTA per table would only start after all Full Loads completed
- Reloading a table would prevent all DELTAs
- An error in a table during Full Load would prevent DELTAs from scheduling
Jira issue: RECOB-7308
Type: Issue
Component/Process: SAP HANA Source (Trigger mode)
Description: After applying a transport for maintenance to ACDOCA all CDC INSERT and UPDATE activity would be replicated as DELETEs.Upcoming Enhancements
Qlik Replicate November 2023 IR
- Expose stream buffer tuning parameters in task settings (Replicate & QEM - Expose stream buffer tuning parameters in task settings )
- Confluent Schema Register using BOTH authentication methods (Public Key + Username & password)
- Snowflake - Support Transactions in Upsert Mode
- Boolean Data Type support for PG sources and Bit support for SQL Server targets
- Google BigQuery - Secure current authentication (no longer have credential files on customer file system)
- Aurora PostgreSQL source - without the "superuser" role certification
- Azure Database for MySQL Flexible Server - Source & Target Certification
- MariaDB 10.6 to 10.11 versions on MySQL - certification
- MariaDB 10.6 version on Amazon RDS - certification
- Google Cloud SQL for MSSQL Source endpoint
- Databricks 12.2 LTS Certification
- Databricks Serverless SQL warehouse certification
- SingleStore 8.X Target certification
Troubleshooting tips
Analyze Qlik Replicate Logs
An evergreen pair of articles helps you read and analyze Qlik Replicate log files:
How to analyze a Qlik Replicate log
List of the error types in Qlik ReplicateQlik Replicate End of Life Versions
Version Release Date End of Support Date Qlik Replicate May 2023 May 9, 2023 May 9, 2025 Qlik Replicate November 2022 November 8, 2022 November 8, 2024 Qlik Replicate May 2022 May 10, 2022 May 10, 2024 Qlik Replicate November 2021 November 8, 2021 November 8, 2023 Qlik Replicate May 2021 May 11, 2021 May 11, 2023 Qlik Replicate November 2020 November 10, 2020 November 30, 2022 Qlik Replicate April 2020 (6.6) April 16, 2020 April 30, 2022 Qlik Replicate 6.5 November 14, 2019 November 30, 2021 Qlik Replicate 6.4 April 1, 2019 April 14, 2021 Qlik Replicate 5.5 August 1, 2017 November 30, 2020 For more information, see Qlik Product Lifecycles.
-
Qlik Digest - October 2023
AI Like a Rockstar, and Our Customers Qlik's CMO, Chris Powell, speaks about the stronghold Generative AI has over businesses in 2023, and how Qlik cu... Show MoreAI Like a Rockstar, and Our Customers
Qlik's CMO, Chris Powell, speaks about the stronghold Generative AI has over businesses in 2023, and how Qlik customers are already reaping real benefits from AI-powered solutions with Qlik Staige.
New AI Benchmark Report is OutThere is so much hype around generative AI (GenAI), it can be difficult to get real answers on how best to leverage AI and what will perform well. In our latest benchmark report, we surveyed hundreds of execs from Global 2000 firms to understand where orgs currently are in their AI journey, their most encountered obstacles, and why modern data fabrics are essential to ensure success of their AI.
Read Report >Use Cases for Qlik and Talend
The combined functionality of Qlik and Talend works with virtually any data source or methodology. Together they allow for end-to-end data management and analytics. The possibilities for data integration are nearly limitless. But we identified 7 ways to integrate Qlik and Talend together to level up your data quality.
Download Now >
Tips & Tricks of the MonthLearn how to leverage Insight Advisor, your AI-powered assistant, to generate analytics using natural language in this :30 video. Watch Now >
Earn qualification badges and more with our New User Learning Plans and continue your learning with Advanced Topics delivered live by expert instructors.
Catch up on more Qlik tips and tricks in our Do More with Qlik YouTube playlist.
What do you think of the Qlik Digest?
We want to make to make sure the Qlik Digest is exactly what you’re looking for from a monthly newsletter. Take our 2-minute feedback survey
Take Survey >Build on your success with Qlik
Join Qlik Nation to learn about new features, influence the product roadmap, share expertise, and enhance your learning- all while having fun and earning rewards.
-
Flexible Circular Gauge Demo
Flexible Circular Gauge Demo AnyChart Go beyond the native capabilities for KPI visualization. Explore all major features of the Circular Gauge ... Show MoreFlexible Circular Gauge DemoAnyChart Go beyond the native capabilities for KPI visualization. Explore all major features of the Circular Gauge Extension for Qlik Sense in this demo app.
Discoveries
Explore all major features while checking out various custom gauges suitable for diverse use cases. See multiple options for pointers, shapes, angles, sizes, and much more demonstrated in action.
Impact
Advanced circular gauges for Qlik Sense are capable of representing more than only a single measure value and providing more context.
Audience
Visualizers and analysts seeking to create customized and dynamic circular gauges within their Qlik Sense apps.
Data and advanced analytics
This application features Circular Gauges built with AnyChart's extension for Qlik Sense, utilizing fictional data to illustrate its capabilities.
-
Join a session with a Qlik Instructor exploring Qlik Sense topics!
Join us for the remaining live instructor sessions on #QlikSense topics and learn from an expert instructor!Don't miss out on topics such as : Editin... Show MoreJoin us for the remaining live instructor sessions on #QlikSense topics and learn from an expert instructor!
Don't miss out on topics such as :- Editing Published Apps - October 20
- Using Text and Images - October 25
- Using Operators in Set Expressions - November 1
- What-if Analysis in Qlik Sense - November 15
- Joining Tables in Qlik Sense - November 17
- Generating Data in the Script - November 20
- Administer your site using Qlik-cli - November 27
- Advanced Analytics Integration - December 8
- Interval Match with one or more Fields - December 13
Check out the full schedule and register here: https://learning.qlik.com/course/view.php?id=1511
-
Qlik Cloud Enhances Data Encryption with Customer Managed Keys
In today's data-driven world, ensuring the privacy and security of sensitive information is paramount. That's where Customer Managed Keys (CMK), often... Show MoreIn today's data-driven world, ensuring the privacy and security of sensitive information is paramount. That's where Customer Managed Keys (CMK), often referred to as Bring Your Own Key (BYOK), come into play. These advanced data encryption controls allow organizations to manage and leverage their own encryption keys versus using Qlik’s.
Through this enhancement in CMK, we can now support the following scenarios of converting a tenant with existing data:
- From Qlik Internal KMS to AWS KMS
- From AWS KMS to Qlik Internal KMS
- From one AWS KMS Key to another AWS KMS Key ( Key Rotation)
Public APIs and CMK connectors are also available in Qlik Cloud Application Automation to simplify deployment and lifecycle management.
By implementing Customer Managed Keys, organizations can encrypt their data ensuring that only authorized parties can access it. This robust encryption strategy not only fortifies data privacy but also helps companies meet regulatory obligations, HIPAA, or industry-specific standards when designing new solutions or products. In the age of ever-increasing data breaches and cyber threats, CMK empowers businesses to adopt cloud technology with confidence that their data is well-protected and in compliance with the most stringent data privacy regulations.
To learn more, watch the video below and for a more technical blog, see link here.
-
AI-Enhanced Features to Transform your Business - Do More with Qlik Episode 46
Register for the next do more when the page is ready:https://pages.qlik.com/Do_More_with_Qlik_Webinar_Series.html Index0:00 intro and presentation14:... Show MoreRegister for the next do more when the page is ready:
https://pages.qlik.com/Do_More_with_Qlik_Webinar_Series.htmlIndex
0:00 intro and presentation
14:10 - "things you should know"
15:35 - Demo Flow
17:24 - Ask Insight Advisor - Insight Advisor Chat
23:39 - Insight Advisor Chat in MS Teams (coming soon)
24:59 - Explore this further - Insight Advisor Natural Language Search and Explore
27:48 - How to Enable Insight Advisor Chat for your apps
29:05 - Insight Advisor Web Interface Layout
30:00 - Point and click explore
31:40 - Natural Language Search
33:46 - Analysis Types
34:15 - Using Insight Advisor along with Smart Search
36:05 - Smart Sheets
39:00 - NL Insights Chart and Expression Generator
42:38 - Key Drivers (coming soon)
44:38 - Build-out Example with Business Logic
-
Window関数
■はじめに Qlikロードスクリプトでデータテーブルに対して複雑な計算を実行し、データの粒度を失うことなく、異なるパーティションに対して集計を実行できるようになりました。集計テーブルを作ることなく、集計値を求めることができます。 ウィンドウ関数は、複数の行の値を使用して計算を実行し、各行の値を個別に... Show More■はじめに
Qlikロードスクリプトでデータテーブルに対して複雑な計算を実行し、データの粒度を失うことなく、異なるパーティションに対して集計を実行できるようになりました。集計テーブルを作ることなく、集計値を求めることができます。
ウィンドウ関数は、複数の行の値を使用して計算を実行し、各行の値を個別に生成します。ウィンドウ関数は、テーブル全体が読み取られた場合にのみ計算できます。
■構文
Window関数の構文は次の通りです。
Window(入力数式, [パーティション1, パーティション2, ...], [ソートタイプ, [ソート式]],[フィルター式], [開始数式, 終了数式])
■制限
Window関数関数の使用には下記の制限があります。
- Windowはリソースを大量に消費する機能であり、特にメモリの消費量が大きくなります。
- WindowはQlik Sense Mobileには対応していません。
- チャート数式はWindowをサポートしていません。
- Window関数を他のWindow関数内にネストすることはできません。
- Windowは集計関数内では使用できません。
- Windowはテーブル全体をスキャンできる必要があります。
- スライディングウィンドウ機能を使用する場合、WRank()、RecNo()、RowNo() は Window と一緒に使用できません。
■その他
Window関数の内部でのみ使用可能な Wrank もあります。
WRank() は、ロードスクリプトでテーブルの行を評価し、それぞれの行に対して、ロード スクリプトで評価された項目の値の相対位置を示します。この関数はテーブルの評価時に、結果を現在の列セグメントに含まれるその他の行の結果と比較して、セグメント内の現在の行のランキングを返します。
Qlik Tips で、デモを交えて詳しくご紹介しています。

-
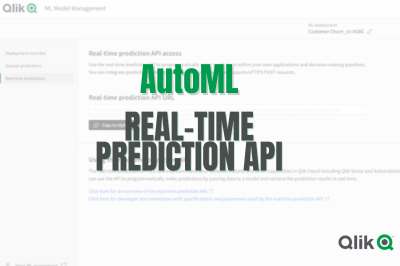
Exploring Qlik AutoML Real-time Predictions API
The ability to make data-driven decisions in real-time is a cornerstone for many businesses. Using Qlik AutoML's real-time prediction API let's you se... Show MoreThe ability to make data-driven decisions in real-time is a cornerstone for many businesses. Using Qlik AutoML's real-time prediction API let's you seamlessly integrate predictions on the fly in your web applications.
In this guide, we will walk through the process of leveraging Qlik AutoML's real-time prediction capabilities using Node.js.
Before using the API, we first need to create an ML experiment in Qlik cloud and deploy it.
Creating the AutoML Experiment and deploying it
There are lots of help articles around this topic, but for our simple case, we will be using a Customer Churn dataset to train our model (You will find the file attached at the end of this post).
- Start by creating a new ML experiment from your Qlik cloud hub
- After uploading the Training file, select the “churned” column as the target to make our predictions. Make sure to de-select the “AdditionalFeatureSpend” and “DaysSinceLastService” columns if you want to follow along with this example.
The features (columns) selected in this step should later on match the schema of the input dataset we want to get real-time prediction on.
- Once we run the experiment to train the model, the best performing algorithm is automatically selected, you can now reconfigure a different version or simply press Deploy to create a new ML deployment, let’s do the latter.
- In the Deployment screen, you can run predictions on new apply datasets right in the hub, or in our case, we will use the Real-time prediction API to programmatically make predictions from our node.js app.
Creating the node.js app to make real-time predictions
Head to the Real-time predictions pane as shown above, this is where we will be able to grab the API URL.
To interact with the real-time prediction API, you'll require an API key from Qlik Cloud. Users with the 'Developer' role have the necessary privileges to generate this key. You can learn more about generating one here.
Setting up the Environment
Begin by initializing a Node.js environment and installing the necessary packages, run:
npm init -ythen
npm install axios dotenv fsAPI Configuration
In the .env file, define the Real-time prediction API URL and the API Key:
API_KEY=eyJhb....
API_URL=https://....
Next, create an index.js file and include the following:
Data prep:
We read from the csv file using fs and format the data to align with the real-time prediction API's requirements
const axios = require('axios');
const fs = require('fs');

require('dotenv').config();

const api_url = process.env.API_URL;
const api_key = process.env.API_KEY;

const rawData = fs.readFileSync('./customer-churn-apply-subset.csv', 'utf8');
const rows = rawData.split('\n').slice(1).filter(line => line.trim() !== '').map(row => {
    const [
        AccountID, Territory, Country, DeviceType, Promotion, HasRenewed, PlanType,
        BaseFee, NumberOfPenalties, CurrentPeriodUsage, PriorPeriodUsage, ServiceRating,
        ServiceTickets, StartMonth, StartWeek, CustomerTenure, Churned
    ] = row.split(',');

    return {
        "AccountID": AccountID,
        "Territory": Territory,
        "Country": Country,
        "DeviceType": DeviceType,
        "Promotion": Promotion,
        "HasRenewed": HasRenewed,
        "PlanType": PlanType,
        "BaseFee": parseFloat(BaseFee),
        "NumberOfPenalties": parseInt(NumberOfPenalties, 10),
        "CurrentPeriodUsage": parseFloat(CurrentPeriodUsage),
        "PriorPeriodUsage": parseFloat(PriorPeriodUsage),
        "ServiceRating": parseFloat(ServiceRating),
        "ServiceTickets": parseInt(ServiceTickets, 10),
        "StartMonth": StartMonth,
        "StartWeek": StartWeek,
        "CustomerTenure": parseFloat(CustomerTenure),
    };
});

const formattedRows = rows.map(record => [
    record.AccountID,
    record.Territory,
    record.Country,
    record.DeviceType,
    record.Promotion,
    record.HasRenewed,
    record.PlanType,
    record.BaseFee,
    record.NumberOfPenalties,
    record.CurrentPeriodUsage,
    record.PriorPeriodUsage,
    record.ServiceRating,
    record.ServiceTickets,
    record.StartMonth,
    record.StartWeek,
    record.CustomerTenure
]);
Crafting the API Request:
here, we define the headers and body content for the POST request to the API.
Notice that the schema matches the features we used to train our model.const json_data = { "rows": formattedRows, "schema": [ {"name": "AccountID"}, {"name": "Territory"}, {"name": "Country"}, {"name": "DeviceType"}, {"name": "Promotion"}, {"name": "HasRenewed"}, {"name": "PlanType"}, {"name": "BaseFee"}, {"name": "NumberOfPenalties"}, {"name": "CurrentPeriodUsage"}, {"name": "PriorPeriodUsage"}, {"name": "ServiceRating"}, {"name": "ServiceTickets"}, {"name": "StartMonth"}, {"name": "StartWeek"}, {"name": "CustomerTenure"}, ] }; const headers = { 'Authorization': `Bearer ${api_key}`, 'Content-type': 'application/json', 'Accept': 'text/json', };Sending the Request & Handling Response
We utilize axios to transmit the data and receive real-time prediction results (you can use any http client for this)
axios.post(
    api_url,
    json_data,
    {
        headers: headers,
    })
    .then(response => {
        console.log(response.data);
    })
    .catch(error => {
        console.error("Error:", error);
    });
Now you can run the node app:
node index.jsThe result we get are the predictions of the Customer Churn for our apply dataset with the second column representing whether the customer is predicted to Churn or not, 3rd column is the probability of Churned_no, and the 4th column is the probability of Churned_yes.
We can compare these results to the ones we get on the hub if we were to create predictions there:
With Qlik AutoML's real-time prediction API at your fingertips, you’re now ready to integrate real-time predictions into your web apps whether it’s to enrich your visualizations or build interactive what-if scenarios, you can easily make impactful real-time decisions.
API docs: https://qlik.dev/apis/rest/automl-real-time-predictions
You can find the full code and dataset files used below.
-
Kicking off the new term with a Qlik Sense Workshop
Now that we are into October we are starting the new academic year by introducing students to the power of Qlik Sense! Today we ran a hands on Qlik Se... Show MoreNow that we are into October we are starting the new academic year by introducing students to the power of Qlik Sense! Today we ran a hands on Qlik Sense workshop with the University of Liverpool. 120 students learnt all about how to create their first application in Qlik Sense, using the free tenant given to them as part of the Academic Program. This was a 3 hours hands on session for students studying a Masters in Business Analytics and Big Data. During this session students got to grips with using the Insight Adviser, loading and connecting data in the data manager, creating measures and using the storytelling function in Qlik Sense.
Straight after our session with the University of Liverpool we gave guest lecture to 30 students at Anglia Ruskin University studying the ARUCPD: Business Analytics and Data Visualizations with Qlik. This is an optional course that enables students to upskill in data analytics alongside their courses. We gave them an intro to Qlik, a tour of all the resources they get access to as part of the Academic Program and finally we went through a 30 minute in depth demo of Qlik Sense so that the students could get a taste of what to expect when they get started.
If you're interested in learning more about how to get access to free software and learning resources, or how you can include Qlik in your teaching, go to qlik.com/academicprogram.
-
IMDb Top 1000 Movies
IMDb Top 1000 Movies AnyChart — Extensions for QS Using a decomposition tree, dig into the top 1000 movies of all time and their box office acco... Show MoreIMDb Top 1000 MoviesAnyChart — Extensions for QSUsing a decomposition tree, dig into the top 1000 movies of all time and their box office according to IMDb, an online database claiming to be the world's most popular source for movie content.Discoveries
This app lets you identify the top actors and quickly learn which directors, genres, years, and individual films contributed the most to their success. Switch these dimensions as you like to view and explore the breakdown in the desired way.
Impact
A decomposition tree delivers a granular view of the top movies' box office, splitting the data into multiple dimensions (actors, directors, etc.) for an intuitive ad hoc exploration, enabling root cause analysis.
Audience
Box office analysts in the movie exhibition and distribution industry, film professionals, and others interested in the performance of movies. Also, all who want to see a real-world use case for a decomposition tree.
Data and advanced analytics
The app has been built using the Decomposition Tree extension for Qlik Sense released in January 2023. The data comes from the IMDb Top 1000 Movies dataset on Kaggle.
-
Notice of change in Qlik Cloud recovery login behavior
Hello Qlik Users, Beginning October 10, 2023, access to the tenant recovery URL for tenants (https://<tenant name>.<region>.qlikcloud.com/login/recove... Show MoreHello Qlik Users,
Beginning October 10, 2023, access to the tenant recovery URL for tenants (https://<tenant name>.<region>.qlikcloud.com/login/recover) will be restricted to the Service Account Owner of the tenant. This update is performed on all Qlik Cloud tenants to handle circumstances in which the service account owner for a tenant was changed or will be changed.
If you are using the recovery login URL to access your tenant regularly, we recommend you use the standard login URL for your tenant (https://<tenant name>.<region>.qlikcloud.com/login) instead. You cannot access the tenant through the recovery login after October 10, 2023.
Thank you for choosing Qlik,
Qlik Support -
Qlik Sense August 2023 (Client-Managed) now available!
Visualizations & Dashboards New Styling Settings in “App Options” UI New application styling settings in “App options” allow you to turn the Toolbar a... Show MoreVisualizations & Dashboards
New Styling Settings in “App Options” UI
New application styling settings in “App options” allow you to turn the Toolbar and Sheet Title on or off for all sheets. Turning the Toolbar and/or Sheet Title off provides more space for content and allows you to customize selections for titles and the navigation bar.
Additional Options for Bar Charts
New Bar Chart options have been added, allowing application developers to enable toggling across different dimensions or measures within the same chart. The ability to add a simple toggle switch using the “show condition” expression gives developers more control, improves customization, and saves space. Users will appreciate significant time savings with the ability to toggle across the variables associated with their Bar Chart data.
New Legend Styling
New styling options for Legends are now available, providing greater flexibility and customization. Legend styling is available for Line, Bar, Pie, Mekko, and Waterfall charts, plus Scatterplot and Distribution Plot. Options for Legend styling include font family, size, and color for Title and Labels.
New Styling Panels for Button Object, Line Charts and Tree Map
A new Styling Panel adds flexibility and customization to the Button Object. Through this enhancement, you can set text size as Fixed, Fluid (resize relative to button height), or Responsive (scales to always fit).
Font styling for Line Charts has been updated to utilize the Nebula framework. Styling includes titles, subtitles, and footnotes, and includes options for font size, color, and family.
The new Styling Panel for the Tree Map extends your ability to customize the look and feel to meet organizational standards and preferences. It includes font size, color, and family options for titles, subtitles, and footnotes. You can also choose background image and color.
New Chart Hover and Selection Menu Design
We have re-designed the chart hover and selection, providing better customization and enhancing chart rendering with new visual styling options.
Insight Advisor
New Visibility into App Enablement status within UI
When natural language capabilities (Insight Advisor Search and Chat) are enabled for an app, we now show a notification banner with the enablement status of the app. This helps users know when apps are ready to support search, so they do not try to access the feature before indexing is complete.
Parquet File Support
New Support for reading and writing parquet files
Apache Parquet is a columnar storage format, highly efficient for storing and querying large datasets. In Qlik Sense on Windows, you can now read data from Parquet files and store tables as Parquet files. Using Parquet allows for efficient querying of specific columns in a table rather than reading the entire table. This makes it well-suited for use with big data processing. Also, Parquet supports efficient compression and encoding of data which can further reduce storage space and improve query performance.
Qlik Insider Webinar
Considering the move to SaaS? Check out the Qlik Insider webinar on August 23rd as we dive into the second half of the year for an exclusive look at our cutting-edge advancements in our data and analytics portfolio this quarter. -
【11/13(月)- 15(水)開催】Gartner IT Symposium/Xpo™ 2023
Qlik は、「Gartner IT Symposium/Xpo™ 2023」に、講演およびブース出展します。 Qlik は、最近の Talend 社との統合により、企業のデータ統合・データ品質・分析ソリューションを支援する、リアルタイムデータ・人工知能(AI)・機械学習(ML)・自動化などの最先端... Show MoreQlik は、「Gartner IT Symposium/Xpo™ 2023」に、講演およびブース出展します。
Qlik は、最近の Talend 社との統合により、企業のデータ統合・データ品質・分析ソリューションを支援する、リアルタイムデータ・人工知能(AI)・機械学習(ML)・自動化などの最先端のテクノロジーを備えた業界をリードする製品ポートフォリオを提供します。
データとアナリティクスのリーダーが一堂に会する最大級の IT イベントに、ぜひご参加ください。Qlik 講演および Qlik ブースで、皆さまをお待ちしております。
詳細を見る
【開催概要】
日時:2023年 11月 13日(月)– 15日(水)
会場:グランドプリンスホテル新高輪 国際館パミール
〒108-8612 東京都港区高輪3-13-1 -
Qlik Cloud 9月の新機能
分析の新機能 Qlik Dashboard bundle に Line の追加 ダッシュボードに仕切りや装飾を追加できます。線は、一緒に属するコンテンツを分離およびグループ化する場合や、特注のダッシュボードを作成する場合に便利です。線は垂直または水平にでき、線の幅、色、スタイルを設定できます。 ... Show More分析の新機能
Qlik Dashboard bundle に Line の追加
ダッシュボードに仕切りや装飾を追加できます。線は、一緒に属するコンテンツを分離およびグループ化する場合や、特注のダッシュボードを作成する場合に便利です。線は垂直または水平にでき、線の幅、色、スタイルを設定できます。
スクリプトに Window関数が登場
Window関数により、データの粒度はそのままでさまざまな集計を実行することができます。例えば次のような計算を行うことが容易になります。
- 行内の個々の数値と、列内の平均値、最大値、または最小値を比較
- 列内またはテーブル全体内の個々の値のランクを計算
※ 詳細については、こちらをご参照ください。
Insight Advisor 数式ジェネレーターで自然言語で数式を生成
数式エディタに追加された数式ジェネレーターで、自然言語により数式を生成することができるようになりました。これにより複雑なSet分析を含む数式も容易に作成することができます。
ただし日本語には対応していません。英語の文体をまねて入力すると数式が作成される場合もあります。
Qlik Data Gateway : Direct Acces バージョンアップ
Qlik Data Gateway - Direct Access 1.5.2 がリリースされました。ODBCコネクタが導入されています。
データ統合の新機能
SaaS アプリケーション コネクタがさらに追加
医療情報テクノロジーとデジタル広告アプリケーションに重点を置いたコネクタが追加されました。
- Cerner Millennium
- Epic on FHIR
- Facebook Ads
- Facebook Pages
- Google Ads
- Instagram Ads
- Oracle OPERA
- Salesforce Pardot
- SAP Commerce Cloud
- UKG Pro
- Zendesk
その他、モニタービューや、ランディングエリアのテーブルレベルでのリロードなど、監視やエラー対応の機能が強化されています。
-
Activity trackers and Analytics
The challengeGarmin have a great website, full of nice visualisations of activity and a mobile app where you can view tracked activity data.That's gre... Show MoreThe challenge
Garmin have a great website, full of nice visualisations of activity and a mobile app where you can view tracked activity data.
That's great, right up to the point you want to compare two activities, here it falls down. Other than seeing high level stats side by side, you cant.The solution
Build my own analytics tool to allow me to compare not only statistical data, speed, stroke rate, distance, etc.. but look at the actual GPS trace of the route.
Using a 'free' desktop version of the platform we have adopted to form the front end to our Insights platform, Qlik Sense and activity data downloaded from Garmin Connect I wanted to see how I could visualise the data and build something which gave me what I wanted.
Read more detail here on my blog: www.Analyticsandthings.com
-
Access Evaluator - Monitoring App for Qlik Cloud
Introducing our fourth monitoring app for Qlik Cloud, the Access Evaluator! The Access Evaluator is a comprehensive dashboard to analyze user roles, a... Show MoreIntroducing our fourth monitoring app for Qlik Cloud, the Access Evaluator! The Access Evaluator is a comprehensive dashboard to analyze user roles, access, and permissions across a Qlik Sense tenant. As a Qlik Cloud tenant becomes densely populated with spaces, apps, users, and groups, it is crucial to be able to quickly answer questions such as:
- “What users and groups have access to space <X>?”
- “What users and groups have access to app <X>?”
- “How does a user have access to app <X>; via direct assignment, group, or app share?”
- “Are there redundancies in policies? E.g., do users have the same access to a space via a direct assignment as well as a group?”
- “Who has what roles across the tenant?”
The Access Evaluator app provides insights on:
- User and group access to spaces
- User, group, and share access to apps
- User roles and associated role permissions
- Group assignments to roles
- And more!
(Available Sheets)
The Access Evaluator uses Qlik’s RESTful APIs to fetch all the required data from the tenant.
Items to note:
- This app evaluates what a user and/or group has the potential to access, not what they have accessed. As such, it cannot be used to audit user activity. It simply evaluates the current access policies in the tenant.
- This app is provided as-is and is not supported by Qlik Support.
- It is recommended to always use the latest app.
- Information is not collected by Qlik when using this app.
The app as well as the configuration guide are available via GitHub, linked below.
- QVF: https://github.com/qlik-oss/qlik-cloud-access-evaluator/releases/latest/download/access-evaluator.qvf
- Release Notes: https://github.com/qlik-oss/qlik-cloud-access-evaluator/releases/latest
- Installation Guide: https://github.com/qlik-oss/qlik-cloud-monitoring-apps/releases/latest/download/qlik-cloud-monitoring-applications-installation-guide.pdf
Any issues or enhancement requests should be opened on the Issues page within the app’s GitHub repository.
Be sure to subscribe to the Qlik Support Updates Blog by clicking the green Subscribe button to stay up to date with the latest Qlik Support announcements. Please give this post a like if you found it helpful!
Kind regards,
Qlik Platform Architects
Additional Resources:
Our other monitoring apps for Qlik Cloud can be found below.
- App Analyzer
- Reload Analyzer
- Entitlement Analyzer
- OEM Dashboard (for OEM Partners and multi-cloud tenants)