Unlock a world of possibilities! Login now and discover the exclusive benefits awaiting you.

Analytics & AI
Forums for Qlik Analytic solutions. Ask questions, join discussions, find solutions, and access documentation and resources.
Data Integration & Quality
Forums for Qlik Data Integration solutions. Ask questions, join discussions, find solutions, and access documentation and resources
Explore Qlik Gallery
Qlik Gallery is meant to encourage Qlikkies everywhere to share their progress – from a first Qlik app – to a favorite Qlik app – and everything in-between.
Qlik Community
Get started on Qlik Community, find How-To documents, and join general non-product related discussions.
Qlik Resources
Direct links to other resources within the Qlik ecosystem. We suggest you bookmark this page.
Qlik Academic Program
Qlik gives qualified university students, educators, and researchers free Qlik software and resources to prepare students for the data-driven workplace.
Recent Blog Posts
-
Academic Program Student Success Story
As you may remember we announced the winners of our 2022 Qlik Academic Program Datathon back in May, Thomas De Dobbeleer and Rutger Mols won with an i... Show MoreAs you may remember we announced the winners of our 2022 Qlik Academic Program Datathon back in May, Thomas De Dobbeleer and Rutger Mols won with an impressive app that focused on the United Nations 17 Sustainable Development Goals.
We run this challenge to give students the opportunity to showcase their Qlik Sense and data analytics skills. We always hope that students can learn from the Datathon and apply those skills to the future workplace, or that by taking part in the Datathon they have something extra to add to their CV. We are so excited to hear about where 2022 winners take their careers after their win! But in the meantime, we have put together a success story about our winner from 2021 - Jesse van Haasteren.
Our story is all about how Jesse registered with our free Academic Program as a complete newbie to data analytics. Using our free training resources he prepared himself to compete, and later win, in the 2021 Datathon. His enrollment on the program and subsequent Datathon win, helped to secure him an amazing job offer with Bitmetric. In his own words, “The Qlik Academic Program played a big role in getting me started in formulating data. It gave me the confidence to use the data analytics tools effectively and enter an exciting data-driven workspace”.
Read Jesse’s story to learn about how his journey with the free Academic Program helped him to carve out a new career path. If you’d like to know how to start your own journey with the Academic Program, follow this link for information on our free software and resources: https://www.qlik.com/us/company/academic-program.
Click the link below to read Jesse's Qlik Academic Program Success Story!
-
Qlik Replicate and Qlik Enterprise Manager May 2022 Client Managed Release Highl...
We want to highlight some of the cool things now available in the Qlik Replicate and Qlik Enterprise Manager May 2022 Client Managed Releases. Endpoi... Show MoreWe want to highlight some of the cool things now available in the Qlik Replicate and Qlik Enterprise Manager May 2022 Client Managed Releases.
Endpoint Improvements
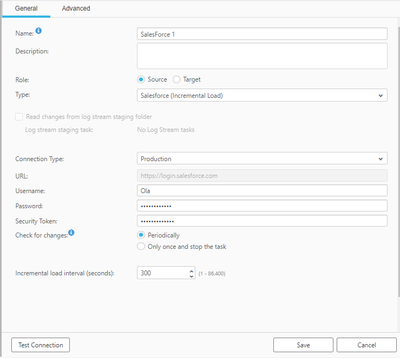
Salesforce Incremental Load (Source)
We have introduced support for incremental loading from all Salesforce objects which provides a greater flexibility from this source endpoint with respect to objects and fields replicated.
The Salesforce (Incremental Load) uses the salesforce Bulk API v2 which is based on change polling and as has the advantage of supporting almost all tables, compared to some limitations in the Salesforce (Streaming CDC) method in the Salesforce endpoints. You can use this method if you need to capture changes from tables that are otherwise not supported with Salesforce (Streaming CDC).
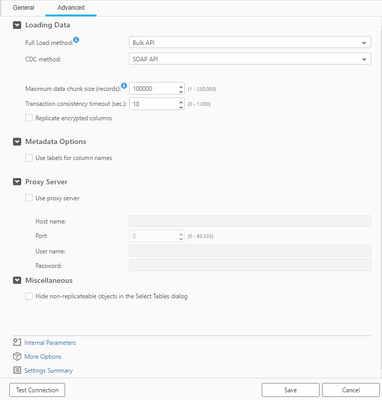
Additionally, driven by customer feedback you can also leverage “query like” incremental loads via the Salesforce BULK and SOAP APIs which has support for calculated and compound fields.
Parquet File fFormat for Amazon S3 (Target)
Again, based on customer demand, we are pleased to announce that the Amazon S3 endpoint now supports the Parquet file format, enabling a simple “file based” raw lake for data science use cases. Parquet is an open-source file format built to handle flat columnar storage. It’s well known for both its performant data compression and the ability to handle a wide variety of encoding types. The addition of Parquet will provide optimizations in Qlik Replicate that speed query execution due to its efficient file format. We hope to be able to soon support Parquet file format in other BLOB storage like ADLS and GCP. Stay Tuned!
Microsoft Azure SQL (MS-CDC) (Source)
The Microsoft Azure SQL (MS-CDC) endpoint now supports capturing changes from Azure SQL Database using Microsoft Change Tables. This effectively adds Azure SQL Database as a ‘new source’ enabling secure, real-time data replication from Azure SQL Database systems in the cloud. We are working towards certification for “bare metal” SQLServer as well, so keep an eye out for that announcement soon.
Security
SAP Extractor (Source)
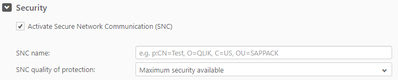
The May 2022 release continues our support for various authentication methods. You can now connect to an SAP Server using Secure Network Communication (SNC). You can enable the new SNC option in the SAP Extractor endpoint's General tab.
Google Cloud BigQuery (Target)
With this target endpoint we have added tighter security options by supporting the role “Job User” which can load data without requiring editing rights.
When you are wanting to replicate to Google Cloud BigQuery you can now choose the following permissions:
- BigQuery > BigQuery Data Editor
- BigQuery > BigQuery Job User
Support for Azure Government Cloud and China Cloud
As part of our ongoing commitment for supporting our public sector customers we have introduced support for connecting to Azure resources on Microsoft’s Azure Government Cloud or China Cloud when using the following target endpoints:
- Microsoft Azure ADLS
- Microsoft Azure Event Hubs
- Microsoft Azure HDInsight
- Microsoft Azure Synapse Analytics
- Microsoft Azure Databricks
- Microsoft Azure Databricks Delta
- Snowflake on Azure
Performance
SAP Improvements
We have enhanced our SAP endpoints in the May 2022 release which will offer significant improvements in performance.
SAP Extractor Based
Particularly interesting for customers with an SAP runtime license looking to improve their latency times. Some of our ‘early adopter’ customers are seeing up to 13x improvements.
SAP Application Support via TriggersFor those SAP customers with an SAP Enterprise License, also in our early access trials, customers are reporting improved performance up to 50% faster and improved SAP source utilization, with some customers managing up to 60% cost savings.
If you are interested in working with the new SAP Extractors or SAP Triggers please reach out to your Qlik account team. While the new SAP Extractors and Triggers are fully supported, they are not yet generally available to all customers.
Google Cloud BigQuery and Snowflake INSERT Optimization
Following on from adding support for MERGE in previous releases, May 2022 release now supports an optimization for INSERT only activity which can significantly help to improve costs when moving data to a cloud target.
A The new “Optimize inserts” option is available in added to the “Change Processing Tuning” tab of “Task Ssettings”. To use the new option, ”Apply changes using SQL MERGE” must also be turned on.
With these options turned on when a batch of change records consist of INSERTs only. Qlik Replicate will perform INSERTs instead of using SQL MERGE, which will help to improve performance and reduce costs for these types of workload.
In this release the “Apply changes using SQL MERGE” and “Optimize inserts” options are currently only available for tasks configured with the following target endpoints:
- Google Cloud BigQuery
- Snowflake on Azure, Snowflake on Google, and Snowflake on AWS
Notification Type and API
We are always striving to help you to be more proactive when monitoring and managing your Qlik Data Integration environments and to that end May 2020 2022 releases for both Qlik Replicate and Qlik Enterprise Manager incorporate a new Notfication notification type and an API improvementa new API.
New task notification for CDC interruptions
The new “No changes were captured in the last <n> minutes notification” will alert you if no changes were captured from the source database within the specified time limit. With most databases, receiving this notification will usually indicate a connectivity problem. However, it is worth noting that with the following databases, it could simply mean that no changes occurred during the specified period.
- Microsoft SQL Server
- IBM DB2 for LUW
- IBM DB2 for iSeries
When the task resumes capturing changes, an additional notification that change capture has resumed will be sent, and the notification timer will be reset.
Support for replacing endpoint properties using the Qlik Enterprise Manager API
This version adds the ability to edit specific endpoint properties using the Enterprise Manager API. When not editing the value directly in the user interface, this was previously only possible using export, edit, and import operations. The functionality is available through the new PatchEndpoint method, which is available in all of the APIs (REST, .NET, and Python).
We hope you enjoy trying out the new releases and would love to hear your feedback and success stories, especially in the improvement gains.
As always if you would like to try out this release. Go to the Qlik Downloads Site and filter for “Qlik Data Integration”, and then select the product and version you would like to download.
-
Introducing DAR mashup template
NOTE: To increase resolution or size of the video, select the YouTube logo at the bottom right of the player. You will be brought directly to YouTube... Show MoreNOTE: To increase resolution or size of the video, select the YouTube logo at the bottom right of the player. You will be brought directly to YouTube where you can increase the resolution and size of the player window. Look for the 'settings' gears icon in the lower right of the player once at YouTube.
What
Just that, a mashup template for dev-hub (aka dead simple drag and drop mashup creator) that ships with a bunch of cool features such as:
- Dev-hub ready
- Multi Page
- KPI row built in
- Prebuilt CSS color library
- Cards with full screen toggle
- Offcanvas filters pane
- Help modal popup
- Responsive design
- Bootstrap built in
- Custom fonts ready
Why
Because we’ve heard you asking for a more powerful and good-looking template that can constitute a solid framework to create your customized mashups.
Who
Anyone looking for a feature rich mashup template designed for use in the dev-hub.
When
Available today!
Where
You can grab the latest* version here GitHub - fkabinoff/qs-dev-hub-dashboard-template: Dashboard template for Qlik Sense dev hub
*Please notice this is a live project, we will keep updating it frequently. Right now the project documentation (readme.md) is far from what we would like it to be.

-
Using Qlik for the Birds and the Bees! A MUST WATCH!
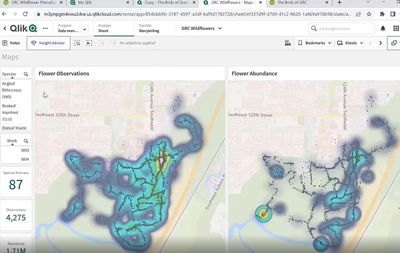
A MUST WATCH! Green River College - Danny Najero Having worked in the Academic Program for many years now, meeting Educator Danny Najera was so exciti... Show MoreA MUST WATCH! Green River College - Danny Najero
Having worked in the Academic Program for many years now, meeting Educator Danny Najera was so exciting because I have never worked with an educator using Qlik for such unique purposes!
Danny teaches biology, environmental science and northwest ecology at Green River College in Washington State. In these courses he use Qlik for both wild flower and bird data collection and analysis. What do they do with this data? The goal is to share the data with nature lovers who cannot visit the forest themselves or want to be prepared for their visit. It can also be shared with local wildlife enthusiasts such as birding clubs, bee keeping societies, etc. Most importantly, it helps them establish and compare metrics about the health of the forest and compare it to others.
In this video he demos the applications he has built which are used by his colleagues and the students. He expresses his gratitude for Qlik Sense and credits the tool for allowing the students to focus on the science. He explains "In the past before we were using Qlik, the question was how do I get excel to show this graph. when we are using Qlik, they ask about the species, how long the buds last, etc, that alone shows me they get more knowledge about the species and are not being bogged down with the computer programming. "
In summarizing the students overall benefit using Qlik Danny explains "Even when we are out in the field, there are questions they will come up with as they watch a bird or smell a flower but there are also questions they cant think about yet. Those only show up until after we've shown them the data. So they get both that naturalistic in person experience but also that scientific quantitative data level analysis as well"
He also credits Qlik for its ease of use, saying "The questions now are much more organism focused, biology focused, content focused and not so much on the difficulties".
Interested in joining the Academic Program?! University educators and students can apply today!

-
Simplify Enterprise Access Control and Sharing Analytics Content
Qlik has enhanced enterprise access controls and flexible app sharing to improve content security, governance, and sharing of analytics content across... Show MoreQlik has enhanced enterprise access controls and flexible app sharing to improve content security, governance, and sharing of analytics content across larger deployments of users and groups.
With the new update admins and users will have more options and flexibility for fine-grain security, permissions, and sharing across a variety of content within their spaces and individual apps. These updates support customers to better scale and organize security permissions across large deployments while making it easy to invite others and share insights.
Space owners, facilitators, and admins can now directly share individual apps with any group or users without adding those users into the space. Shared users and their specific access controls can easily be managed from the Member Section of the managed space. Subsequent releases will include more granular user roles as well as global custom roles and expanded access control for additional content, including Notes.
Sharing analytics content with security precision streamlines the process of inviting others into the analytics realm and fosters collaboration by allowing others to easily and safely be included in the decision-making process.
- Check out the SaaS in 60 video for Enterprise Access Control here
- Qlik Help Topic
- Don't have access to YouTube check out the video on the Qlik Site here
Learn about all of the latest Qlik Cloud enhancements on our SaaS Change Log - subscribe to the RSS feed! -
Evaluate() Function
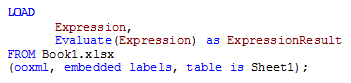
The Evaluate() function is a string function that takes one text string parameter. If the string is a valid QlikView or Qlik Sense expression then th... Show MoreThe Evaluate() function is a string function that takes one text string parameter. If the string is a valid QlikView or Qlik Sense expression then the evaluated result of the expression will be returned. If the string is not a valid expression, then Null is returned. The Evaluate() function can only be used in the script and not in a chart expression. Evaluate() will do the math for you in the script and return the result. For example, if you are loading a field whose content is expressions like this:
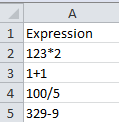
Then you can view that data in two ways. You can either view the actual expression or you can use Evaluate() and view the results.
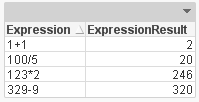
The Evaluate() function is also useful when you are loading a number from a text file or a text field in a database with more than 14 digits. When that number is loaded into QlikView, it is interpreted as a string since it is too long (more than 14 digits).
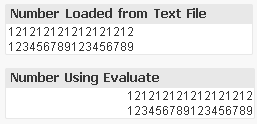
Note that while using Evaluate() returns a number, it is only stored with 14 digit precision. While you may be able to see more than 14 digits, this is just the formatting. The internal mantissa is only 14 digits.
Evaluate() can similarly be used with variables which can be helpful if you have a value that you would like to use multiple times in the script.
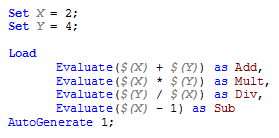

So why use a Evaluate()? At first it seemed unnecessary to me because the calculation would still be done without the Evaluate() function but then I realized that that is only the case when the values are numeric and not strings. So Evaluate() is helpful when your expression is in a string format or when the expression is a number with more than 14 digits. It allows a string expression to be evaluated and the result returned. It is like a short-cut to solving the expression. Try it out!
Thanks,
Jennell
-
Exciting updates to Qlik Compose are now available
Let us start with the top improvements to data warehouse automation.Flexibility to manage change data. When the option to keep changes in change table... Show MoreLet us start with the top improvements to data warehouse automation.
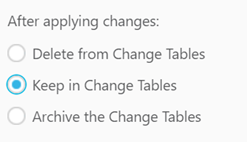
Flexibility to manage change data. When the option to keep changes in change tables is selected, Compose will not delete nor archive the landed data after reading it. Instead, Compose will track which data has been read and which hasn’t. This capability allows users to manage change data to fit their use case as they can reuse change data across Compose and ETL tasks within those projects. Customers can reduce cloud data processing costs for low latency use cases by deleting data at a scheduled maintenance time.
Qlik Hybrid Data Delivery (HDD) to ingest data into DW projects. When users choose to keep changes in change tables, they can now use Qlik Cloud Data Service – Hybrid Data Delivery to land data instead of using Replicate. This option enables flexibility to access and ingest data from different previously inaccessible cloud data sources into a data warehouse and create new data marts.
Reference dimensions. Users would like to use the same dimension in several data marts by reference to manage it once and use it several times with minimal overhead. By reusing dimension tables across data marts, users can break up fact tables into smaller units for both design and data loading while ensuring data consistency for analytics. This reuse improves developer efficiency, data mart design, execution flexibility, and reuse of data sets within Compose by providing conformed reference dimensions.
Data Mart Adjustment Enhancements. As we know, data warehouse automation improves designer agility. Now designers can adjust the data mart without dropping and recreating it, so a lengthy, costly reload of the data mart can be saved. Now users can flexibly control how to handle data mart changes to increase data availability and improve project deployment capabilities.
Second, let us examine improvements to simplify data lake creation.
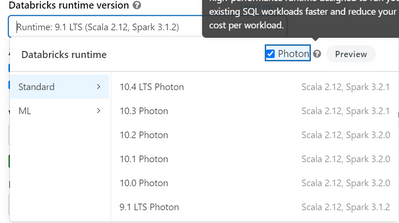
Faster Execution with Databricks Photon. Databricks 9.1 LTS is now certified for Qlik Compose 2021.08 and above. We recommend enabling Photon in your Databricks clusters to boost your existing workloads to execute faster and reduce your data lake query costs.
Live View Performance Enhancements. We now alter Live Views with each change data capture run to ensure pruning Change Table partitions for optimal performance.
Try out the release by going to Support > Downloads on Qlik.com and filtering your options to Qlik Compose version 2022.5.
Check out this eBook for your options for optimizing your experience with data lakes and data warehouses.
Register for the upcoming Data Integration Roadmap Session on September 16 at 11 am EST. Register here
-
Qlik Digest - June 2022
Head to the Product Innovation Blog for the latest release highlights for Qlik Sense, Qlik Replicate and Qlik Enterprise Manager.Watch the latest Qlik... Show MoreHead to the Product Innovation Blog for the latest release highlights for Qlik Sense, Qlik Replicate and Qlik Enterprise Manager.
Watch the latest Qlik Insider Webinar covering new key SaaS capabilities for Data Integration and Analytics including real-time hybrid data delivery and much more.QlikWorld – If you missed the live virtual event you can catch all the great content, including key notes and over 85 breakout sessions on demand. And that was just the beginning! We are gearing up for the QlikWorld Tour coming soon to a city near you – get ready to be informed and inspired!
Customer Success Forum – Join our next Forum happening on June 22 to hear from your fellow Qlik customers on what they have achieved by leveraging the power of Qlik. Register now to reserve your spot.
Do More with Qlik – Watch the latest webinar for beginners and beyond, for a demonstration from Qlik legend Mike Tarallo on a day in the life of a Qlik Cloud Analyst.Qlik Global Transformation Awards – Every year we recognize the customers using Qlik who drive the most remarkable business outcomes through data. Discover the game changing achievements of all 6 winners for 2022 including Siemens and Leroy Merlin.
Qlik Luminary Spotlight – Laura Ashworth is our featured Qlik Luminary for June. As a Senior Qlik Engineer and Architect at Raymond James Financial, Laura creates and implements business intelligence best practices for all departments. Her main goal is to ensure that everyone has access to data and can understand its potential so that they can make better, faster business decisions. Laura is a long time Qlik fanatic, having spoken at QlikWorld Conferences since 2014.
Fun facts about Laura
Favorite Food: Why Chocolate Cake, of course 🙂
Favorite Place in the World: The Blue Ridge Mountains
What is a Qlik Luminary?- Qlik Fix – Check out our series of short videos, designed to give you quick and clear solutions to Qlik questions, like how to download our products, or how to fix a connection lost error.
- Data Brilliant podcast – Ever wondered what it’s like to explore space? Hayley Arceneaux shares her experience on the SpaceX Inspiration4 mission and discusses how data gives confidence and certainty; not just in outer space, but also in the hospital where she works.
- Top pick – QlikWorld Break out session: Building the Active Intelligence Platform How Qlik's Data Integration and Data Analytics portfolios work together to deliver results. Search for code: 665721 to locate the session during the QlikWorld Event.
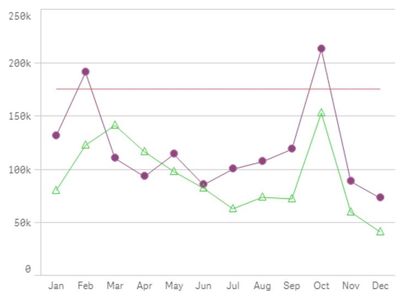
- Quick Qlik Sense tip: To build a line chart with different markers on each line add two measures, one for line and one for the symbol. Be sure to use master measures to keep colors consistent.
This month we want to know how you use Qlik. Have your say in our flash poll and find out how everyone else is voting.
Enjoyed this month’s edition? Subscribe for more news every month.
Connect with us on LinkedIn, Facebook, and Twitter. If you have any comments or feedback we would love to hear from you. Please contact lucy.bannister@qlik.com. -
Recipe for a Pareto Analysis
This type of question is common in all types of business intelligence. I say “type of question” since it appears in many different forms: Sometimes it... Show MoreThis type of question is common in all types of business intelligence. I say “type of question” since it appears in many different forms: Sometimes it concerns products, but it can just as well concern customers, suppliers or sales people. It can really be any dimension. Further, here the question was about turnover, but it can just as well be number of support cases, or number of defect deliveries, etc. It can in principle be any additive measure.
It is called Pareto analysis. Sometimes also known as 80/20 analysis or ABC analysis.
The logic is that you first sort the products according to size, then accumulate the numbers, and finally calculate the accumulated measure as a percentage of the total. The products contributing to the first 80% are your best products; your “A” products. The next 10% are your “B” products, and the last 10% are your “C” products.
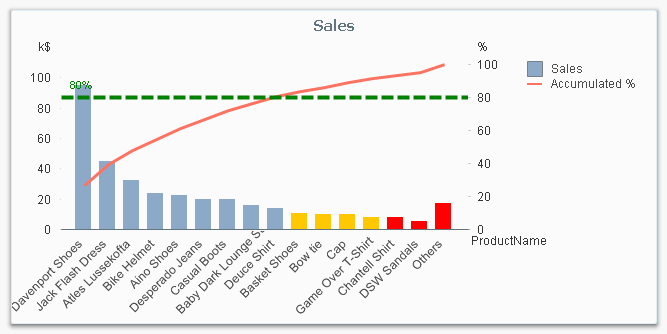
And here’s how you do it in QlikView:
- Create a pivot table and choose your dimension and your basic measure. In my example, I use Product and Sum(Sales).
- Sort the chart descending by using the measure Sum(Sales) as sort expression. It is not enough just to check “Sort by Y-value”.
- Add a second expression to calculate the accumulated sales value:
RangeSum(Above(Sum(Sales), 0, RowNo()))
Call this expression Accumulated Sales. The Above() function will return an array of values – all above values in the chart – and the RangeSum() function will sum these numbers. - Create a third expression from the previous one; one that calculates the accumulated sales in percent:
RangeSum(Above(Sum(Sales), 0, RowNo())) / Sum(total Sales)
Format it as a percentage and call it Inclusive Percentage. - Create a fourth expression from the previous one; one that calculates the accumulated sales in percent, but this time excluding the current row:
RangeSum(Above(Sum(Sales), 1, RowNo())) / Sum(total Sales)
Format it as a percentage and call it Exclusive Percentage. - Create a fifth expression for the ABC classification:
If([Exclusive Percentage] <= 0.8, 'A', If([Exclusive Percentage] <= 0.9, 'B', 'C'))
Call this expression Pareto Class. The reason why the Exclusive Percentage is used, is that the classification should be determined by the lower bound of a product’s segment, not the upper. - Create a conditional background color, e.g.
If([Pareto Class] = 'C', LightRed(), If([Pareto Class] = 'B', Yellow()))
You should now have a table similar to the following. In it you can clearly see the classification of different products.
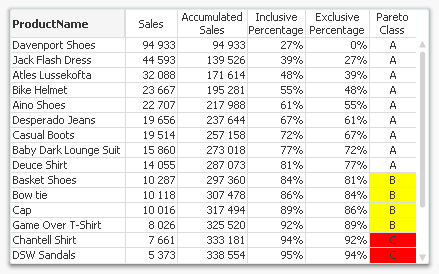
In this table, there are five different expressions that you can use for Pareto analysis. The graph in the beginning of this post uses Sales and Inclusive Percentage for the bars and the line, respectively; and Pareto Class for the coloring of the bars.
Further, you may want to combine the Pareto Class and the Exclusive Percentage into one expression:
Pareto Class =
If(RangeSum(Above(Sum(Sales),1,RowNo())) / Sum(total Sales) <= 0.8, 'A',
If(RangeSum(Above(Sum(Sales),1,RowNo())) / Sum(total Sales) <= 0.9, 'B', 'C'))Good luck in creating your Pareto chart.
Further reading related to this topic:

- Create a pivot table and choose your dimension and your basic measure. In my example, I use Product and Sum(Sales).
-
New Qualification Exams Available!
What are Qlik Sense Qualification Exams? After completing your training, you can validate your fundamental level of Qlik Sense skills by attempting t... Show MoreWhat are Qlik Sense Qualification Exams?
After completing your training, you can validate your fundamental level of Qlik Sense skills by attempting the Qualification Exams. The Qlik Sense Business Analyst and Data Architect Qualification is earned by developing an application and completing a multiple-choice exam which tests your fundamental and applied knowledge. A Qlik Sense Qualification printed certificate and digital badge will be awarded with a minimum passing score of 70%.
What has changed in the exams?
The exams have been updated based on Qlik Sense SaaS editions. In addition, starting with the Qlik Sense 2022 Qualifications, Qlik will be leveraging Credly for badges and certificates. Credly allows you to manage your badges from Qlik and other professional organizations so you can easily share your badges on social media sites. Once you pass the exam, you will receive notifications from the Credly platform that you earned the digital badge and from there you can download the badge and print your certificate.
To ensure members of the Academic Program are not interrupted, we will temporarily keep both the previous Qlik Sense 2021 exams and the new Qlik Sense 2022 exams available until July 18th. After July 18th, the Qlik Sense 2021 exams will be retired.
Where do I take the exams?
The exams are available for free to Qlik Academic Program members and can be taken in the Qlik Learning Portal through the Qlik Continuous Classroom! Simply log into the portal using your Qlik Account, select Programs, go to the Academic Program section and then select Access Resources. The exams are available under the Assessments icon.
If you previously earned a Qualification, you can still access your certificate and digital badge in the Qlik Learning Portal by selecting My Account in the top right-hand corner and selecting the badge icon.
If you are currently an active member of the Qlik Academic Program, you automatically have access to the new qualification exams. To apply to the program as a new member or renew your membership visit our website today!
If you have questions please email academicprogram@qlik.com
-
Qlik Sense Qualification Exams - 2022 Update
Qlik Education is pleased to announce the Business Analyst and Data Architect Qualification Exams have been updated and are based on the SaaS editions... Show MoreQlik Education is pleased to announce the Business Analyst and Data Architect Qualification Exams have been updated and are based on the SaaS editions* of Qlik Sense. However, you may also use Qlik Sense on Windows editions.
After completing the Business Analyst or Data Architect courses in the Continuous Classroom or taking the Create Visualizations with Qlik Sense or the Data Modeling for Qlik Sense instructor-led training, consider earning a Qlik Sense Qualification.
What is a Qualification Exam?
Qualification exams enable you to validate your fundamental level of Qlik Sense skills. The Qlik Sense Business Analyst Qualification is earned after developing an application and completing a multiple-choice exam which tests your fundamental and applied knowledge. A Qlik Sense Qualification Certificate and digital badge will be awarded with a minimum passing score of 70%.
How do I access the Qualification Exams?
The exams are accessed from Qlik Continuous Classroom in the Qlik Learning Portal, where all the latest Qlik training is available on demand, 24/7. Visit the Qlik Sense Business Analyst or Qlik Sense Data Architect Learning Plans --> Qualification Tab to access exams.
What do I receive after I pass?
After you receive a passing score, you will be awarded a certificate and digital badge for sharing on social sites. You will also receive notification from Credly platform that you have earned a digital badge. Credly allows you to manage your badges from Qlik and other professional organizations so you can easily share your badges on social media sites. You will need to simply accept the badge and click the share button or download the badge and certificate to keep for your records. You can even add their badges to your email signature!
Questions? Feedback?
Contact Education@qlik.com.

-
The Academic Program Wraps up 2016!
2016 was an exciting and busy year for the Academic Program which grew by 247 new universities!, The program now expands 64 countries with a total of ... Show More 2016 was an exciting and busy year for the Academic Program which grew by 247 new universities!, The program now expands 64 countries with a total of 709 universities! Some of our new universities include Quinnipiac University in the United States, Cardiff Metropolitan University in the UK, Shailesh J Mehta School Of Management in India, and Universidade do Estado do Para in Brazil.
This year the program also released its Data Analytics curriculum for professors and began offering FREE training though the Qlik Continuous Classroom to professors and students who joined the program!
The first course offered in the curriculum is called Data Visualization. This course features lecture notes, course materials, and student exercises that professors can use to help them teach the history and theory behind Data Visualization. The course is ad-hoc so professors can use some or all of the materials depending on their needs. It also has pre-requisites from the Qlik Continuous Classroom so the materials blend seamlessly with our free training offering.
Students and professors who are accepted into the program are also enrolled in a full-year subscription to free Qlik Sense and QlikView training through on OnDemand learning platform, the Qlik Continuous Classroom. The QCC offers hundreds of videos, take away documents, quizzes and live instructor access! Its an ideal way to learn Qlik at your own pace. To access free training, apply to the program by visiting http://www.qlik.com/us/company/academic-program.
-
Check out Improved Navigation, New Connectors, Blocks, and Templates in the Late...
Qlik Catalog enables the creation of automated workflows that use the metadata stored in the on-premises data catalog. As a result, you can now creat... Show MoreQlik Catalog enables the creation of automated workflows that use the metadata stored in the on-premises data catalog. As a result, you can now create workflows that synchronize metadata between various catalogs for data stewardship.
New Qlik Cloud Catalog API blocks added to the Qlik Cloud Services Connector enables interaction with Qlik Cloud data assets, sets, and stores.
Azure Blob Storage New native cloud storage blocks provide connections to the Microsoft Azure Blob Storage platform. Blobs are encrypted storage solutions that Microsoft offers to store unstructured data.
Qlik Cloud Services Adds New Automations Blocks that enable users to conduct health checks on the usage of automations in an organization, report on the use of specific connectors in a tenant, and provide automation management across tenants.
Qlik Enterprise Manager Build an automation to connect with Qlik Enterprise Manager, the management interface for Qlik Data Integration that helps you design, execute, and monitor Qlik Replicate and Qlik Compose tasks across large business landscapes.
Next, we would like to introduce new alerting templates and a new template to store a straight table as a CSV file on Amazon S3. Each template is linked to a “Getting Started” article in Community. The three new alerting templates provide email notifications in the following situations:
- Alert app owners about apps without reloads in the past X days—App owners receive a list of apps that have not been reloaded in a specified number of days or apps that have been created but not reloaded.
- Alert app owners about apps that have not been accessed in the last 28 days.
- Alert app owners and tenant admins about orphaned data connections.
Store a straight table as a CSV file on Amazon S3, store a straight table from a Qlik Sense app to a CSV file on Amazon S3.
Conclusion
Qlik Application Automation enables users to build workflows from data warehouses and lakes into business applications that trigger alerts and actions in response to changes in data across all departments. Application Automation optimizes processes, integrates SaaS applications, and drives actions. Take a look at a YouTube demo here, more about Qlik Application Automation here, and download an ebook on Application Automation here.
-
The Academic Program visits the Politecnico di Torino
During the academic year we receive requests for guest lectures and workshops throughout the EMEA region. Luckily, I have a group of fantastic champio... Show MoreDuring the academic year we receive requests for guest lectures and workshops throughout the EMEA region. Luckily, I have a group of fantastic champions who support activity in their region and run these workshops in local languages. A couple of weeks ago our champion for the Italy, Lucia Grassi, visited the Politecnico di Torino to deliver one of our Academic Program workshops. This session was run in person for master’s students studying Business Intelligence for Big Data and there were 124 students in attendance. In most cases we would have a few Qlik members support a group of this size, but Lucia did an excellent job of guiding these students through the workshop by herself. Lucia introduced the students to Qlik and to the Qlik Academic Program, before taking them through the necessary steps to build their first app. Thank you @LuciaGrassi for your hard work and amazing support of our program!
-
New Qlik Data Integration Learning Plans
We have added new Qlik Data Integration learning plans to Qlik Continuous Classroom. Select Data Architect for New Users Learning Plan from the Qlik C... Show MoreWe have added new Qlik Data Integration learning plans to Qlik Continuous Classroom. Select Data Architect for New Users Learning Plan from the Qlik Continuous Classroom menu to access the Qlik Replicate and Qlik Compose Learning Plans. Once the new user plan is completed, we recommend additional courses where you can explore advanced topics and next steps!
-
Celebrate Diversity and Autism Awareness Month by Reframing a Data-Informed Deci...
In his new post, Qlik's Chief Learning Officer Kevin Hanegan explain the power of perspective, when perceptions create our reality. With this month b... Show MoreIn his new post, Qlik's Chief Learning Officer Kevin Hanegan explain the power of perspective, when perceptions create our reality. With this month being both Diversity and Autism Awareness month, he shares his thoughts on the importance of exploring a variety of perspectives, becoming aware of any implicit bias that exists, and embracing diversity at both a personal and a professional level.
Read the full article: https://blog.qlik.com/celebrate-diversity-and-autism-awareness-month-by-reframing-a-data-informed-decision

-
【オンデマンド配信】アクティブ インテリジェンス フォーラム 2022
国内大手 3 社が語る DX 推進成功例- コマツ、学研、トリドールの Qlik によるデータ活用例とは - 昨今、データ活用による DX 推進は、あらゆる企業において最重要事項となっております。特に「リアルタイムデータに基づいた迅速な意思決定と行動」というアクティブインテリジェンスの考え方の重要性... Show More国内大手 3 社が語る DX 推進成功例
- コマツ、学研、トリドールの Qlik によるデータ活用例とは -昨今、データ活用による DX 推進は、あらゆる企業において最重要事項となっております。特に「リアルタイムデータに基づいた迅速な意思決定と行動」というアクティブインテリジェンスの考え方の重要性は、コロナ禍を経てますます高まっております。 Qlik では、このアクティブインテリジェンスを実現するために、生データから行動までを支援するエンドツーエンドの分析データパイプラインを提供しています。
本 Web セミナーでは、Qlik が提供するソリューションの最新情報をご紹介します。
※ 参加費無料。パソコン・タブレット・スマートフォンで、どこからでもご視聴いただけます。
-
【オンデマンド配信】『DNP の価値創造プロセス』を実現するためのデータ利活用の推進
DNP 様におけるビジネス推進のためのデータ利活用について、インタビュー形式で実際の取り組みを具体的に語っていただきます。ビジネス課題を解決するためのアクションと成果とは?Qlik 導入を機に全社におけるデータ活用への取り組み、今後の展望などを語っていただきます。ぜひ、ご視聴ください。 ※ 参加費無... Show More -
Introducing Application Automation and Reporting Service Usage Reports
We’re encouraging customers to make use of the free tier of monthly service (5000 runs for Application Automation and 100 reports for Reporting Servic... Show MoreWe’re encouraging customers to make use of the free tier of monthly service (5000 runs for Application Automation and 100 reports for Reporting Service) as their business needs require and to gain the most benefit. We are excited to see growing adoption across the board. To that end, we’ll be introducing a monthly Usage Report for customers using either of the services beyond their monthly entitled limit to simply let them know their service usage and to provide them with our recommended tier based on that usage. Monthly usage reports will be sent to our customer account owners, and tenant admins, who can discuss a suggested service tier with either Qlik Support or their Qlik account team directly.
We’re excited to see a thriving, growing adoption of our Qlik Cloud platform, and more importantly, helping our customers increase the value of their investment with each release and innovation.
-
And The Winner Is..
Congratulations to Thomas De Dobbeleer and Rutger Mols, team AtTwice from Thomas More in Belgium for winning our 2022 global Qlik Academic Program Qli... Show MoreCongratulations to Thomas De Dobbeleer and Rutger Mols, team AtTwice from Thomas More in Belgium for winning our 2022 global Qlik Academic Program QlikWorld Datathon!
This February Qlik launched a Datathon, a challenge to help develop solutions towards achieving three of the United Nations 17 Sustainable Development Goals: Goal 13 Climate Action, Goal 14 Life Below Water, and Goal 15 Life on Land. All three of these climate goals are focused on protecting our planet. We invited Qlik Academic Program students from across the globe to use Qlik software to develop data and analytic solutions for the global climate challenges we face because there is no Planet B! Students were able to design their solution based on the challenge objectives and two finalists were announced in April. During the three-day event, QlikWorld Online participants had the opportunity to watch presentations by each of our Datathon challenge finalists and then vote for their favorite. The votes are in, and team AtTwice was chosen as the winner! If you were unable to attend QlikWorld Online, it is not too late to watch the Datathon presentation. If you are interested in participating in a future Datathon or would like to join our program, register today for the Qlik Academic Program and receive free access to our software, training and other learning resources!
Meet our winning team to learn more about their journey!
They participated in the Datathon during their internship at At Once which is a consulting company and Qlik Partner. They credit At Once for giving them the opportunity to spend time on both the Datathon and customer projects. Explaining "The Qlik Academic Program Datathon was ideal for expanding our knowledge of Qlik in between our internship projects. Taking a break and focusing on another project like the Datathon was a pleasant change". They also share their thanks to both the Qlik Academic Program and the internship saying "At Once and the Qlik Datathon have made us warm to work further in data visualization with Qlik Sense in the future."
Rutger Mols is from Poederlee, Belgium, a village in the province of Antwerp where he currently lives with his parents and younger brother. In his free time, he likes biking, going to the bars with friends, and being a trainer of the U9. On occasion, he plays in the KVC Lille United soccer club. Rutger is a senior at university, and he is studying Applied Computer Science. Upon graduation, he would like to find a job as a BI consultant so he can work in a social environment but continue his passion for IT. When asked about the Datathon challenge Rutger shares “I personally think that the 17 sustainable goals are a very good guideline in improving our world. I think/hope that by now these goals are generally known and paid attention to. Let us hope that we can work with these guidelines and focus on an even better world and future.”
Thomas De Dobbeleer was born in Belgium and has been living there for most of his life. He lives in a town called Vosselaar but he attends university in Geel, Belguim. When he is not studying, he loves to read, travel, and take part in winter sports. He also loves going on holiday to surf! Thomas is also an undergraduate student studying Applied Computer Science. He chose that discipline because he enjoys the mix of Artificial Intelligence and Business Intelligence. Thomas is also considering being a consultant upon graduation. Through his experience with the Datathon, he believes it could be fun to help companies bring life to their data with the help of Qlik. When discussing his interest in the Datathon challenge, he expressed “I am very conscious about the sustainable goals. Because I travel a lot, I see a lot of things that we are doing wrong. The biggest things I notice are deforestation and littering. That’s why I thought this Datathon was very interesting in my case.”
Congratulations again to Thomas and Rutger!