Unlock a world of possibilities! Login now and discover the exclusive benefits awaiting you.
- Qlik Community
- :
- All Forums
- :
- QlikView App Dev
- :
- Creating a bar chart with 2 dimensions and 2 expre...
- Subscribe to RSS Feed
- Mark Topic as New
- Mark Topic as Read
- Float this Topic for Current User
- Bookmark
- Subscribe
- Mute
- Printer Friendly Page
- Mark as New
- Bookmark
- Subscribe
- Mute
- Subscribe to RSS Feed
- Permalink
- Report Inappropriate Content
Creating a bar chart with 2 dimensions and 2 expressions
Hello everyone,
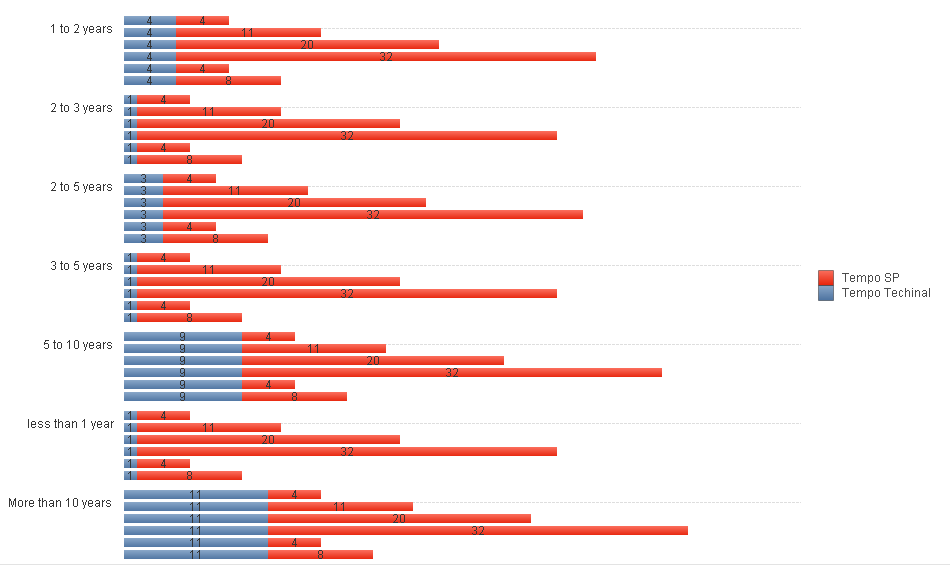
I am new to QlikView and i am trying to create a bar chart with two dimensions from two different tables, and both dimensions has the same values. I also create two expressions to count the total of each one.
The chart is presenting the correct values, however it displays the same value in each line, as you can see in the print screen below:
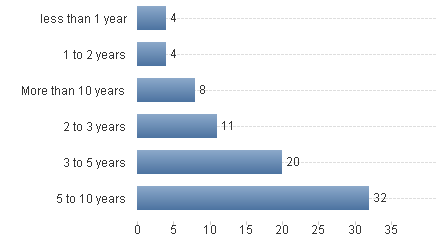
When i create the chart using only one dimension and one expression, the chart is displayed correctly, as shown in the print screen below:

What i have to do to show both dimensions in one single line as presented in the chart above??
Thanks in advance,
Rodrigo
- Tags:
- new_to_qlikview
- Mark as New
- Bookmark
- Subscribe
- Mute
- Subscribe to RSS Feed
- Permalink
- Report Inappropriate Content
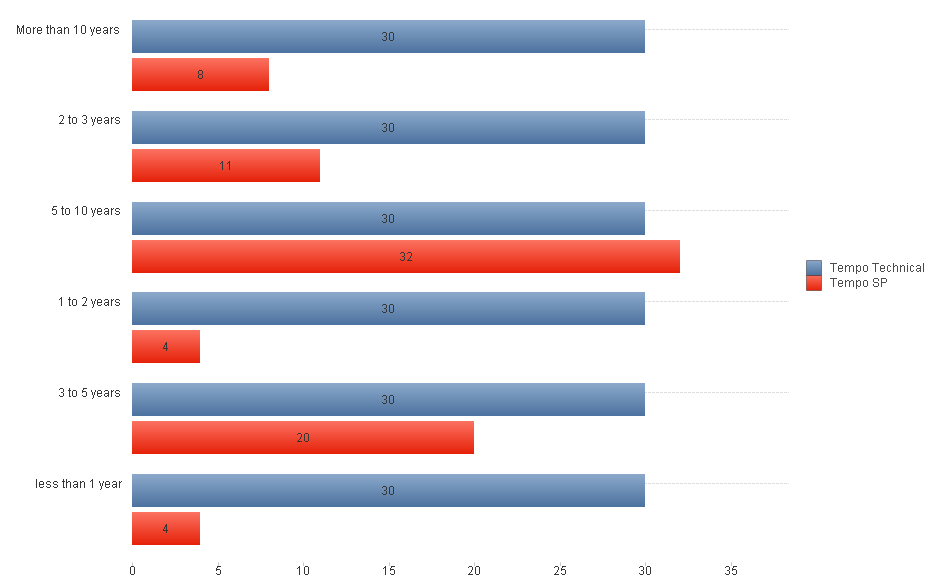
No, the value of 79 in red is incorrect for any of the dimensions.
I have created a chart with the correct values for this second dimension:
There is no value 79...
- Mark as New
- Bookmark
- Subscribe
- Mute
- Subscribe to RSS Feed
- Permalink
- Report Inappropriate Content
i see but the total of all of the bars adds up to 79 (4 + 4 + 8 + 11 + 20 + 32)
- Mark as New
- Bookmark
- Subscribe
- Mute
- Subscribe to RSS Feed
- Permalink
- Report Inappropriate Content
Unfortunately my project can´t be shared, i will try to make a new qvw with only this chart, without the others i have in this project.
I want the bars grouped (like in the example above) and doesn´t metter if they are stacked or not.
- Mark as New
- Bookmark
- Subscribe
- Mute
- Subscribe to RSS Feed
- Permalink
- Report Inappropriate Content
I am still thinking you need to get to 1 dimension
any chance of gett a qvw?
- Mark as New
- Bookmark
- Subscribe
- Mute
- Subscribe to RSS Feed
- Permalink
- Report Inappropriate Content
Excatly... But why it shows the sum of the bars??
I just create a expression of count.
- Mark as New
- Bookmark
- Subscribe
- Mute
- Subscribe to RSS Feed
- Permalink
- Report Inappropriate Content
When i change the dimension i choose to use in the chart for the second dimension, it shows the correct values, otherwise the other dimension shows the sum again:
- Mark as New
- Bookmark
- Subscribe
- Mute
- Subscribe to RSS Feed
- Permalink
- Report Inappropriate Content
Hi Adam,
Follow attached the qvw.
Hope you can help me.
Thanks,
Rodrigo
- Mark as New
- Bookmark
- Subscribe
- Mute
- Subscribe to RSS Feed
- Permalink
- Report Inappropriate Content
my guess is that you cannot name them the same, at least in what you sent becasue those are the only fields in the table.
I would suggest coming up with a common name for the dimension and load both fiels as that name - I would also include other fields from the tables as well. I cannot verify as I do not have the data and cannot perform a reload - sorry
- Mark as New
- Bookmark
- Subscribe
- Mute
- Subscribe to RSS Feed
- Permalink
- Report Inappropriate Content
I just ignore the others fields in this example, but in the original project the other fields are not ignored.
Anyway, those fields cannot have a common name for the dimension, because i should show the 2 dimensions separetely.
- Mark as New
- Bookmark
- Subscribe
- Mute
- Subscribe to RSS Feed
- Permalink
- Report Inappropriate Content
you can have 1 dimension with 2 expressions and the expressions is what would make them unique with the red and blue bar