Unlock a world of possibilities! Login now and discover the exclusive benefits awaiting you.
- Qlik Community
- :
- All Forums
- :
- QlikView App Dev
- :
- Creating a bar chart with 2 dimensions and 2 expre...
- Subscribe to RSS Feed
- Mark Topic as New
- Mark Topic as Read
- Float this Topic for Current User
- Bookmark
- Subscribe
- Mute
- Printer Friendly Page
- Mark as New
- Bookmark
- Subscribe
- Mute
- Subscribe to RSS Feed
- Permalink
- Report Inappropriate Content
Creating a bar chart with 2 dimensions and 2 expressions
Hello everyone,
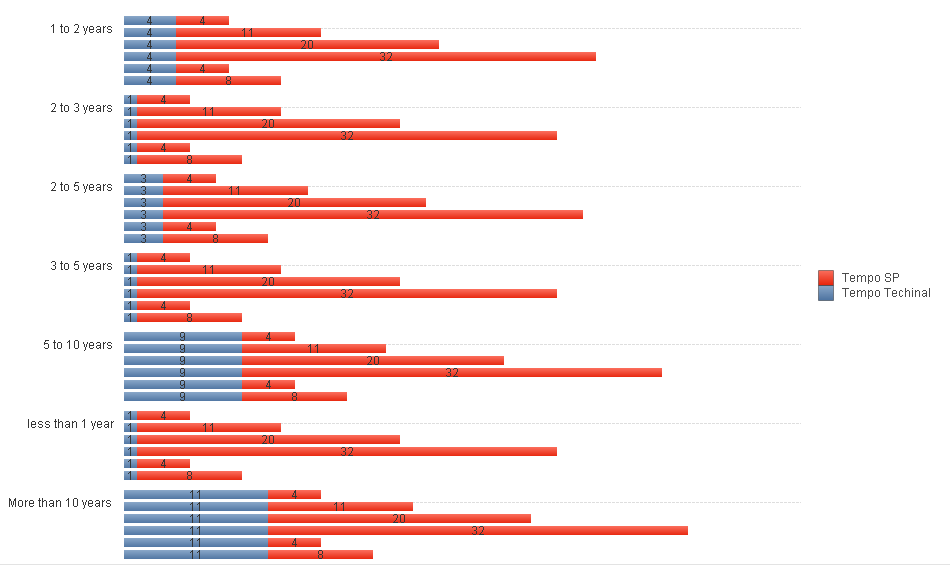
I am new to QlikView and i am trying to create a bar chart with two dimensions from two different tables, and both dimensions has the same values. I also create two expressions to count the total of each one.
The chart is presenting the correct values, however it displays the same value in each line, as you can see in the print screen below:
When i create the chart using only one dimension and one expression, the chart is displayed correctly, as shown in the print screen below:
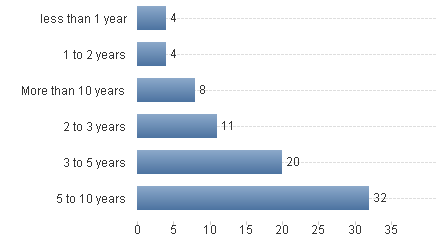
What i have to do to show both dimensions in one single line as presented in the chart above??
Thanks in advance,
Rodrigo
- Tags:
- new_to_qlikview
- « Previous Replies
- Next Replies »
- Mark as New
- Bookmark
- Subscribe
- Mute
- Subscribe to RSS Feed
- Permalink
- Report Inappropriate Content
sorry for the confustion - this new key/field is instead of renaming the other fields to be the same.
Please have the names back as they were initially, create this new key field in both tables and then you the new field as the dimension for the table and your 2 initial expressions.
you will have a field named rotulo tempo roche sp and another one called rotulo tempo roche like you had before. The new field will be the concatenation of the 2 fields - sometimes gets confusing when trying to explain in writing - if this does not work, you may want to call Qlik support
- « Previous Replies
- Next Replies »