Unlock a world of possibilities! Login now and discover the exclusive benefits awaiting you.
- Qlik Community
- :
- All Forums
- :
- QlikView App Dev
- :
- Re: Stacked bar, 2 dim, values as 100% of 1 of the...
- Subscribe to RSS Feed
- Mark Topic as New
- Mark Topic as Read
- Float this Topic for Current User
- Bookmark
- Subscribe
- Mute
- Printer Friendly Page
- Mark as New
- Bookmark
- Subscribe
- Mute
- Subscribe to RSS Feed
- Permalink
- Report Inappropriate Content
Grouped bar, 2 dim, values as 100% of 1 of the dim
I need to have a stacked bar where I have:
Year
Dim2
Sum(measure)
I want to show the Sum(measure) for Dim2 as 100% of Year total.
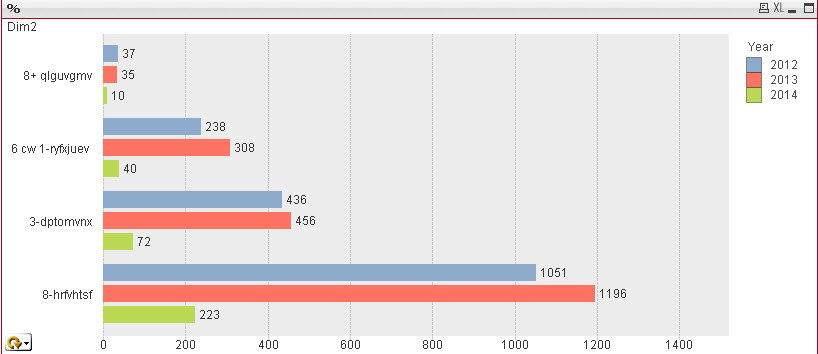
each bar should be 100% for each corresponding year.
I cannot get this to work.
If I add aggr I only get the total for 1 of the Dim2, not for each Dim2.
Thanks for the help
Accepted Solutions
- Mark as New
- Bookmark
- Subscribe
- Mute
- Subscribe to RSS Feed
- Permalink
- Report Inappropriate Content
Like this?
- Mark as New
- Bookmark
- Subscribe
- Mute
- Subscribe to RSS Feed
- Permalink
- Report Inappropriate Content
Like This?
- Mark as New
- Bookmark
- Subscribe
- Mute
- Subscribe to RSS Feed
- Permalink
- Report Inappropriate Content
Try to invert the order of the dimensions...
Hope this helps
MC
- Mark as New
- Bookmark
- Subscribe
- Mute
- Subscribe to RSS Feed
- Permalink
- Report Inappropriate Content
Another example.
Edit.. Example updated.
- Mark as New
- Bookmark
- Subscribe
- Mute
- Subscribe to RSS Feed
- Permalink
- Report Inappropriate Content
No.
For year 2012 the the 5 values of Dim2 need to be calculated against the total for year 2012.
Then I want to see in each Dim2 3 bars representing the 3 selected years.
The bars for each year are accumulated 100%.
So the bars represent the % like this in straight table form:
Dim2 Year Value %
1 2012 10 10%
2 2012 15 15%
3 2012 40 40%
4 2012 15 15%
5 2012 10 10%
1 2013 10 10%
2 2013 10 10%
3 2013 45 45%
4 2013 15 15%
5 2013 10 10%
etc
- Mark as New
- Bookmark
- Subscribe
- Mute
- Subscribe to RSS Feed
- Permalink
- Report Inappropriate Content
I meant a grouped bar 
- Mark as New
- Bookmark
- Subscribe
- Mute
- Subscribe to RSS Feed
- Permalink
- Report Inappropriate Content
Like this?
- Mark as New
- Bookmark
- Subscribe
- Mute
- Subscribe to RSS Feed
- Permalink
- Report Inappropriate Content
did you try sth like:
sum(Amount)/sum(Total <YEAR> Amount)
?
Fabrice
- Mark as New
- Bookmark
- Subscribe
- Mute
- Subscribe to RSS Feed
- Permalink
- Report Inappropriate Content
Hi Michiel,
try this expression: Sum(measure) / Sum(TOTAL<Dim2> measure)
and on the 'Numbers' tab click on 'Show in Percent (%)'.
Enjoy
Burkhard
-
Forums
- Data Integration & Quality
- Analytics
- AI/ML
- Forums by Product
-
Groups
- Industry and Topics
- Location and Language
- Leader