Unlock a world of possibilities! Login now and discover the exclusive benefits awaiting you.
- Qlik Community
- :
- All Forums
- :
- QlikView App Dev
- :
- How do I display last 30 days, but accumulate from...
- Subscribe to RSS Feed
- Mark Topic as New
- Mark Topic as Read
- Float this Topic for Current User
- Bookmark
- Subscribe
- Mute
- Printer Friendly Page
- Mark as New
- Bookmark
- Subscribe
- Mute
- Subscribe to RSS Feed
- Permalink
- Report Inappropriate Content
How do I display last 30 days, but accumulate from entire data set in a chart
I am tasked with creating some metrics based on currently selected data.
Currently I use an "auto-sizing" dimension variable that changes the chart dimension based on how much data is available. I am also (thanks to help from here) now able to accumulate proper numbers over time. I allow the users to select several different fields from list boxes to narrow down what the chart shows.
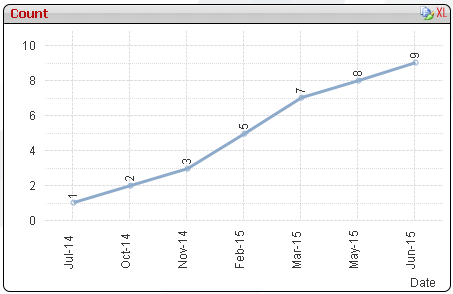
What I need to do now is shrink the visible window in the chart to the past 30 days, but accumulate over the entire data set so that the last number display is the current total of all issues based on selections. Below is a copy of my chart, and the dimension I currently use.
Based on experimentation, if I use set analysis in my expression and use the 1, it would appear to invalidate selections made by the user. I currently use the $ to do analysis based on current selections.
How do I limit my view to 30 days without impacting my accumulated values?
Expression:
Count(DISTINCT {$<[Target Gate] = {'Alpha - platform'}>} [Master ID])
Dimension:
=if(GetPossibleCount([CreatedDate]) <=36, Date([CreatedDate], 'YYYY-MM-DD'),
if(GetPossibleCount([Created MonthYear]) <= 36, Date([Created MonthYear],'MMM-YY'),
[Year]
)
)
- « Previous Replies
-
- 1
- 2
- Next Replies »
Accepted Solutions
- Mark as New
- Bookmark
- Subscribe
- Mute
- Subscribe to RSS Feed
- Permalink
- Report Inappropriate Content
Script:
Table:
LOAD *,
Date(Floor(CreatedDate)) as Date,
MonthName(CreatedDate) as MonthYear;
LOAD [Master ID],
CreatedDate,
[Issue Status]
FROM
Community_173461.xlsx
(ooxml, embedded labels, table is Sheet1);
Dimension:
MonthYear
Expression:
If(Count(DISTINCT {<Date = {"$(='>=' & Date(AddMonths(MonthStart(Max(Date)), -1)) & '<=' & Date(MonthEnd(Max(Date))))"}, MonthYear = >}[Master ID]) > 0,
RangeSum(Above(Count(DISTINCT {<MonthYear = >} [Master ID]), 0, RowNo())))
- Mark as New
- Bookmark
- Subscribe
- Mute
- Subscribe to RSS Feed
- Permalink
- Report Inappropriate Content
Are you using full accumulation in your chart? If that's true you won't be able to display partially and yet show full accumulation. For this you will have to use RangeSum(Above()) functions. Do you have a sample data you can share?
- Mark as New
- Bookmark
- Subscribe
- Mute
- Subscribe to RSS Feed
- Permalink
- Report Inappropriate Content
I am using full accumulation. Here is a sample of the data I'm using (I've cut it down from the several thousand items it actually is). The CreatedDate field is a calendar table linked to a master calendar:

- Mark as New
- Bookmark
- Subscribe
- Mute
- Subscribe to RSS Feed
- Permalink
- Report Inappropriate Content
Is it possible to give this data in a excel file? I would have to type that information in manually otherwise.
Thanks,
Sunny
- Mark as New
- Bookmark
- Subscribe
- Mute
- Subscribe to RSS Feed
- Permalink
- Report Inappropriate Content
Here is the sample data in Excel format.
- Mark as New
- Bookmark
- Subscribe
- Mute
- Subscribe to RSS Feed
- Permalink
- Report Inappropriate Content
See if this helps?

- Mark as New
- Bookmark
- Subscribe
- Mute
- Subscribe to RSS Feed
- Permalink
- Report Inappropriate Content
My Qlikview program is telling me if I open that file, I won't be able to open any other files created with my current key.
Any way to post the Dimension and Expression used?
It looks like what I need.
- Mark as New
- Bookmark
- Subscribe
- Mute
- Subscribe to RSS Feed
- Permalink
- Report Inappropriate Content
Script:
Table:
LOAD *,
Date(Floor(CreatedDate)) as Date,
MonthName(CreatedDate) as MonthYear;
LOAD [Master ID],
CreatedDate,
[Issue Status]
FROM
Community_173461.xlsx
(ooxml, embedded labels, table is Sheet1);
Dimension:
MonthYear
Expression:
If(Count(DISTINCT {<Date = {"$(='>=' & Date(AddMonths(MonthStart(Max(Date)), -1)) & '<=' & Date(MonthEnd(Max(Date))))"}, MonthYear = >}[Master ID]) > 0,
RangeSum(Above(Count(DISTINCT {<MonthYear = >} [Master ID]), 0, RowNo())))
- Mark as New
- Bookmark
- Subscribe
- Mute
- Subscribe to RSS Feed
- Permalink
- Report Inappropriate Content
Ok, took me a little while to parse what you were doing (date math in Set Analysis still messes with my head sometimes).
I have it working, and it gives me two months.
However I'm trying to understand the set analysis you've got in there as I'm sure it will come in handy in other places.
I am assuming by specifying no modifier the set analysis takes places on the currently selected data?
I understand the Date= at the start of the set analysis. Everything after that I'm lost. It looks like a Set Analysis inside a set analysis?
I also don't understand the MonthYear = at the end. Is that stating that as long as there's a value for MonthYear, make the comparison?
I'm asking because I'm going to convert this expression so I chart MonthDay, instead of MonthYear.
- Mark as New
- Bookmark
- Subscribe
- Mute
- Subscribe to RSS Feed
- Permalink
- Report Inappropriate Content
Best way to understand the date math is to put the middle part in a test box object to see what it evaluates to. This
='>=' & Date(AddMonths(MonthStart(Max(Date)), -1)) & '<=' & Date(MonthEnd(Max(Date)))
So I am telling the expression to only select dates between this range and MonthYear = means that disregard any selections made in MonthYear field because I am controlling MonthYear indirectly through Date field.
Does that clear some things?
- « Previous Replies
-
- 1
- 2
- Next Replies »