Unlock a world of possibilities! Login now and discover the exclusive benefits awaiting you.
- Qlik Community
- :
- All Forums
- :
- QlikView App Dev
- :
- How to display the week date range on the X Axis o...
- Subscribe to RSS Feed
- Mark Topic as New
- Mark Topic as Read
- Float this Topic for Current User
- Bookmark
- Subscribe
- Mute
- Printer Friendly Page
- Mark as New
- Bookmark
- Subscribe
- Mute
- Subscribe to RSS Feed
- Permalink
- Report Inappropriate Content
How to display the week date range on the X Axis of a chart?
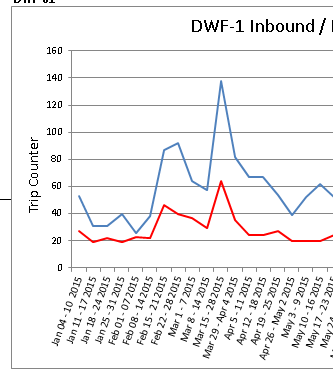
I am trying to replicate a report produced in excel where the chart displays the date range for the weeks of the year. For example if I wanted to show the date range for week 2 I would want to show 1/3/2016-1/9/2016 and so on. I have included a snapshot of what it is I'm trying to replicate. The expression suggested for to use is =dual(WeekStart([Date]) & ' - ' & WeekEnd([Date]),[Week Number]) however I would like to be able to script it as a part of my calendar.
- Tags:
- qlikview_scripting
Accepted Solutions
- Mark as New
- Bookmark
- Subscribe
- Mute
- Subscribe to RSS Feed
- Permalink
- Report Inappropriate Content
Hi,
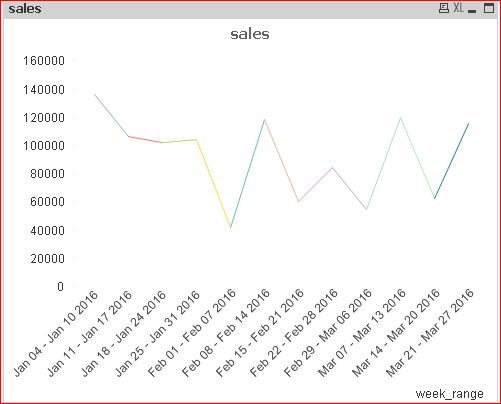
I think you can use the Same function in script also. try the example, the weekrange will be the part of your calendar.
LOAD Date,Week(Date) as Week,
dual(Date(WeekStart(Date),'MMM DD') & ' - ' & Date(WeekEnd(Date),'MMM DD YYYY'),Week(Date)) as week_range,
floor(Rand()*25000) as sales;
LOAD Date('1/1/2016'+RecNo()-1) as Date
AutoGenerate 366;
- Mark as New
- Bookmark
- Subscribe
- Mute
- Subscribe to RSS Feed
- Permalink
- Report Inappropriate Content
Hi,
Try using the Class function.
Have a look at the link.
https://community.qlik.com/docs/DOC-9195
Regards,
Kaushik Solanki
- Mark as New
- Bookmark
- Subscribe
- Mute
- Subscribe to RSS Feed
- Permalink
- Report Inappropriate Content
Hi,
I think you can use the Same function in script also. try the example, the weekrange will be the part of your calendar.
LOAD Date,Week(Date) as Week,
dual(Date(WeekStart(Date),'MMM DD') & ' - ' & Date(WeekEnd(Date),'MMM DD YYYY'),Week(Date)) as week_range,
floor(Rand()*25000) as sales;
LOAD Date('1/1/2016'+RecNo()-1) as Date
AutoGenerate 366;
- Mark as New
- Bookmark
- Subscribe
- Mute
- Subscribe to RSS Feed
- Permalink
- Report Inappropriate Content
HI,
Create a WeekRange column in script like below
LOAD Date,
Dual(Date(WeekStart(Date),'MMM DD') & ' - ' & Date(WeekEnd(Date),'MMM DD YYYY'), WeekStart(Date)) AS WeekRange
FROM DataSource;
Now use WeekRange column in your chart.
Regards,
Jagan.
- Mark as New
- Bookmark
- Subscribe
- Mute
- Subscribe to RSS Feed
- Permalink
- Report Inappropriate Content
Thank you this definitely helped. 
- Mark as New
- Bookmark
- Subscribe
- Mute
- Subscribe to RSS Feed
- Permalink
- Report Inappropriate Content
Thank you definitely helped.
- Mark as New
- Bookmark
- Subscribe
- Mute
- Subscribe to RSS Feed
- Permalink
- Report Inappropriate Content
Appreciate everyone's help.
- Mark as New
- Bookmark
- Subscribe
- Mute
- Subscribe to RSS Feed
- Permalink
- Report Inappropriate Content
Hi,
another solution to treat weeks having start and end dates in different months or years (like in your screenshot) could be:
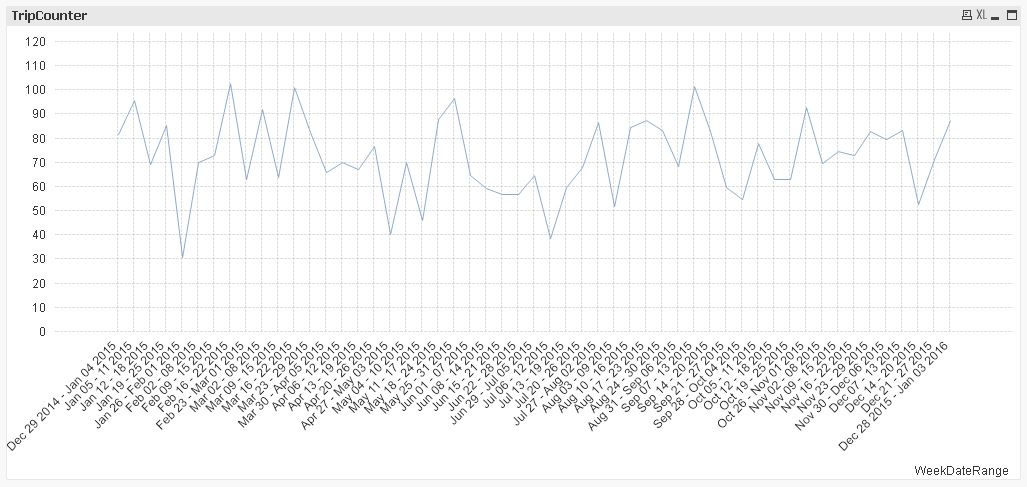
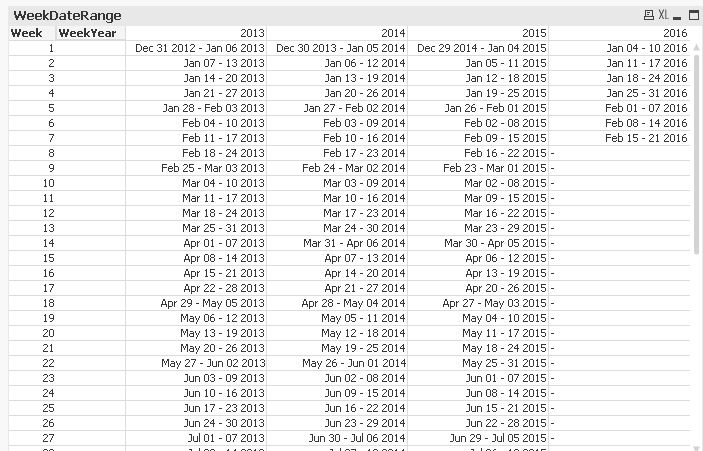
table1:
LOAD *,
    Dual(Date(WeekStart,'MMM DD'&If(Year(WeekStart)<>Year(WeekEnd),' YYYY'))&' - ' &Date(WeekEnd,If(Month(WeekStart)<>Month(WeekEnd),'MMM ')&'DD YYYY'),WeekStart) as WeekDateRange;
LOAD *,
    Day(Date) as Day,
    WeekDay(Date) as WeekDay,
    Week(Date) as Week,
    WeekStart(Date) as WeekStart,
    WeekEnd(Date) as WeekEnd,
    WeekName(Date) as WeekName,
    Month(Date) as Month,
    MonthName(Date) as MonthName,
    Dual('Q'&Ceil(Month(Date)/3),Ceil(Month(Date)/3)) as Quarter,
    QuarterName(Date) as QuarterName,
    Year(Date) as Year,
    WeekYear(Date) as WeekYear;
LOAD Date(MakeDate(2013)+IterNo()-1) as Date,
    Ceil(Rand()*150) as TripCounter
AutoGenerate 1
While MakeDate(2013)+IterNo()-1<=Today();
hope this helps
regards
Marco
- Mark as New
- Bookmark
- Subscribe
- Mute
- Subscribe to RSS Feed
- Permalink
- Report Inappropriate Content
Hi,
If you got the answer please close this thread by giving Correct Answer to the post which helps you.
Regards,
jagan.