Unlock a world of possibilities! Login now and discover the exclusive benefits awaiting you.
- Qlik Community
- :
- All Forums
- :
- QlikView App Dev
- :
- How to group multiple categories into an "Other" c...
- Subscribe to RSS Feed
- Mark Topic as New
- Mark Topic as Read
- Float this Topic for Current User
- Bookmark
- Subscribe
- Mute
- Printer Friendly Page
- Mark as New
- Bookmark
- Subscribe
- Mute
- Subscribe to RSS Feed
- Permalink
- Report Inappropriate Content
How to group multiple categories into an "Other" category in a bar chart?
I'm new to Qlik Sense.
I have data with a column, call it Clolsed_Loss which shows if something is Closed, or if it is lost, but there are multiple lost categories:
IE the data reads like:
Item Closed_Loss
1 Closed
2 Lost - Pricing
3 Lost - Remained with Incumbent
4 Lost - Competior had more experience
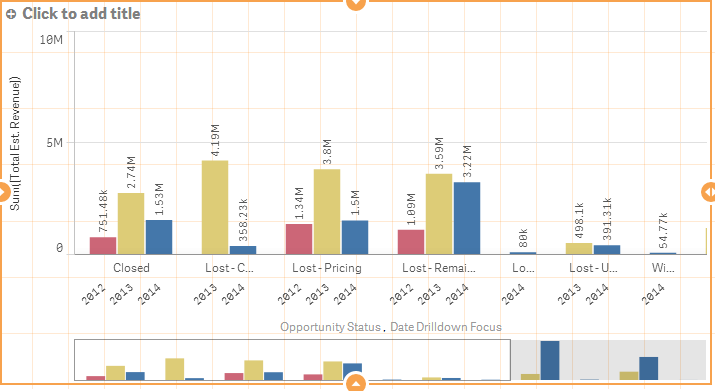
In my bar graph, I want to group all losses (Which is everything that is not "Closed") as simply a "Lost" category under 1 bar.
Currently my data appears as this, and each lost item is separated out. Ideally I want two groups of bars, one for Closed, one for Lost.
I know I can edit the data in excel, create another column, and write an easy formula to either say Won or Lost, but I want to learn how to do this in Qlik.
- Tags:
- new_to_qlikview
Accepted Solutions
- Mark as New
- Bookmark
- Subscribe
- Mute
- Subscribe to RSS Feed
- Permalink
- Report Inappropriate Content
When you read the files from Excel you can change it in the load statement:
Table:
Load *,
if(left(Closed_Loss,4)='Lost', 'Lost', 'Closed') as new_Closed_loss
from ExcelFile.xls
....;
Then you can use that as your dimension.
I see that the picture you have posted is from Qlik Sense, but you have posted this in New to QlikView. The scripting part is mostly the same so give it a try 
- Mark as New
- Bookmark
- Subscribe
- Mute
- Subscribe to RSS Feed
- Permalink
- Report Inappropriate Content
When you read the files from Excel you can change it in the load statement:
Table:
Load *,
if(left(Closed_Loss,4)='Lost', 'Lost', 'Closed') as new_Closed_loss
from ExcelFile.xls
....;
Then you can use that as your dimension.
I see that the picture you have posted is from Qlik Sense, but you have posted this in New to QlikView. The scripting part is mostly the same so give it a try
- Mark as New
- Bookmark
- Subscribe
- Mute
- Subscribe to RSS Feed
- Permalink
- Report Inappropriate Content
Thank you, this worked (and yes, it worked in Qlik View, I had difficulty finding the Qlik Sense Forum)
As a learning experience, could you help me a bit more?
I originally simplified my question, but I actually have additional criteria that starts with “Withdrawn” that I’d like grouped into “Lost”. I am very familiar with Excel, so I thought I could use an OR statement, but to no avail.
I know I could make another line of code, replacing ‘lost’ with ‘with’, but how can I do it properly?
Here's how I tried to implement OR
IF(OR(LEFT(Closed_Loss,4)='Lost',LEFT(Closed_Loss,4)='with'),'Lost', 'Closed')) as new_Closed_loss,
- Mark as New
- Bookmark
- Subscribe
- Mute
- Subscribe to RSS Feed
- Permalink
- Report Inappropriate Content
You are correct, except for the placement of the or. Or is not a funtion in the same sense as if.
IF(LEFT(Closed_Loss,4)='Lost' OR LEFT(Closed_Loss,4)='with','Lost', 'Closed') as new_Closed_loss,
another alternative is to use nested ifs.
IF has the syntax IF(Condition, then, else)
Using this you can write it as:
IF(LEFT(Closed_Loss,4)='Lost' ,'Lost',IF(LEFT(Closed_Loss,4)='with','Lost', 'Closed')) as new_Closed_loss,
- Mark as New
- Bookmark
- Subscribe
- Mute
- Subscribe to RSS Feed
- Permalink
- Report Inappropriate Content
You’re a true baller, Simen. Thank you.