Unlock a world of possibilities! Login now and discover the exclusive benefits awaiting you.
- Qlik Community
- :
- All Forums
- :
- QlikView App Dev
- :
- How to list the data that match the user selection...
- Subscribe to RSS Feed
- Mark Topic as New
- Mark Topic as Read
- Float this Topic for Current User
- Bookmark
- Subscribe
- Mute
- Printer Friendly Page
- Mark as New
- Bookmark
- Subscribe
- Mute
- Subscribe to RSS Feed
- Permalink
- Report Inappropriate Content
How to list the data that match the user selection, Then use the list as a Chart dimensions
Hi
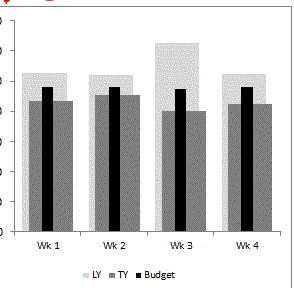
I am trying to create a Chart, That will show the This year(TY) , Last Year(LY), and This Year Budget for the each weeks that allocated in the user select week' Month.
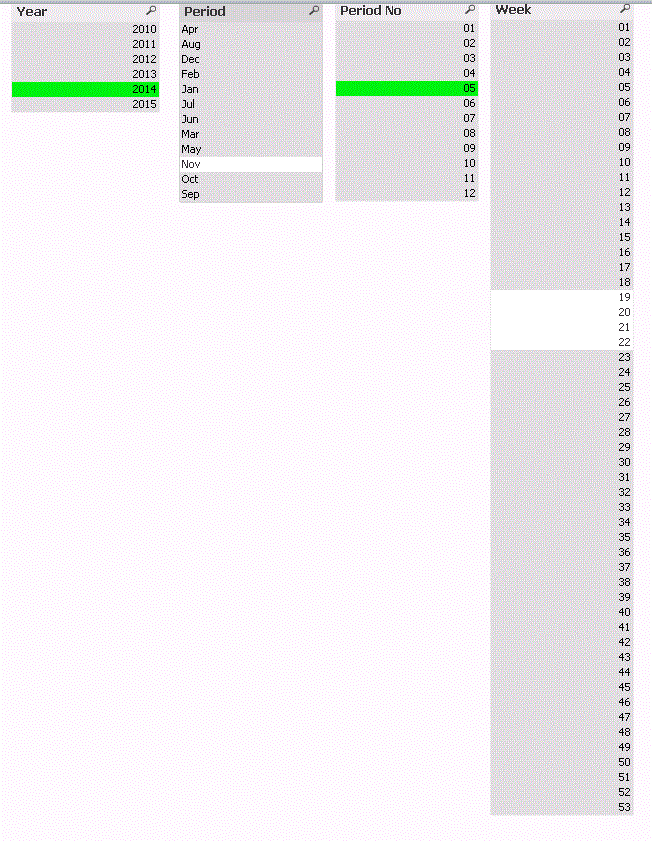
For example, in dim_calendar, there are 53 weeks and 12 month in a year. Some month has 4 weeks some month has 5 weeks.
If user select weeks 22. this week belongs to month 05. and in this month there are 4 weeks, which are week 19,20,21,22.
So the user want to see TY sales, LY sales and This Year Budget for these 4 weeks each.


the WK1=weeks 19, WK2=weeks20, WK3=weeks 21, WK4=weeks22.
So, how to build the chart dimensions that can list the weeks based on the user selection?
Thanks a lot