Unlock a world of possibilities! Login now and discover the exclusive benefits awaiting you.
- Qlik Community
- :
- All Forums
- :
- QlikView App Dev
- :
- Represent images instead of bars in bar chart
- Subscribe to RSS Feed
- Mark Topic as New
- Mark Topic as Read
- Float this Topic for Current User
- Bookmark
- Subscribe
- Mute
- Printer Friendly Page
- Mark as New
- Bookmark
- Subscribe
- Mute
- Subscribe to RSS Feed
- Permalink
- Report Inappropriate Content
Represent images instead of bars in bar chart
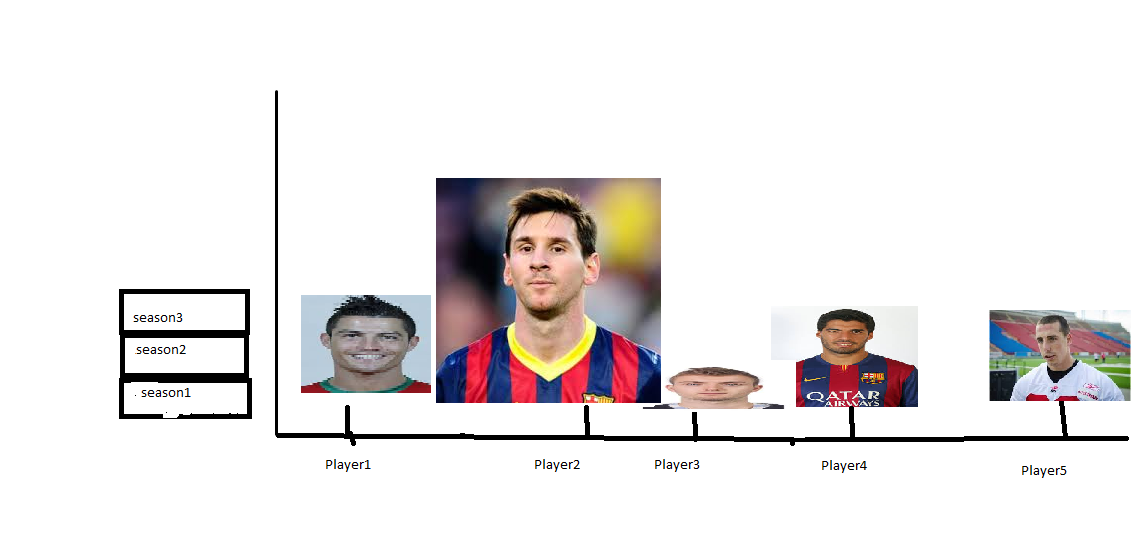
Suppose I have 5 football players.The number of goals scored by each player is represented with enlarged or shrunken image of the player by comparing with goals scored by other individuals. The scores are taken for 3 seasons.
The scenario is If I click on season1, the player with highest number of goals is to be represented with large image followed by second highest scorer with relatively small image, and finally the least goal scorer is represented with smallest image amongst all.
This needs to be done for all the seasons.
Can somebody please help me in implementing this on a bar chart in QlikView.
Thanks in advance.
- Mark as New
- Bookmark
- Subscribe
- Mute
- Subscribe to RSS Feed
- Permalink
- Report Inappropriate Content
Can you upload a Mock up visual of how you want this "Bar chart" to look like?
I assume each of these players have a numeric value to be used as measure?
There are a number of demos that do these profile pages that may fuel some ideas.
- Mark as New
- Bookmark
- Subscribe
- Mute
- Subscribe to RSS Feed
- Permalink
- Report Inappropriate Content
I doubt if this can be achieved in a QlikView bar chart, without an extension.
Since your number of players is fixed, you could implement the same in 5 text objects. For each text object, you could calculate the First, the Second, etc... player, and the size of the 5 text objects could be pre-defined, always showing the top player in the largest box and the bottom player - in the smallest box.
cheers,
Oleg Troyansky
- Mark as New
- Bookmark
- Subscribe
- Mute
- Subscribe to RSS Feed
- Permalink
- Report Inappropriate Content
If you still want this in a chart, you could make a Straight Table and have an IF statement that pulls some conditions and then the result is a image. Make sure to select the Representation as "Image"
- Mark as New
- Bookmark
- Subscribe
- Mute
- Subscribe to RSS Feed
- Permalink
- Report Inappropriate Content

Thanks for your replies.
The number of goals scored by each person is given but that is to be represented in terms of player's image size.
My application should look like this and it needs to be implemented in Bar chart only.
- Mark as New
- Bookmark
- Subscribe
- Mute
- Subscribe to RSS Feed
- Permalink
- Report Inappropriate Content
In this example you have a table, each row grouped by scorer.
You need a pic for each scorer in different sizes from Scorer1.png (the biggest) to ScorerN.png (the smallest).
One column in the table is a expression type image (No strech) with a path like Scorer & FileNo() & '.png'
Then the size of the image will change up on the order of the table.
- Mark as New
- Bookmark
- Subscribe
- Mute
- Subscribe to RSS Feed
- Permalink
- Report Inappropriate Content
In this case, you are looking at developing an extension. QlikView bar charts do not support pictures on bars (we all wish they did...)
- Mark as New
- Bookmark
- Subscribe
- Mute
- Subscribe to RSS Feed
- Permalink
- Report Inappropriate Content
Thanks Fernando.
But Could you please suggest the way that the images automatically enlarge/shrink depending on scores instead of taking images of all sizes manually. The scenario is only one image is available for each player.
So basically I think of comparative analysis for this operation. Further implemented on bar chart.
Can I have any inputs/suggestions on this.