- Mark as New
- Bookmark
- Subscribe
- Mute
- Subscribe to RSS Feed
- Permalink
- Report Inappropriate Content
Sum of Sales where ID is DISTINCT
Hello,
I have the following table:
ID,Sales
1, 200
1, 200
2, 200
3, 200
In the above table how would I get the sum of Y where ID is DISTINCT?
Thanks!
-Jason
Accepted Solutions
- Mark as New
- Bookmark
- Subscribe
- Mute
- Subscribe to RSS Feed
- Permalink
- Report Inappropriate Content
Massimo, thanks for the prompt response! I should have stated that the table goes on much longer and contains multiple records with the same ID... I figured out how to do it via browsing more posts using the AGGR function:
sum(aggr(sum(DISTINCT [Sales]), [ID]))
-Jason
- Mark as New
- Bookmark
- Subscribe
- Mute
- Subscribe to RSS Feed
- Permalink
- Report Inappropriate Content
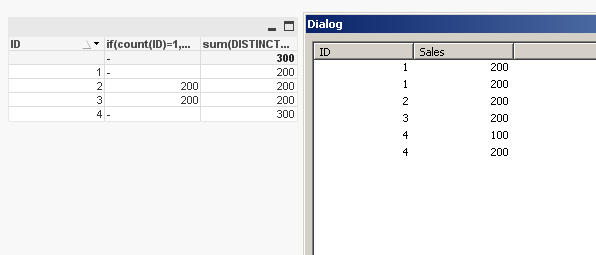
do you want to exclude 1 (no distinct)?
if(count(ID)=1, sum(Sales))
or sum the sales of 1 only once?
sum(DISTINCT Sales)

- Mark as New
- Bookmark
- Subscribe
- Mute
- Subscribe to RSS Feed
- Permalink
- Report Inappropriate Content
Massimo, thanks for the prompt response! I should have stated that the table goes on much longer and contains multiple records with the same ID... I figured out how to do it via browsing more posts using the AGGR function:
sum(aggr(sum(DISTINCT [Sales]), [ID]))
-Jason
- Mark as New
- Bookmark
- Subscribe
- Mute
- Subscribe to RSS Feed
- Permalink
- Report Inappropriate Content
Si estás creando un objeto de tipo gráfico es sencillo:
1. El id lo adicionas a una dimensión

2. Creas una expresión así:

3. Resultado:
 @
@
- Mark as New
- Bookmark
- Subscribe
- Mute
- Subscribe to RSS Feed
- Permalink
- Report Inappropriate Content
yes...that expression is correct....here aggr() works like a group by clause in SQL,,,so aggr(sum(DISTINCT sales),ID)
here ID wise sum(sales) displayed in chart
- Mark as New
- Bookmark
- Subscribe
- Mute
- Subscribe to RSS Feed
- Permalink
- Report Inappropriate Content
Data:
| Document Number | Amount | Month | Week |
| 1 | 10 | Jan | 1/5/2018 |
| 2 | 20 | Jan | 1/5/2018 |
| 3 | 30 | Jan | 1/12/2018 |
| 4 | 40 | Jan | 1/12/2018 |
| 1 | 10 | Feb | 2/2/2018 |
| 3 | 30 | Feb | 2/2/2018 |
| 3 | 30 | Feb | 2/9/2018 |
| 5 | 50 | Feb | 2/9/2018 |
| 6 | 30 | Feb | 2/9/2018 |
I tried to Calculate the sum of amount for distnct Document Nember group by Month week individually
the expression works fine
( =Sum(Aggr(Sum(distinct Amount),[Document Number],Month)) )
| Month | Amount |
| Jan | 100 |
| Feb | 120 |
=Sum(Aggr(Sum(distinct Amount),[Document Number],Week))
| Week | Amount |
| 1/5/2018 | 30 |
| 1/12/2018 | 70 |
| 2/2/2018 | 40 |
| 2/9/2018 | 110 |
but if i tried for both(Month & Week ) together in pivot table the expression is not working good
=Sum(Aggr(Sum(distinct Amount),[Document Number],Month,Week))
| Month | Week | Amount |
| Feb | Totals | 150 |
| 2/2/2018 | 40 | |
| 2/9/2018 | 110 | |
| Jan | Totals | 100 |
| 1/5/2018 | 30 | |
| 1/12/2018 | 70 |
Will you please let me know how to find sum of sales for distinct field group by multiple fields
- Mark as New
- Bookmark
- Subscribe
- Mute
- Subscribe to RSS Feed
- Permalink
- Report Inappropriate Content
And don't create Dump https://community.qlik.com/t5/Qlik-Sense-Cloud-Discussions/Sum-of-Sales-for-distinct-Document-number...
- Mark as New
- Bookmark
- Subscribe
- Mute
- Subscribe to RSS Feed
- Permalink
- Report Inappropriate Content
Brilliant! Exactly what I was looking for. My respect to anyone who uses aggr like this! 🙂