Unlock a world of possibilities! Login now and discover the exclusive benefits awaiting you.
Analytics & AI
Forums for Qlik Analytic solutions. Ask questions, join discussions, find solutions, and access documentation and resources.
Data Integration & Quality
Forums for Qlik Data Integration solutions. Ask questions, join discussions, find solutions, and access documentation and resources
Explore Qlik Gallery
Qlik Gallery is meant to encourage Qlikkies everywhere to share their progress – from a first Qlik app – to a favorite Qlik app – and everything in-between.
Qlik Community
Get started on Qlik Community, find How-To documents, and join general non-product related discussions.
Qlik Resources
Direct links to other resources within the Qlik ecosystem. We suggest you bookmark this page.
Qlik Academic Program
Qlik gives qualified university students, educators, and researchers free Qlik software and resources to prepare students for the data-driven workplace.
Recent Blog Posts
-
Qlik GeoAnalytics: Gaining new insight into your location-based data
Late last year, a major highway in the Boston area changed to be completely electronic. Gone are the toll booth plazas and people. They’ve been repl... Show More Late last year, a major highway in the Boston area changed to be completely electronic. Gone are the toll booth plazas and people. They’ve been replaced by overhead gantries at various points along the highway that read vehicle transponders as they pass underneath. Don’t have a transponder? A camera takes a picture of your license plate and sends you the bill.
The result is a deluge of data on the 100,000+ vehicles that use the highway every day. You can now go online and see that Thursdays and Fridays are the busiest days of the week and very few people go over 75 mph. (they say they won’t use this data to issue speeding tickets. We’ll see…..).
I think this situation is typical of many organizations who are suddenly finding themselves with an abundance of geo-spatial data. But is the highway department taking full advantage of this location-based content? Are they able to not just visualize this data, but fully understand it and how it relates to other information? For example, is there a relationship between traffic volumes and rest stop usage? What effect, if any, does different weather conditions have on traffic speed? Or have their marketing campaigns had an impact on transponder usage in different parts of the state?
Enter Qlik GeoAnalytics. Just like QlikView and Qlik Sense has allowed tens of thousands of organizations to not only visualize their data but better understand it in ways they never thought possible, Qlik GeoAnalytics gives you the same power with your location-related data.
READ MORE: 2017 Dresner Report: Qik Rated #1 for Location Intelligence Capabilities
Qlik GeoAnalytics has already been used by customers in many different situations – determining the best location for a new store based on existing client information, population data and driving distances. Analyzing weather-related insurance claims vs. actual weather data to determine possible cases of fraud. Understanding foot traffic within a store by taking real-time customer tracking data (via cell phone Wi-Fi signals) and overlaying it on an image of the floor plan. There are many different industries and business functions that can take advantage of Qlik GeoAnalytics.
Interested in finding out more? Check out these demos, videos and tutorials. And be careful how fast you drive on the highway because someone may be watching you….
READ MORE: Data Visualization Foundations: Mapping Point Data | Qlik
What’s Cooking @ Qlik
This information and Qlik‘s strategy and possible future developments are subject to change and may be changed by Qlik at any time for any reason without notice. This information is provided without a warranty of any kind. The information contained here may not be copied, distributed, or otherwise shared with any third party.
Qlik GeoAnalytics joined the Qlik product portfolio just a few short months ago through the acquisition of one of our partners, Idevio. We will certainly see more from Qlik GeoAnalytics over the coming year but it is bit too early to share any specifics here. However, we are all very excited to have them as part of the family and look forward to a great year!
READ MORE: Press Release announcing Idevio acquisition

-
Leave Data Where It Is
The Big Data ‘hype’ may have died down at this point but for many of our customers big data is still a really big deal. Today, companies have a wide ... Show MoreThe Big Data ‘hype’ may have died down at this point but for many of our customers big data is still a really big deal. Today, companies have a wide range of tools at their disposal for managing and processing big data but one aspect of working with big data remains a concern – that is how to make big data accessible, relevant, and interactive to every business user. Most big data systems are great for processing big data in batch jobs or for supporting the quantitative elite but are just too slow to query in real time and work with interactively. It is true that in some cases, this pain can be reduced but at great financial cost making it difficult to deliver the full potential of your big data investments across the entire business.
Qlik On-Demand App Generation to the rescue!
Over the past few years, Qlik has worked closely with some of our largest customers to develop techniques that provide an interactive user experience from Big Data so that every user can benefit from these investments. And, the best part, this technique works just as well on Qlik Sense as it does on QlikVIew.
As a simple example, imagine a telco company that has data from every touch point between every cell-phone and every cell-tower. (That’s big data!) A customer calls the telco call-center asking for help with a connectivity issue on their phone that they experienced last Tuesday. The phone rep doesn’t really need ALL of the data in the big data store to do that analysis but they do need to be able to work interactively with the data that is relevant to the caller in real time so that they can help them.
On-Demand App Generation (ODAG) provides the ability for a user to first select a subset of data that they are interested in from a Big Data lake and then generates a detailed app with the relevant data for the user to explore interactively.
In our example, the phone rep might select the caller’s phone number and all of the cell towers within a wide radius around the area where the caller was traveling last Tuesday. Qlik On-Demand App Generation will then spawn a customized instance of the analysis app with just the data that is needed to help this customer. Since the customized version of the analysis app is now in-memory, Qlik is able to deliver a tailor made highly interactive experience. Why is this important? Because this allows the phone-rep to work with that customer in real-time solving their problem and improving customer service.
We will share more specifics about how to work with On Demand App Generation in both Qlik Sense and QlikView in the future. Stay Tuned!
Qlik On-Demand App Generation was actually introduced last June after working with a number of large customers to develop the technique. Over the past year we have worked to provide more a more integrated solution which is what you will be seeing this June.
What’s Cooking @ Qlik
This information and Qlik‘s strategy and possible future developments are subject to change and may be changed by Qlik at any time for any reason without notice. This information is provided without a warranty of any kind. The information contained here may not be copied, distributed, or otherwise shared with any third party.
ODAG is an incredible tool to have in your Big Data toolbox but there is still room for improvement. In the future, our goal is to take this a step further delivering the best of both worlds – a direct connection back to a ‘live’ big data store and a highly interactive user experience that delivers the Associative Experience.
With On-Demand App Generation, we solve the performance concerns of working with Big Data but in order to request a different ‘slice’ of the data, users need to move back to the selection app and start over. And, of course, working on the entire data lake is not possible using this model.
At Qonnections recently we were able to get a preview of just how this is expected to work in the future.
In addition to continuing to offer the On-Demand App Generation approach to Big Data, Qlik is working toward a solution currently referred to as Associative Big Data Indexing. Imagine a future with the full associative experience on top of a big data lake without moving the data. This model involves a parallel array of indexing engines optimized for Qlik style associative queries and speed.
Here is what that might look like in the future...
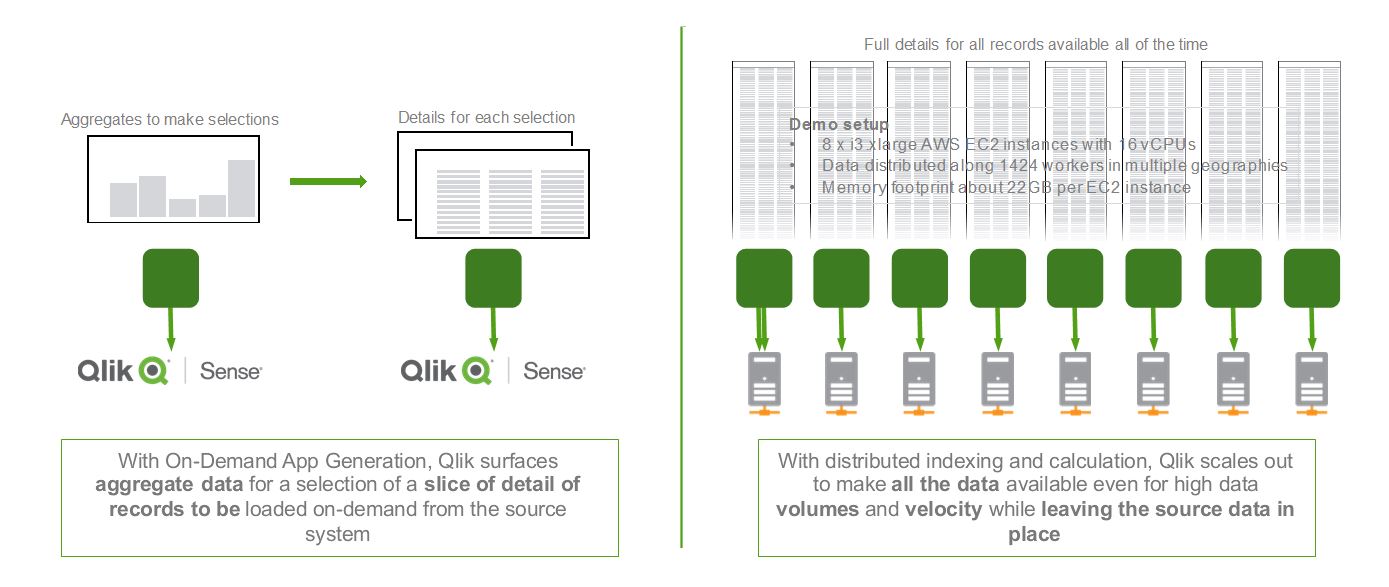
Data can remain located in the cloud, on premises, or even a combination. And, the Associative Big Data Index can be reused across multiple apps so everyone across the organization can gain the benefits and insights in your big data investments. We look forward to sharing more about On Demand App Generation and Associative Big Data Indexing in the future.
-
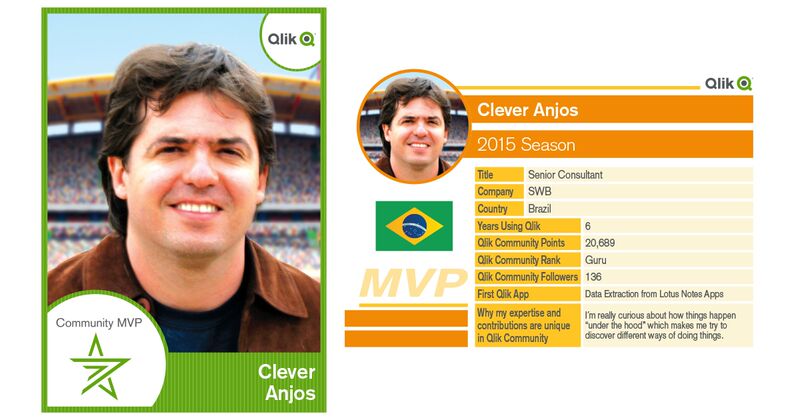
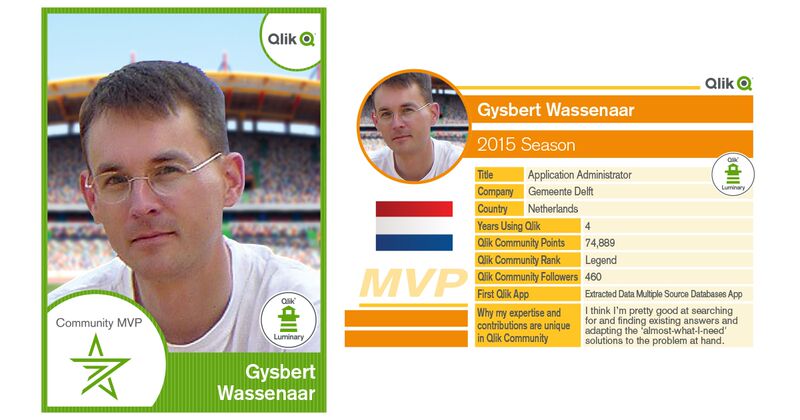
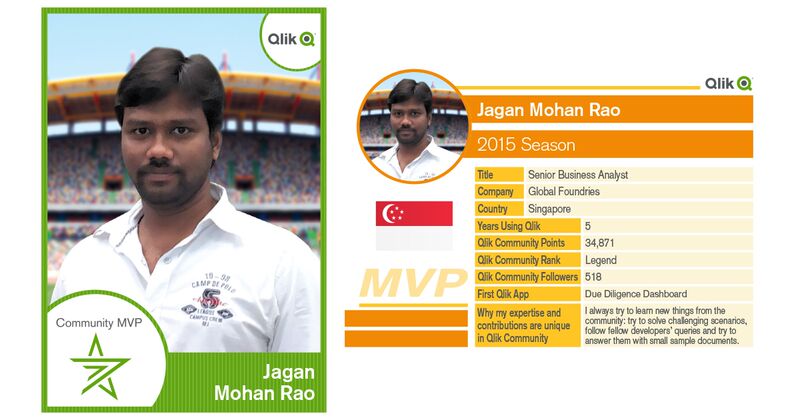
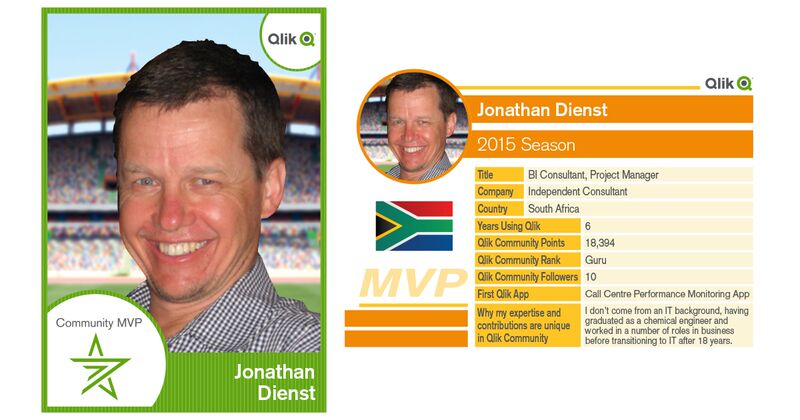
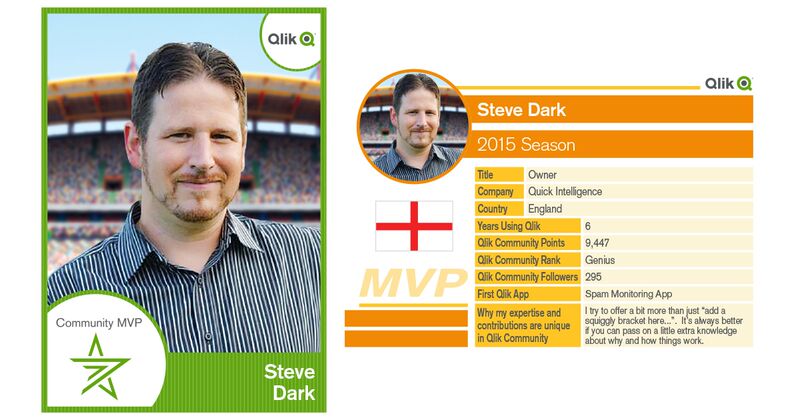
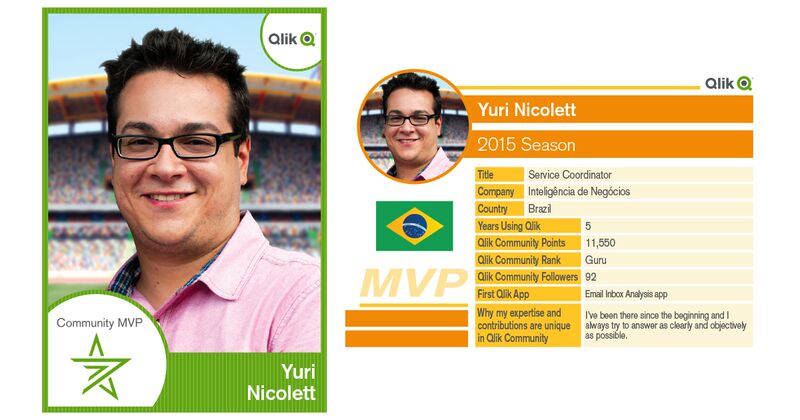
Learn more about our Qlik Community MVP Members
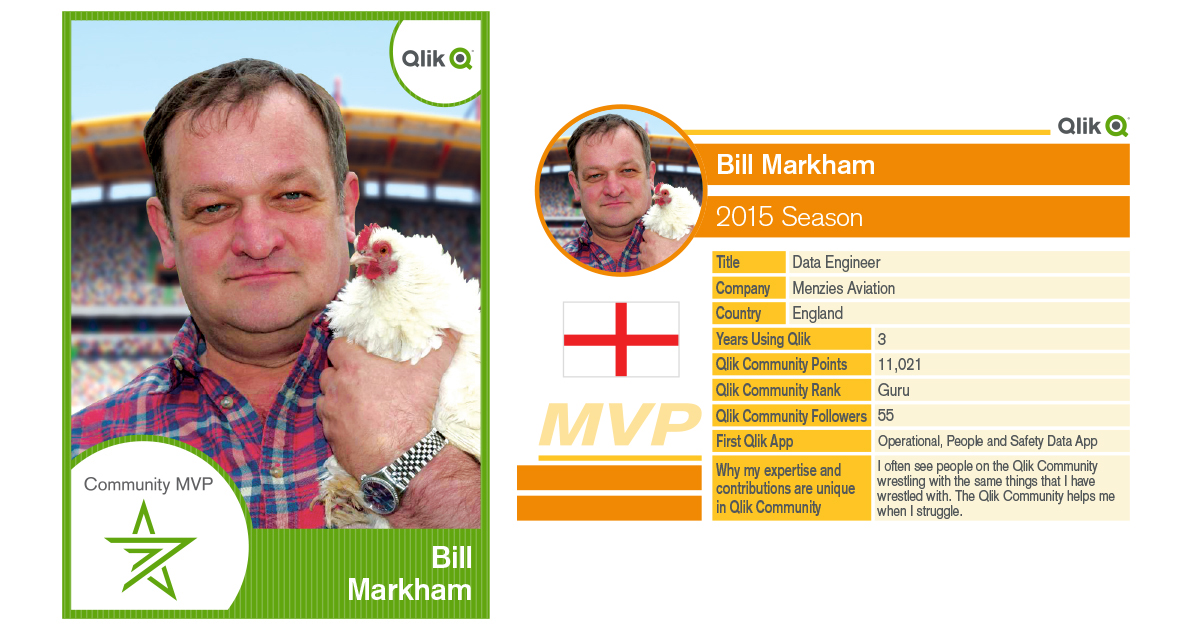
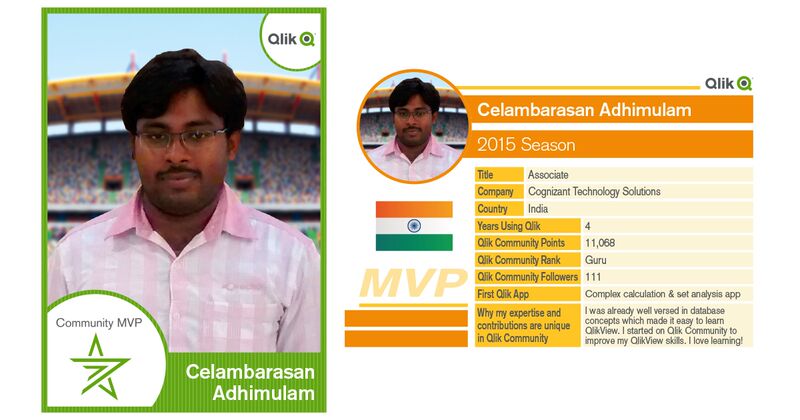
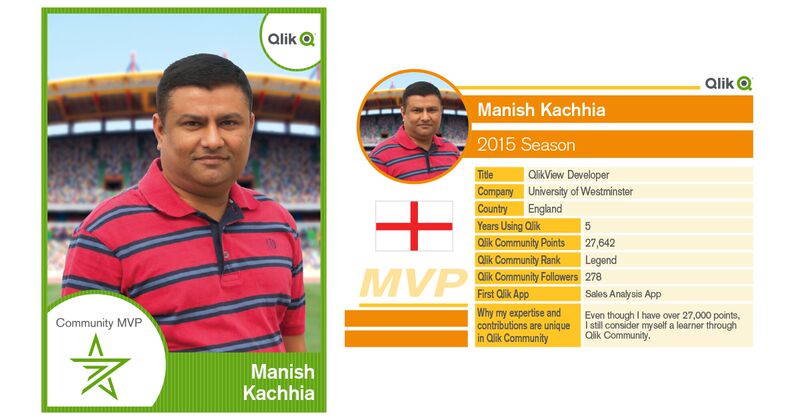
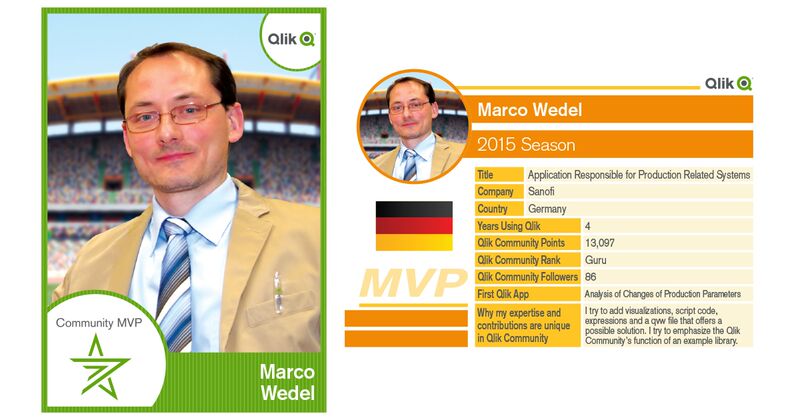
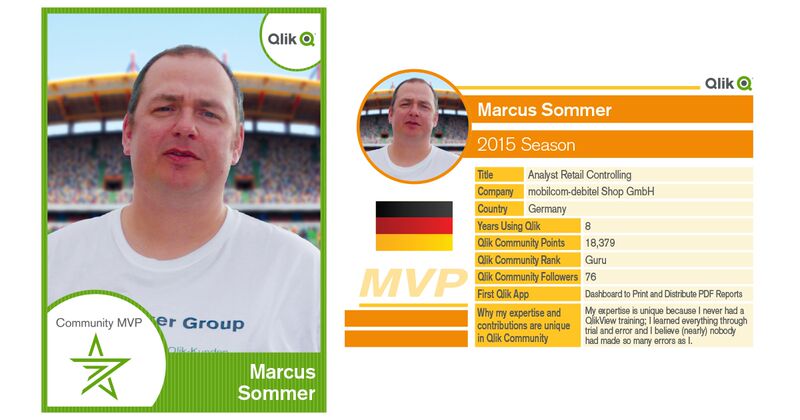
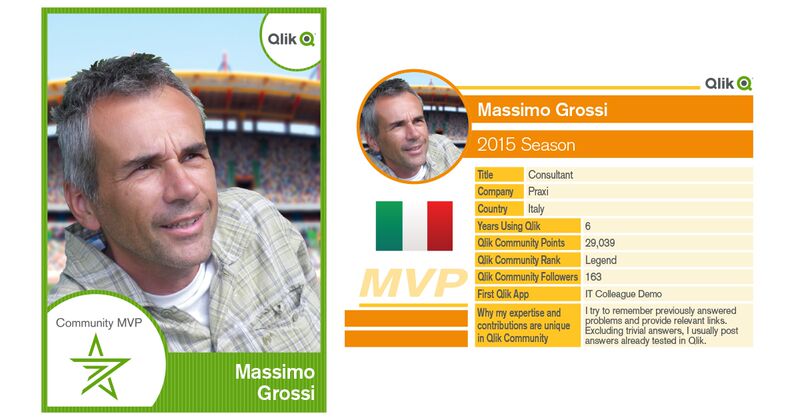
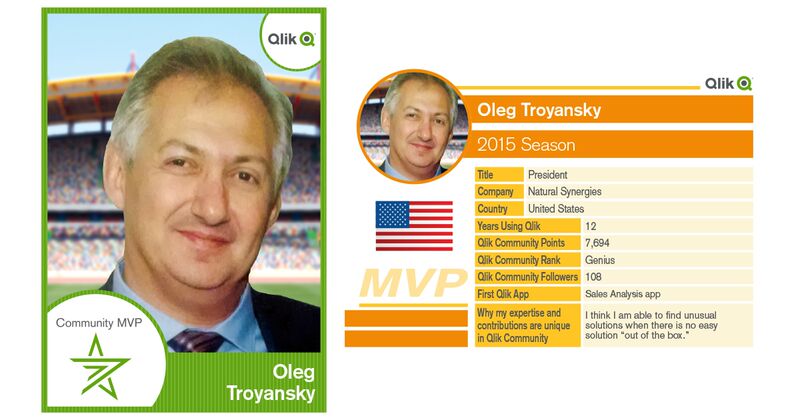
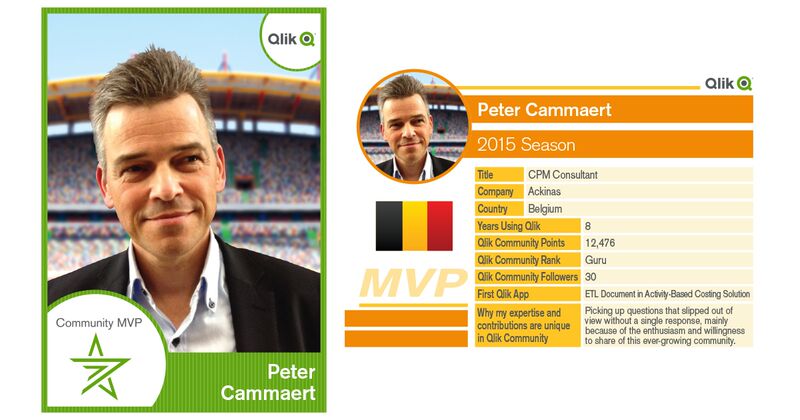
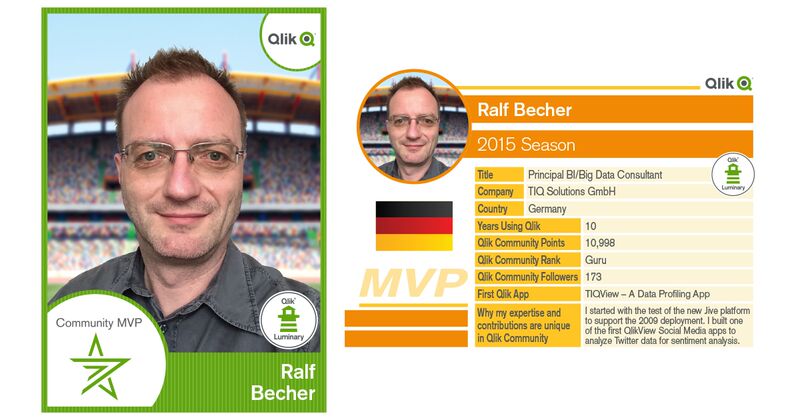
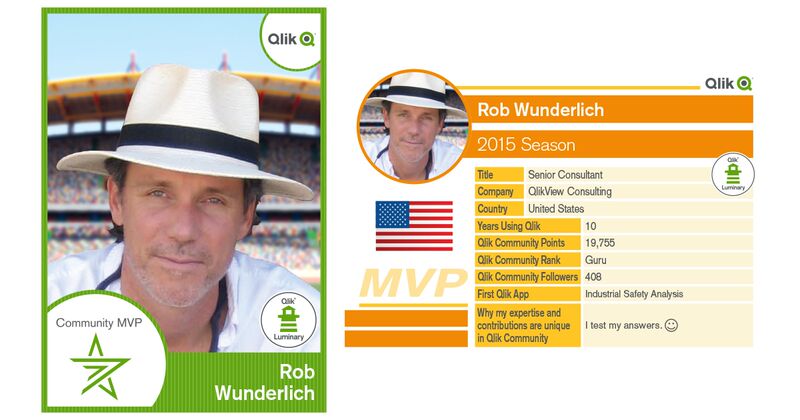
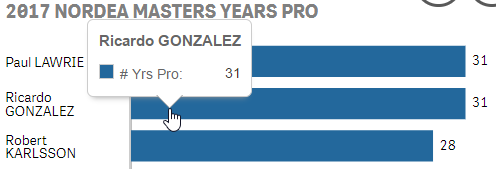
Last week we posted an announcement regarding the recently launched Qlik Community MVP program on the Qlik Blog titled: Recognizing Qlik Communities M... Show MoreLast week we posted an announcement regarding the recently launched Qlik Community MVP program on the Qlik Blog titled: Recognizing Qlik Communities Most Valued Participants. We thought it would be nice to share more details about each of our MVP members such as their first Qlik app, years working with Qlik products, country of residence and perspective on collaboration in Qlik Community.
We hope you enjoy their sports inspired Qlik MVP Member Trading Cards and links to their profiles. For those of you who are new to Qlik Community- following MVP members updates in your content feeds is a great way to see some of the communities most current discussions and content. You might also have a sense of camaraderie with those who reside in the same country as you.
Cheers!
-
From BI to AI
In the last of our three part follow-up to Qonnections, we explore the movement in the industry from BI to AI.Business Intelligence (BI) has a long tr... Show MoreIn the last of our three part follow-up to Qonnections, we explore the movement in the industry from BI to AI.
Business Intelligence (BI) has a long tradition of relying on an army of people to define, build, and maintain both quantitative and visual views into data. This army of BI experts have done (and still do) some truly amazing work but at the same time - reliance on this team can often lead to a bottle-neck slowing analytic progress. In the past few years, analysis tools have become much easier to use, of course. And, as with Qlik Sense, this opens the analytic door to a much broader range of business users.
However, business users vary greatly in their level of understanding of statistical functions and visualization methods. So, despite solving the problem of accessibility, today's results can still sometimes be mixed. Some people strongly believe that the way to solve this problem lies in a shift from BI to AI or Artificial Intelligence. In this vision of the future, the machine takes center stage and drives the path to insight. IBM Watson's success on the game show Jeopardy is an often cited example of what AI looks like: a machine standing on its own leading the way against the inferior human mind.
That is not our vision at all! At Qlik, we believe that the human mind is an incredible resource and that AI can stand for something else.....something centered on the human, not the machine.... forget Artificial Intelligence our focus is Augmented Intelligence. This isn't really a new idea. Steve Jobs understood this when he said "the computer is the most remarkable tool that we've ever come up with. It's the equivalent of a bicycle for our minds." Like a bicycle's ability to multiply a human's locomotion ability, Augmented Intelligence has the ability to super power the human intuition, visual perception, and deduction.
Here is another way to think about it for those of you that are Star Trek fans. One of the many reasons that Star Trek was such a great show was because ...although the human was still Captain, he greatly benefited from the inclusion of the purely logical Spock.
 Spock helped to mitigate some of the well known issues of human intuition such as bias, emotion, and poor memory. So will Augmented Intelligence. Instead of running the ship, like Artificial Intelligence might aspire to do, Augmented Intelligence guides and informs - enhancing the ability of the Captain (you) to boldly go where no man has before.
By NBC Television - eBayfrontback, Public Domain, https://commons.wikimedia.org/w/index.php?curid=29921556
What’s Cooking @ Qlik
This information and Qlik‘s strategy and possible future developments are subject to change and may be changed by Qlik at any time for any reason without notice. This information is provided without a warranty of any kind. The information contained here may not be copied, distributed, or otherwise shared with any third party.
The idea of Augmented Intelligence will play out in many ways. Today, you can already see this taking shape in Qlik Sense through Visual Data Prep as well as through our ability to tie into Advanced Analytics such as R and Python through Server Side Extensions. Going forward you will likely see additional integration such as an 'Insights Board' where Qlik Sense is expected to recommend visualizations and insights based on the data model auto-magically. And a little more In the future, we are expecting to see the inclusion of the Qlik Cognitive Rules Engine which will provide even further support for Augmented Intelligence.
Stay tuned.... now where did I put my tricorder?
-
Horizontal Bar Chart Extension
Last year I blogged about our Mobile Friendly Horizontal Bar Chart that we use in most of our mashups in the Qlik Demo Team.Since then, many things h... Show MoreLast year I blogged about our Mobile Friendly Horizontal Bar Chart that we use in most of our mashups in the Qlik Demo Team.
Since then, many things have changed. For a start, if you have a mashup that uses many objects, you will see the load time to be much faster since I used d3.v4 and I have added a break point on how many bars to create, You can define if you want to show all or only the first 50.
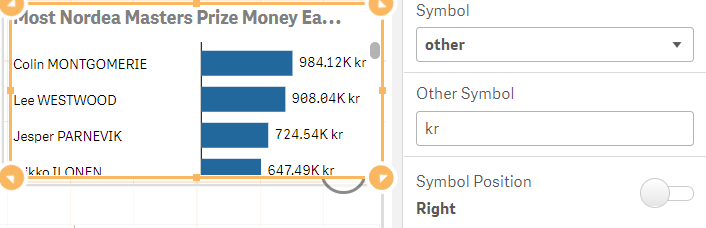
I have also changed the currency. If you select the measure to be displayed as 'auto' then extension will use the custom format. You can abbreviate the measure with their respective symbol like 'B' for billions, 'T' for trillions etc and use your custom currency symbol
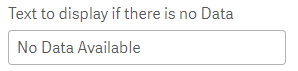
Another new feature is the custom text to display when there is no data. If you make a selection in the sheet and that produces no results then this text will be displayed.
Also, the tooltip is more elegant now and different from the standard Qlik Sense one. I changed it to follow the mouse instead of always aligned center at the top of the bar
YIANNI
Files
-
FileName Function
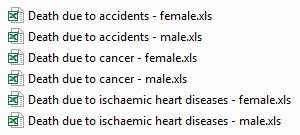
Today I thought I would share how I used a combination of string functions and the FileName function to create data for my app. I loaded several Exce... Show MoreToday I thought I would share how I used a combination of string functions and the FileName function to create data for my app. I loaded several Excel files with one Load script and generated the data I needed for my app using the filename of the files. Below is a subset of the files I was working with. I had a separate Excel file for each cause of death and each gender.
Here is the script I used to load the Excel files:
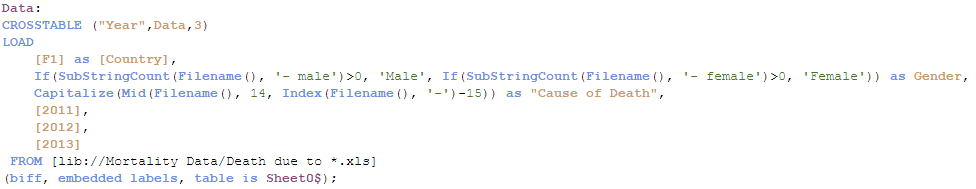
I used a Crosstable Load to load the Excel files. You can learn more about the Crosstable Load in Henric Cronström’s blog. The Excel files include the country, the year and the number of people who died from the specified cause of death. In my app, I also wanted to include gender and cause of death which was not included in the Excel file. To do this, I decided to parse the gender and cause of death from the name of the Excel file. Starting with gender, you can see in the files listed above that each filename ended with male or female. In the script below, the Filename function returned the name of the Excel file including the extension but excluding the path (e.g. Death due to accidents - female.xls). I use the SubStringCount function to determine if the filename included ‘- male’ or ‘- female.’ If it did, the function returned the number of occurrences which in this case would always be 1. If an occurrence of ‘- male’ was found, then ‘Male’ was added to the Gender field. If an occurrence of ‘- female’ was found, then ‘Female’ was added to the Gender field.

The next bit of data I wanted to extract from the filename was the cause of death (see script below). Each cause of death started at the 14th position/character so I used the Mid function to grab the text starting with the 14 character and I used the Index function to find the starting position of the hyphen so I could determine how many characters the Mid function needed to capture. To figure out how many characters the Mid function should grab, I subtracted 15 from the position returned by the Index function (where the hyphen is located). So if we look at the file named Death due to accidents - female.xls, the Mid function would start at the “a” in accidents and would grab 9 characters (the result of 25 – 14). To finish it up, I used the Capitalize function to capitalize the first letter in each word of the cause of death.

Since the files were all named and formatted the same way, I decided to minimize my script and use one Load statement to load all the files. I could do this by using an asterisk (*) in my From clause like this:

This script loaded all xls files in the folder that start with “Death due to “. Of course, I could have opted to load each file individually but why create more script to maintain.
Below is a sampling of the data I ended up with after loading the Excel files. I can see the number of males and females (per 100,000 inhabitants) that died from an accident for each country in 2013.
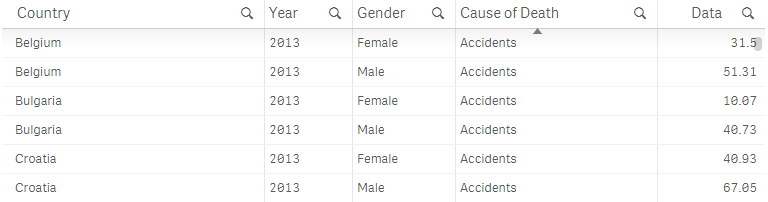
In this blog, I reviewed a few helpful tips and functions that can be used in your script. To recap, I used the FileName function to get the name of the file that I loaded and several string functions including SubStringCount, Mid, Index and Capitalize to generate the data for two new fields: Gender and Cause of Death. I also discussed using the asterisk (*) in a single Load statement when loading multiple files that are named and formatted the same way. This approach saved me time because it provided an easy way to create the data for the Gender and Cause of Death fields and there was less script to prepare. Hopefully, you can make use of these functions in your app.
You can learn more about some of the string functions mentioned in this blog here.
Thanks,
Jennell
-
A True Hybrid Cloud Platform
Where are we today?Since the launch of Qlik Sense Cloud in 2014 we have seen rapid growth in our cloud community, which now includes over 100,000 user... Show MoreWhere are we today?
Since the launch of Qlik Sense Cloud in 2014 we have seen rapid growth in our cloud community, which now includes over 100,000 users worldwide. We continue to expand and improve our offerings and today we offer multiple different subscription levels: Qlik Sense in 60 - Introducing Qlik Sense Cloud Business - YouTube
- Qlik Sense Cloud Basic: Basic app creation and sharing for individuals; a great way to get started with Qlik Sense for free. Individual users can upgrade to Qlik Sense Cloud Plus for unlimited sharing and to accommodate more data storage and larger app sizes.
- Qlik Sense Cloud Business: Group-level governance, a collaborative work space, data connectivity, and scheduled data refreshes supporting groups, teams and small businesses.
Sign up for Cloud Basic for FREE
You can even sign up in-product for a free 14-day trial of Qlik Sense Cloud Business.
What’s New?
Qlik Sense Cloud is built to be cloud native using microservices architecture, and our cloud development team follows an agile development methodology. What this means to you is that our software is constantly updated with the newest features and UI enhancements automatically - you never have to worry about manual upgrades.
Recently we’ve focused on adding more data connectivity options in Qlik Sense Cloud Business. These options help users get more value out of Qlik’s associative engine by bringing multiple data sources together and uncovering insights across them.
Cloud Business connectivity options available now (or coming in June) include:- Salesforce
- Web Connectors: Facebook Fan Pages and Groups, Twitter, and Google Analytics (blog)
- REST Connector
- Additional connectivity to ODBC to SQL Server and Webfiles
What’s Cooking @ Qlik
This information and Qlik‘s strategy and possible future developments are subject to change and may be changed by Qlik at any time for any reason without notice. This information is provided without a warranty of any kind. The information contained here may not be copied, distributed, or otherwise shared with any third party.
Last week at Qonnections, we were able to get a sneak-peek into the future direction of Qlik’s Cloud Strategy - A True Hybrid Cloud Platform.
The reality is that we have reached the tipping point with just about as many companies choosing to deploy BI in the cloud as on-premises. But, with a true Hybrid Cloud Analytics Platform, customers will not have to choose between either on-premises or cloud deployments. They can use both together – seamlessly – and flexibly shift workloads to the cloud over time as their cloud strategies mature.
Don’t Be Fooled by Poor Imitations
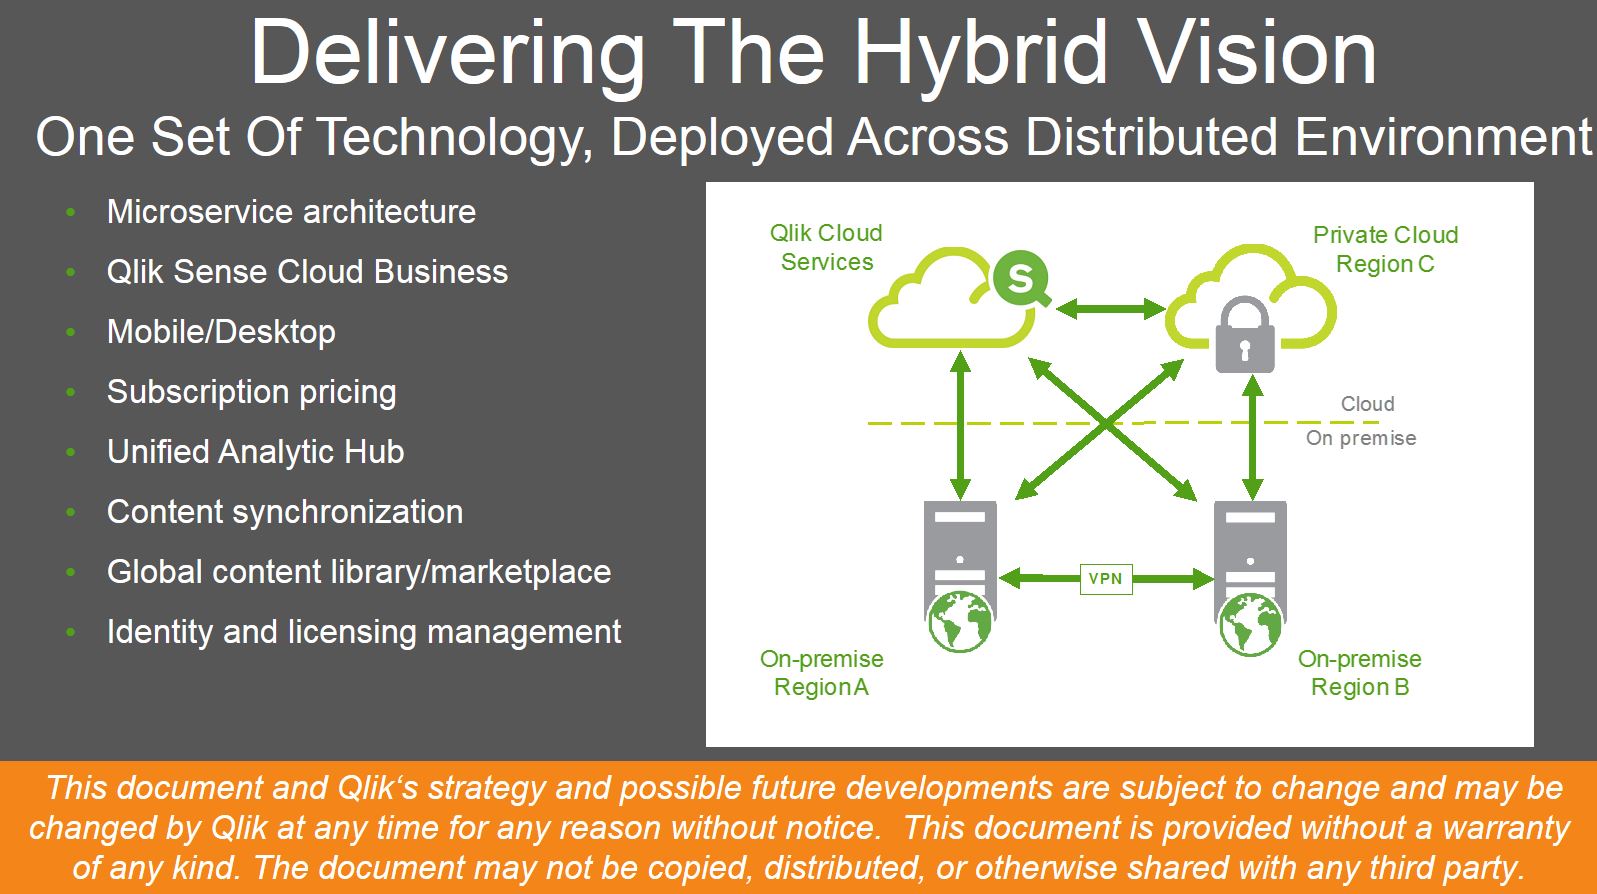
So, the big idea here is that On-Premises OR Cloud shouldn’t have to be a question....just like users shouldn’t have to choose a different experience at their desktop or on a mobile device – or online or off-line for that matter. BI Solutions shouldn’t drive your technology strategy. They should support it. And, to be truly effective, BI needs to exist at the point of decision – anywhere.
-
Qlik Platform Analytics - The Demo
First - a bit on QonnectionsLast week was my 6th Qlik Qonnections, our annual partner and user conference. As usual it was a tremendous event filled w... Show More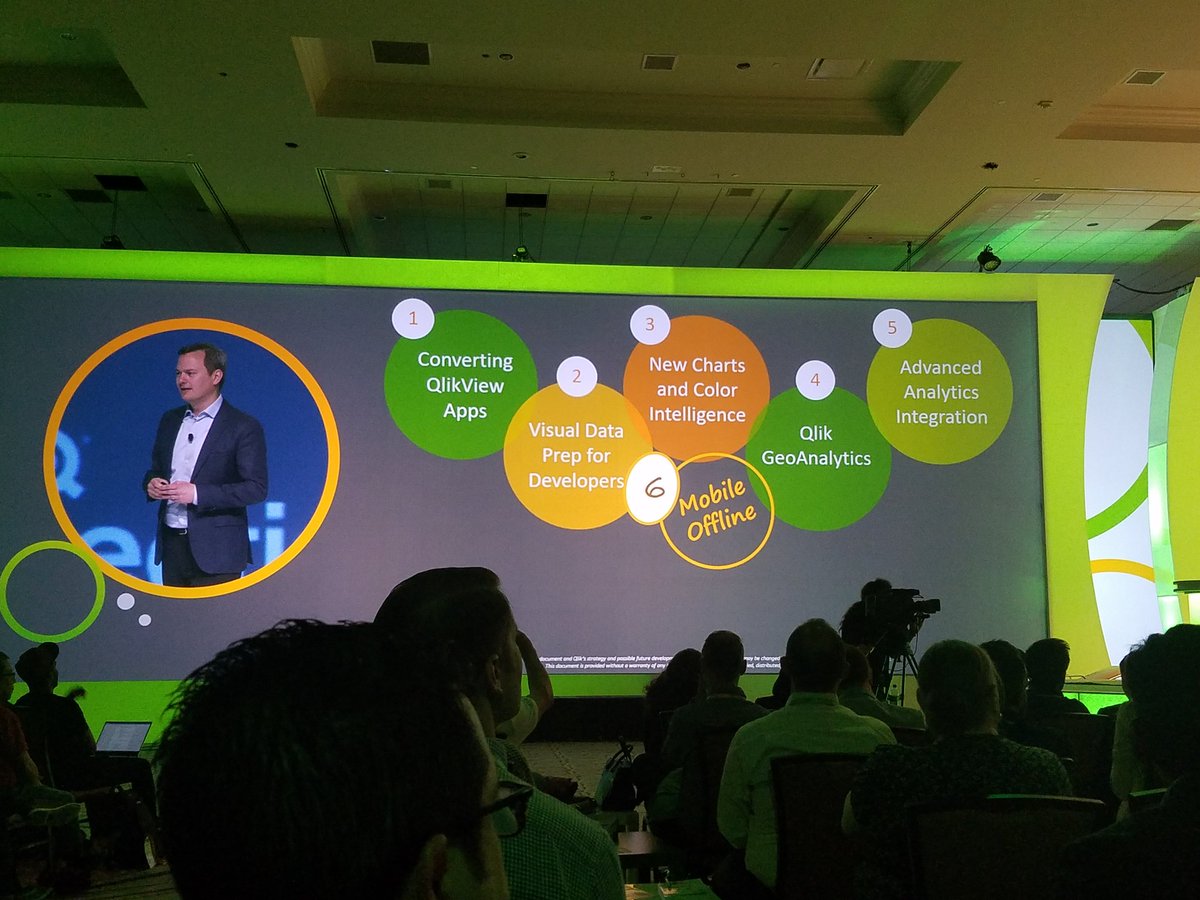
First - a bit on Qonnections
Last week was my 6th Qlik Qonnections, our annual partner and user conference. As usual it was a tremendous event filled with learning, networking and of course "fun and games"...literally this time around for those whom attended. What was in the past, a partner only event, has grown to include our valued customers for its 2nd year. Our customers, partners and analysts from all over the world came to one awesome place (Gaylord Palms in Kissimmee Florida - my home town!) to share, collaborate, communicate and witness all the great innovation each had to offer...of course including a few things from Qlik. In my humble opinion, each year Qonnections has increased in quality and content....and this one felt like the best one yet, credit goes to our amazing events team, our sponsors and of course our customers and partners! If you want to learn more about all the happenings at Qonnections 2017, I suggest you check our company blog for the daily recaps as well as Cindi Howson's latest blog on the Gartner Blog Network: Qlik Reveals More Roadmap and Vision.The Qlik Analytics Platform Demo
While at Qonnections, along with my colleague Josh Good, we had the pleasure of presenting a session that in short, basically highlights everything available in the Qlik Analytics Platform. Qlik has so much growing goodness in one box, that it's becoming almost impossible to cover everything we can do for an organization's various needs in just one meeting. So this presentation was created to quickly show what is possible and is performed using 5 "Acts" that demonstrates our core product capabilities while connecting the full breadth of analytic use cases across a fictitious organization - using one coherent story-line. We originally used this as an internal enablement-type resource, but also realized the value it contains for our customers and partners and decided to publish it.
There are 2 videos in this blog, including links out to detailed specifics on each of the use cases. The first video (3 min) is basically a short summary of the 2nd video - introducing you the main concepts, but sacrifices the detailed demonstration. The 2nd video is a longer (23 min) step by step demo flow that dives in deeper into each analytic use case. I hope you find this information useful and please note I am checking on the public availability of the demonstration app used in the videos. Once approved I will post this as an attachment to this post. I am also looking into making all the resources available on our Partner Portal.
Enjoy!
Michael Tarallo (@mtarallo) | Twitter
QlikQlik Analytics Platform Demo Highlights (short)
Qlik Analytics Platform Demo (long)
For more detailed information on the full range of Qlik Analytical use cases, please view this videos at the following links.
NOTE: To increase resolution or size of the video, select the YouTube logo at the bottom right of the player. You will be brought directly to YouTube where you can increase the resolution and size of the player window. Look for the 'settings' gears icon in the lower right of the player once at YouTube.
NOTE: Can't see the video? Download the .mp4 to play on your machine or mobile device.


-
Loading Images into QlikView
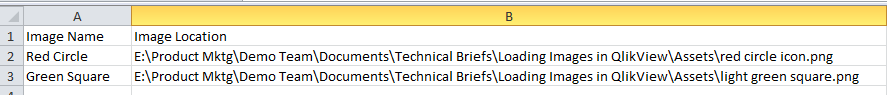
As a QlikView developer I am often asked to load images into QlikView. In some instances the images are associated to other data fields and in other i... Show MoreAs a QlikView developer I am often asked to load images into QlikView. In some instances the images are associated to other data fields and in other instances they are to be loaded in to the application to help convey a message. For example, let’s say that you need to bring in flags of countries that are to display when the corresponding country is selected and you need to display an icon that indicates whether sales for a country are above or below a predefined threshold. It sounds like an easy enough task; so how do you do it?
Well, QlikView offers the developer the Bundle function that can be added to the Load statement. Bundle Load statement allows the developer to load the image files directly into the QlikView application for portability.
The Bundle Process is a very simple scripting process. The syntax for the Bundle Load should look like this:
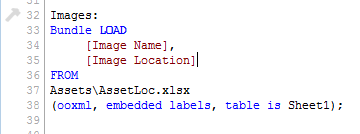
The image file should contain two fields:
- The first field is an identifier such as an index number, image name, a key field that associates the image back to other data files, etc.
- The second field should contain the path to the image.
This file contains the CountryID so that I can associate the flags with the countries
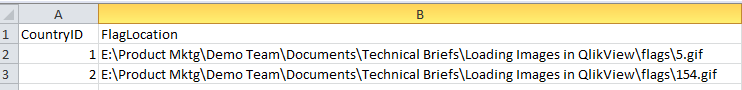
This file contains just an image name because I am just using these icons as a reference and they are not associated to any fields in other files.
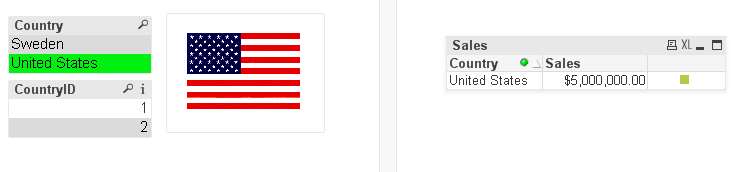
Once the images are loaded into QlikView we can now reference them using the INFO() function and a standard IF Statement:

I am using the INFO() function to display the flags so whenever a Country is Selected, QlikView will know to go grab the corresponding image based on the CountryID. If we needed to, we could do the same thing with the symbols by simply adding a list box for Image Name and selecting an image from there. For this example though, I am using a standard IF Statement to display the symbol for the country sales.
Here is what it looks like when the user selects a country. The Info() function displays the image associated with CountryID =1 and because Sales were above the threshold the green square is displayed.
One note of caution, when images are loaded into a QlikView application using the Bundle Load statement, both the amount of RAM and the size of the application increase so consider both the size and the amount of image files before deciding to use the Bundle LOAD statement.
I wrote a technical brief that outlines these steps in more detail. You can access it here.
Happy Qliking!

-
Qonnections 2017 - It's going to be a great year!
One week ago today we opened our biggest Qonnections conference yet with over 3,200 customers, partners, analysts, press and Qlik team members. Durin... Show MoreOne week ago today we opened our biggest Qonnections conference yet with over 3,200 customers, partners, analysts, press and Qlik team members. During the opening keynote, Rick Jackson, CMO, reinforced a theme that we at Qlik continue to believe is critical to the success of our customers in the changing BI landscape.
People + Data + Ideas = Possibilities
Lars Björk, CEO, shared what we have accomplished since Qonnections 2016 - a year of Qlik Sense® and Qlik® Analytics Platform (QAP) - including going from a public to private company, investing in our innovation, and continuing our commitment to changing the world. It’s this focus that has led to recognition by Fast Company as one of the most innovative companies for social good. (This is a recognition that I am particularly proud of as an employee.)
Finally, Anthony Deighton, CTO, took the stage to share the new product roadmap and demonstrate some of what Qlik is working on over the coming year. We not only got a preview of what is coming in June but also a sneak peak at what is coming beyond as well. During this product presentation, Anthony focused on three key themes.
What’s Cooking @ Qlik
This information and Qlik‘s strategy and possible future developments are subject to change and may be changed by Qlik at any time for any reason without notice. This information is provided without a warranty of any kind. The information contained here may not be copied, distributed, or otherwise shared with any third party.
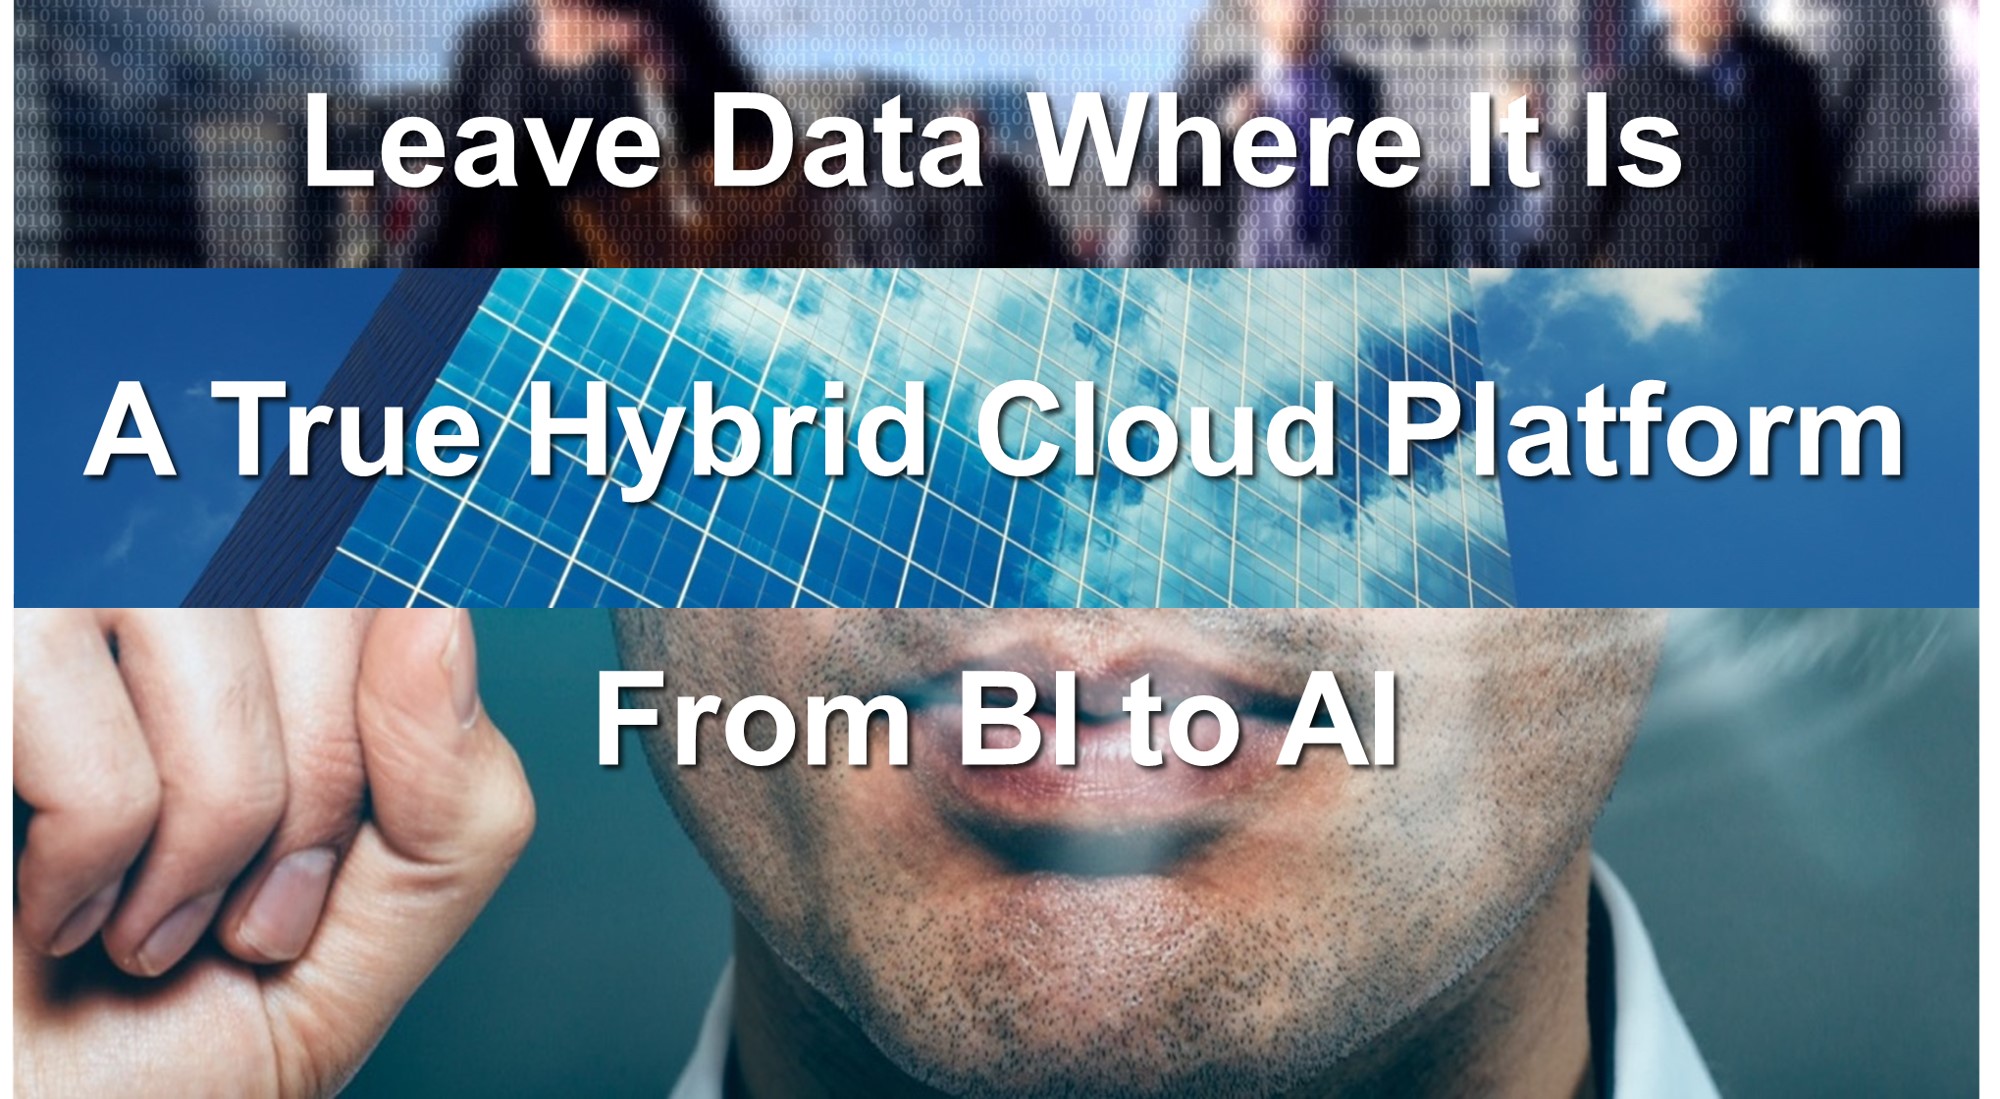
- Leave Data Where It Is
- Qlik has multiple strategies for dealing with Big Data today. However, in many cases Big Data especially in the cloud needs a different strategy...one that doesn't involve moving the data into Qlik's in-memory engine. WHAT IF SOMEDAY.... we could move the engine out to the edges?
- A True Hybrid Cloud Platform
- On-Premises OR Cloud is not the question....Companies rarely choose an all or nothing approach to cloud. So, why should their BI vendor? WHAT IF SOMEDAY you could seamlessly move between on-premises or cloud or both with your apps and/or your data?
- From BI to AI
- BI stands for Business Intelligence, but what does AI stand for?....If you answered "Artificial Intelligence", you would have forgotten our vision - People + Data + Ideas = Possibilities. WHAT IF instead, it meant "Augmented Intelligence".... that is the ability to couple the intelligence of a cognitive rules engine with the experience, intuition, and know-how of your best and brightest.
I can't be certain what next week or next year will hold, but I do know Qlik has people, data, ideas and a lot of possibility. I am already looking forward to next year's Qonnections event!
- Leave Data Where It Is
-
Introducing Qlik Sense Cloud Business & AWS Marketplace
Qlik Sense Cloud BusinessQlik Sense Cloud Basic and Plus have achieved rapid adoption across a large, global network of individual users who create, m... Show MoreQlik Sense Cloud Business
Qlik Sense Cloud Basic and Plus have achieved rapid adoption across a large, global network of individual users who create, manage and share visual analytics daily among their personal networks. We wanted to extend these capabilities and the simplicity of the cloud to small and medium-sized businesses and project teams within an enterprise. We focused on delivering a business-ready, subscription-based offering that lowers the barrier to entry and provides benefit immediately with no capital costs.From the tireless efforts of Qlik's superior products team, I am pleased to announce the general availability of Qlik Sense Cloud Business. Qlik Sense Cloud Business is the next edition in our cloud portfolio that adds a new layer of governance, security and control that supports collaboration and helps operationalize analytics in the cloud.
Key features include:
- Group Level Governance
- Coauthoring Workspace
- Automated Data Refreshes
- Cloud Data Connectivity*
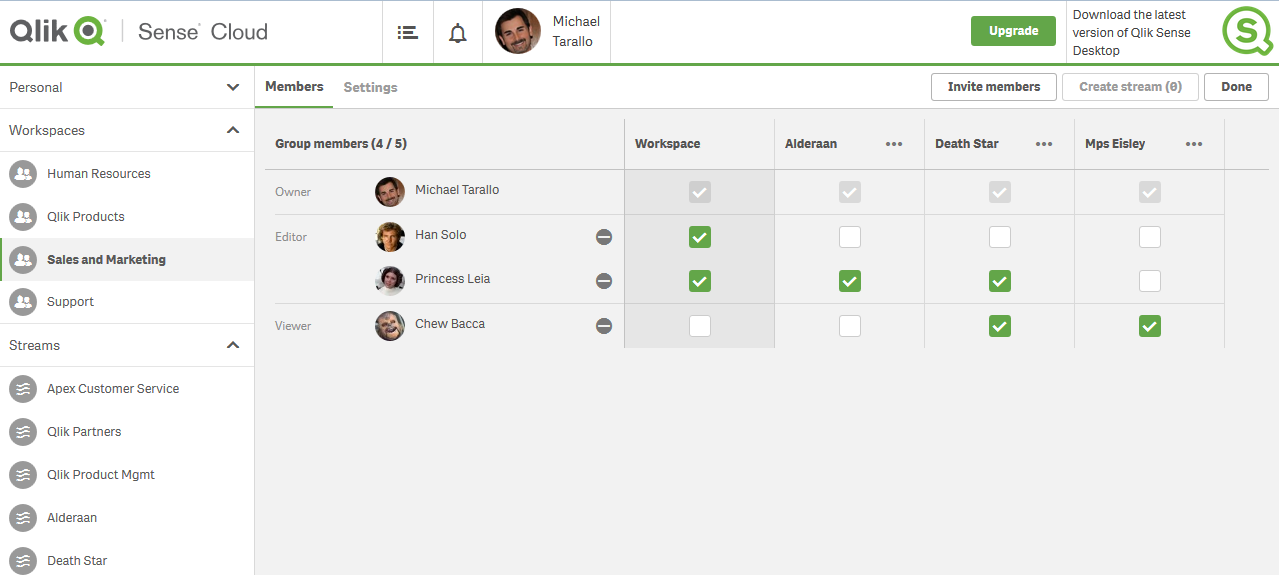
Qlik Sense Cloud Business - Member Settings
Rather than go into a lengthy text-wall describing these capabilities, features and benefits I have prepared a few videos that will help you learn more and become familiar with Qlik Sense Cloud Business.- Qlik Sense in 60 - Introducing Qlik Sense Cloud Business - YouTube
- Qlik Sense Cloud - Upgrading to Qlik Sense Cloud Business - YouTube
- Qlik Sense Cloud Business - Orientation Overview - YouTube
Qlik Sense Enterprise and the AWS Marketplace
Expanding into the cloud does not stop with just Qlik Sense Cloud Business - Qlik Sense Enterprise is also built to run in the cloud (Qlik in the Cloud). Our scalable analytics platform, which can be installed on premise or in the cloud, is now available on the Amazon AWS Marketplace. Our first available offering uses a BYOL or “Bring Your Own License” model. An existing Qlik Sense Enterprise customer can quickly spin up a server in AWS that already has Qlik Sense Enterprise installed on it. This makes it easier and faster to setup a Qlik Sense Enterprise instance for production, testing or even as a proof of concept for your data visualization platform needs. To learn more visit our dedicated Qlik Community space here.
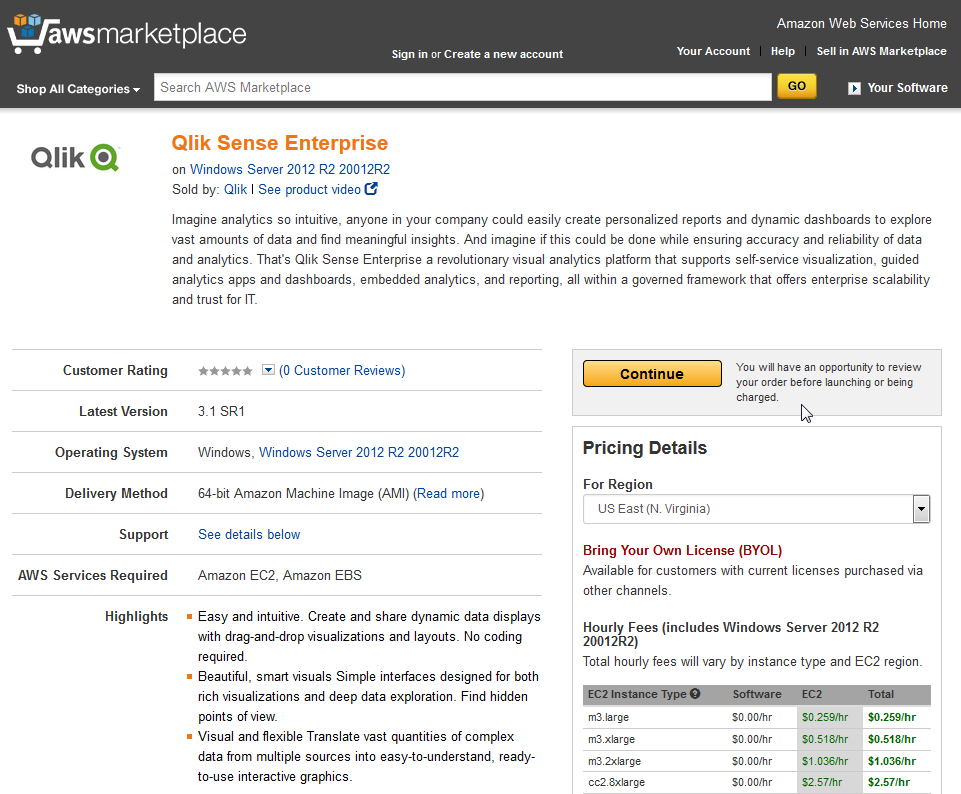
Qlik Sense Enterprise on AWS Marketplace
Regardless of the edition, Qlik Sense is powered by the patented QIX Associative Indexing Engine and provides the security, scalability, and performance of the industry-proven Qlik visual analytics platform. These latest offerings are two exciting milestones on our path of providing flexible cloud solutions to our customers. Now, whether you’re working independently; across a group or project team; or within a large business, Qlik Sense Cloud and Qlik in the Cloud are readily available to help you create, edit, and share compelling visual analytics in the cloud with confidence. If you haven’t gotten started yet, here to join Qlik Sense Cloud for free today!
*Qlik DataMarket and Salesforce.com with REST connectivity and more coming soon.
Regards,
Michael Tarallo (@mtarallo) | TwitterSenior Product Marketing Manager
Qlik
-
ICYMI - Qlik Sense Tips and Tricks Webinar - Tapping into all your data
The following is a recording from our latest Tips and Tricks Webinar.We want to hear from you. Please leave your comments and questions in the comment... Show MoreThe following is a recording from our latest Tips and Tricks Webinar.
We want to hear from you. Please leave your comments and questions in the comments section below.
NOTE: To increase resolution or size of the video, select the YouTube logo at the bottom right of the player. You will be brought directly to YouTube where you can increase the resolution and size of the player window. Look for the 'settings' gears icon in the lower right of the player once at YouTube.
-
Dr Ghosh speaks on Competing using Analytics at Bangalore
Dr. Siddhartha Ghosh from Vidya Jyothi Institute of Technology ( VJIT), spoke at a Qlik organized event in Bangalore, themed "Discover data driven po... Show More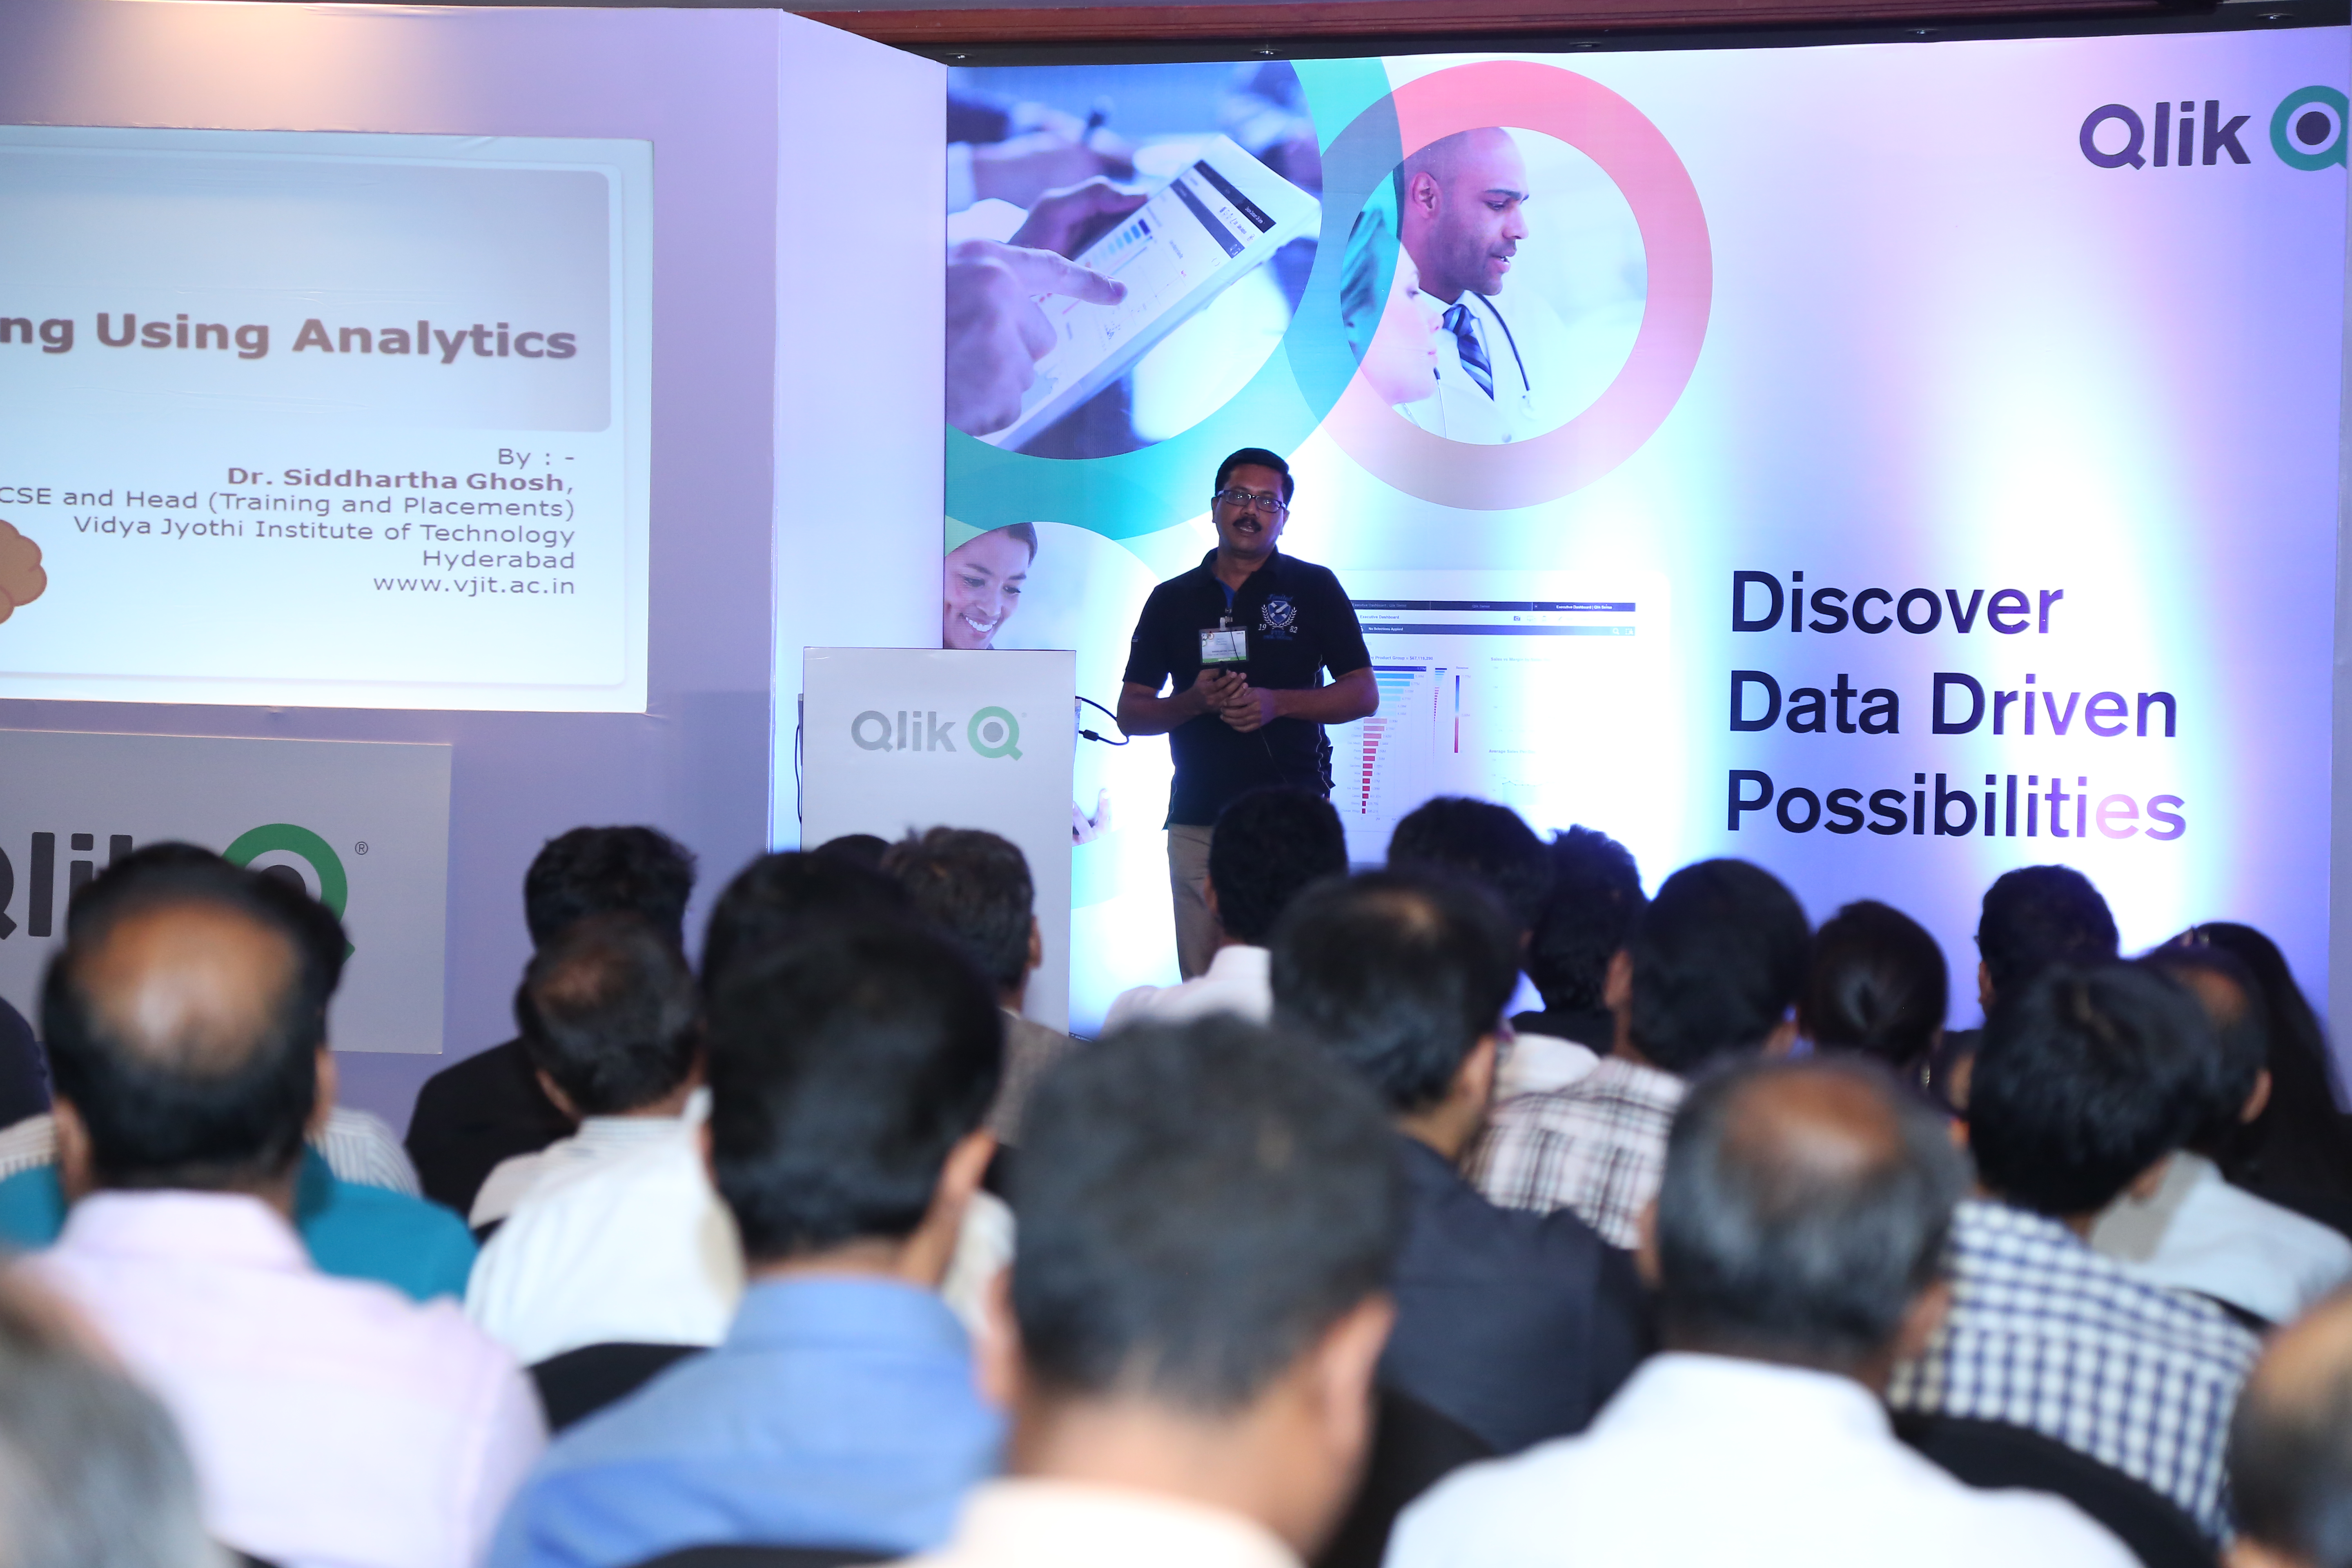
Dr. Siddhartha Ghosh from Vidya Jyothi Institute of Technology ( VJIT), spoke at a Qlik organized event in Bangalore, themed "Discover data driven possibilities" on 26th April. VJIT has partnered with The Qlik Academic Program
This event was attended by more than 100 Qlik customers and prospects. Dr. Ghosh spoke on applications of Qlik Sense for students of data analytics and administration of educational institutions covering areas such as placements, online test and results analysis.
Dr Ghosh had the following thoughts to share:
In the academic arena, Qlik Sense cloud may play a key role for :
- From traditional offline analytics to in-line embedded analytics .This has been the focus for many efforts in the past and will continue to be an important focus for analytics.
- From analyzing historical data (students data, staff data) to explain what happened to analyzing historical and real-time data from multiple systems to simulate and predict the future.
- From Structured and simple data analyzed by individuals to analysis of complex information of many types(text, video) from many system supporting a collaborative decision process that bring multiple people together top analyze, brainstorm and make decisions.
Application of data analytics in Educational Institutions:
- Use of Qlik Sense as a data analytics tool for teaching analytics for B.Tech. CSE/IT students.
- Placement Data Analysis – Details of students recruited every year from the college in different companies can be represented in single pictorial format. Details such as salary package, number of students who got selected in particular company can be represented.
- Online test results analysis – Marks scored by individual students in each consecutive tests conducted in the college can be easily shown.
- Results Data Anlysis – Marks and grades scored by individual student in every semester and over all percentage of every department can be shown. Comparison of individual department percentages can be done through combo charts. Many other hidden information comes out while using Qlik Sense for academic results.
- Faculty data – We can also analyze faculty information and data in simple way using this technology.
Job perspective:
In the field of data visualization and data analytics, there is a huge demand for resources that have created many opportunities. Qlik View is a wonderful tool and have many simple functionalities to create a perfect data model. It is a simple tool to understand and can also be implemented in a smooth way. Freshers or B.Tech. (CSE/IT) graduate students gaining knowledge of Qlik technologies is a great value edition on their biodata.
-
Avoid the Big Software Fail!
According to reports, the two most important factors in realizing the value of software are user adoption and organizational change management. Accord... Show More
According to reports, the two most important factors in realizing the value of software are user adoption and organizational change management. According to a McKinsey study, ROI of software rollouts was 35% when there was little or no organizational change management included. However, the ROI was 143% when excellent organizational change management was included in the initiative. For successful software user adoption, users must be motivated as well as have any hurdles that stand in their way removed. Below are some common hurdles that I have encountered when it comes to software adoption:
- Users either do not have access to the data they need or the data as it exists is not in the right format for them
- Users do not prioritize time to get familiar with the software
- Users do not see how the software will benefit them
- Users try to use the software and they get stuck and do not know where to go for help
- Leadership does not communicate the context and the why behind the software adoption
To read the full article written by Kevin Hanegan, Qlik Vice President of Knowledge and Learning visit

-
Qlik and Solr Search: Focusing the Lens of Unstructured Analytics
Happy Tuesday everyone!. You guys are going to love this one. In this edition of the Qlik Design Blog, our Emerging Technology Evangelist, David Freri... Show MoreHappy Tuesday everyone!. You guys are going to love this one. In this edition of the Qlik Design Blog, our Emerging Technology Evangelist, David Freriks is back discussing integration between Qlik and a powerful big data unstructured search platform called Solr. Not only does David discuss an out-of-the-box approach to this integration, he takes it to the next level and touts the power of the Qlik Platform APIs.
Solr
In case you haven’t seen it – there is a super powerful unstructured search platform used within the big data ecosystem called Solr, built on the Apache Lucene search engine library. What’s great about Solr is that it can index just about anything, text, xml, JSON, PDF, Word, Excel, including almost any kind of text based data. That means you can drop just about anything into Solr and make it searchable using the power of Lucene core which powers the Solr platform.
So, where does Qlik fit in you may ask? Well, let’s observe what a Solr query output looks like:
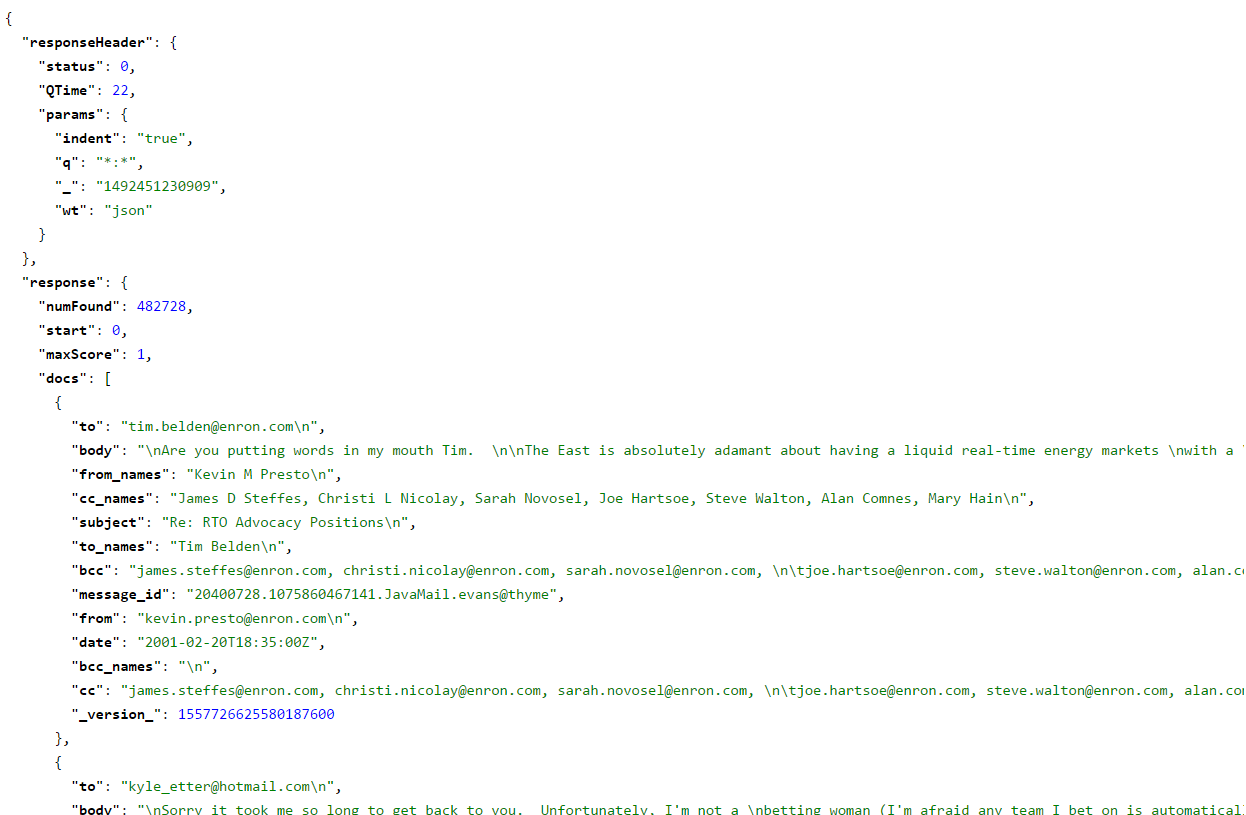
Standard Solr query output
Hmmm, not very user friendly, not to mention it was somewhat slow to execute. Here is a little bit about what we’re looking at:
- This data is the collective set of Enron emails from its infamous collapse in early 2000’s.
- We’ve loaded this data set into our Cloudera cluster and indexed it using Solr.
- Once this data was loaded and indexed we tested with a series of queries.
- A full query on someone with a lot of references such as Ken Lay can run upwards of 15 minutes to bring back every email that contains a reference to him.
Imagine 10’s or 100’s of users each waiting 10-15 minutes for a single question to be answered, it clearly dilutes the effectiveness of the engine as a business tool.
Enter Qlik
Qlik has a tremendously powerful REST connector that is perfectly suited for connecting to sources such as Solr. (A great resource created by Mike Tarallo on the Qlik REST connector can be found here: Working with the Qlik REST Connector, Pagination and Multiple JSON Schemas - check it out to understand the basics of how it works and how the response data is assembled within Qlik)
What follows is how we are using the Qlik REST Connector to connect to Solr.
Qlik In-Memory Analytics with Solr
Now that we are armed with the Qlik REST Connector, and the appropriate Solr REST API connection parameters, we can pull the entire Enron email data set into the Qlik engine via Solr. (Refer to the Apache Solr Documentation to learn more,)
 Qlik REST Connector configuration
By pulling the entire data set, and loading it into Qlik, we now ensure that all users have sub-second access to all the data down to the most granular level, and thanks to our associative search technology – all the data has been indexed and correlated in-memory. We can gain further insights by incorporating stock market data. Combining Enron’s stock performance with their emails tells an interesting story of rising email volume along with collapsing stock prices and elevating trade volumes.
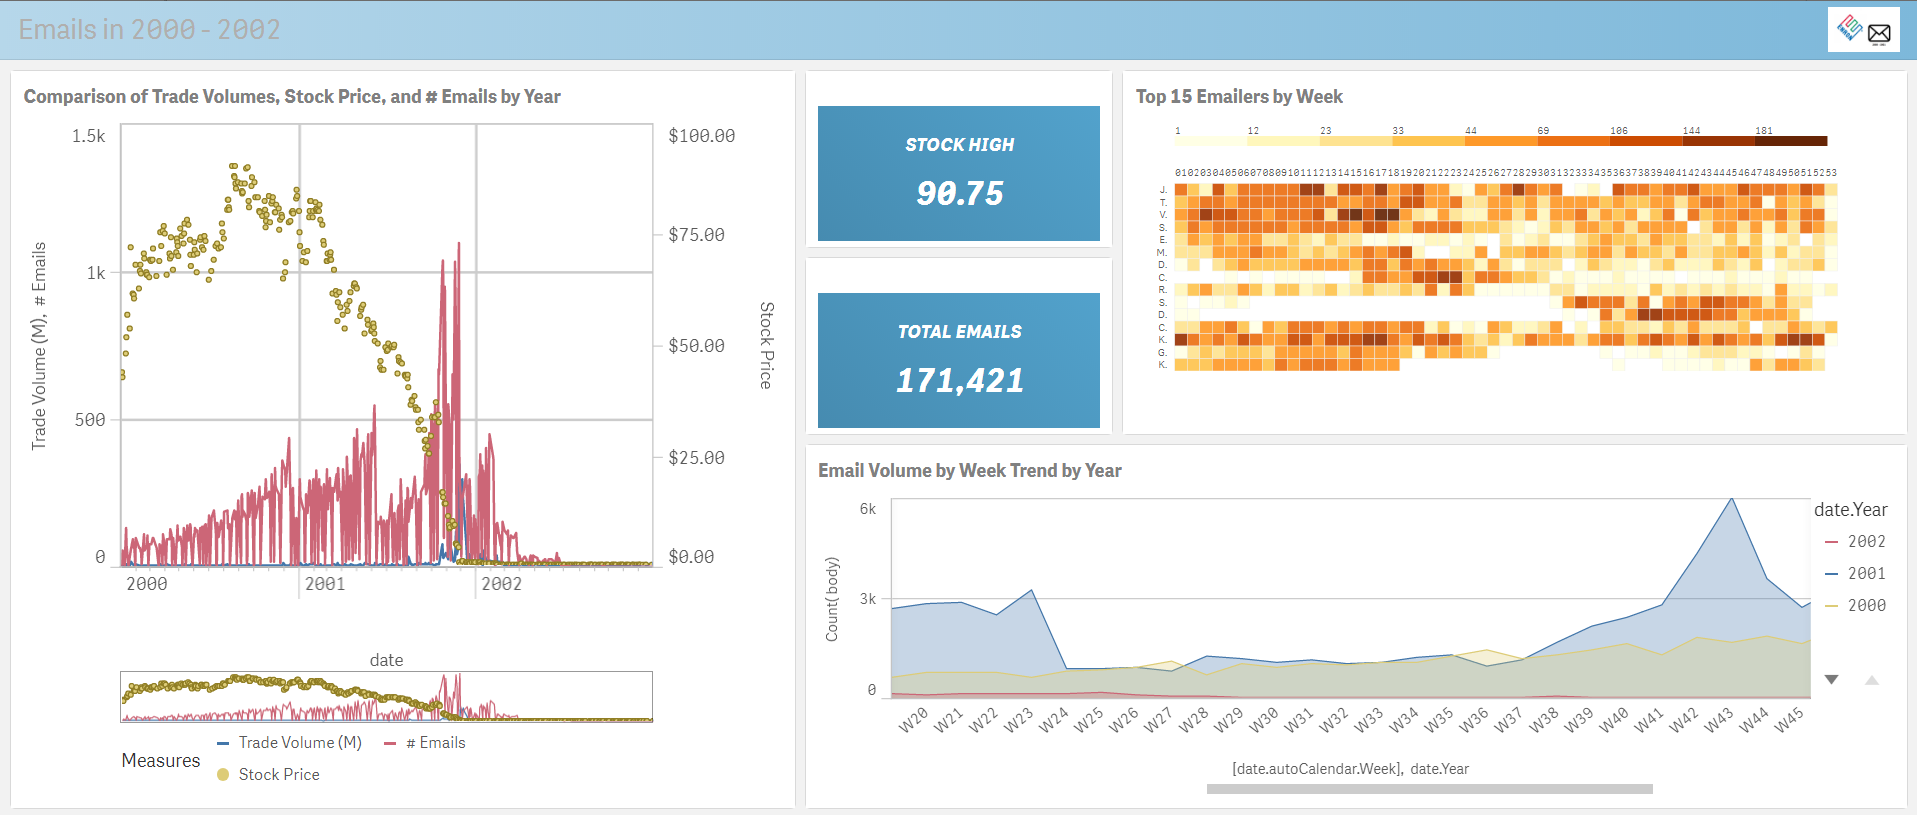
Power of Qlik Data Visualization - Enron stock performance correlated with email volume
Using a mix of visualization techniques, we can see a pretty interesting collection of data, including the famous “deleted emails” gap on the bottom right chart.
Performing some additional analysis, we can drill in on the height of the crash that also correlates with the spike in email volume, followed by a rapid drop in volume.
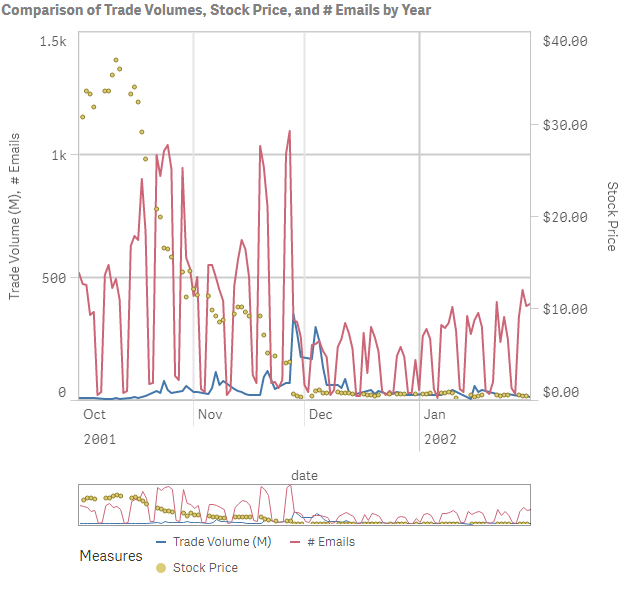 Drop in trade volume
Making a few more selections we can dive down into a specific name, or comment to filter down the result sets further.
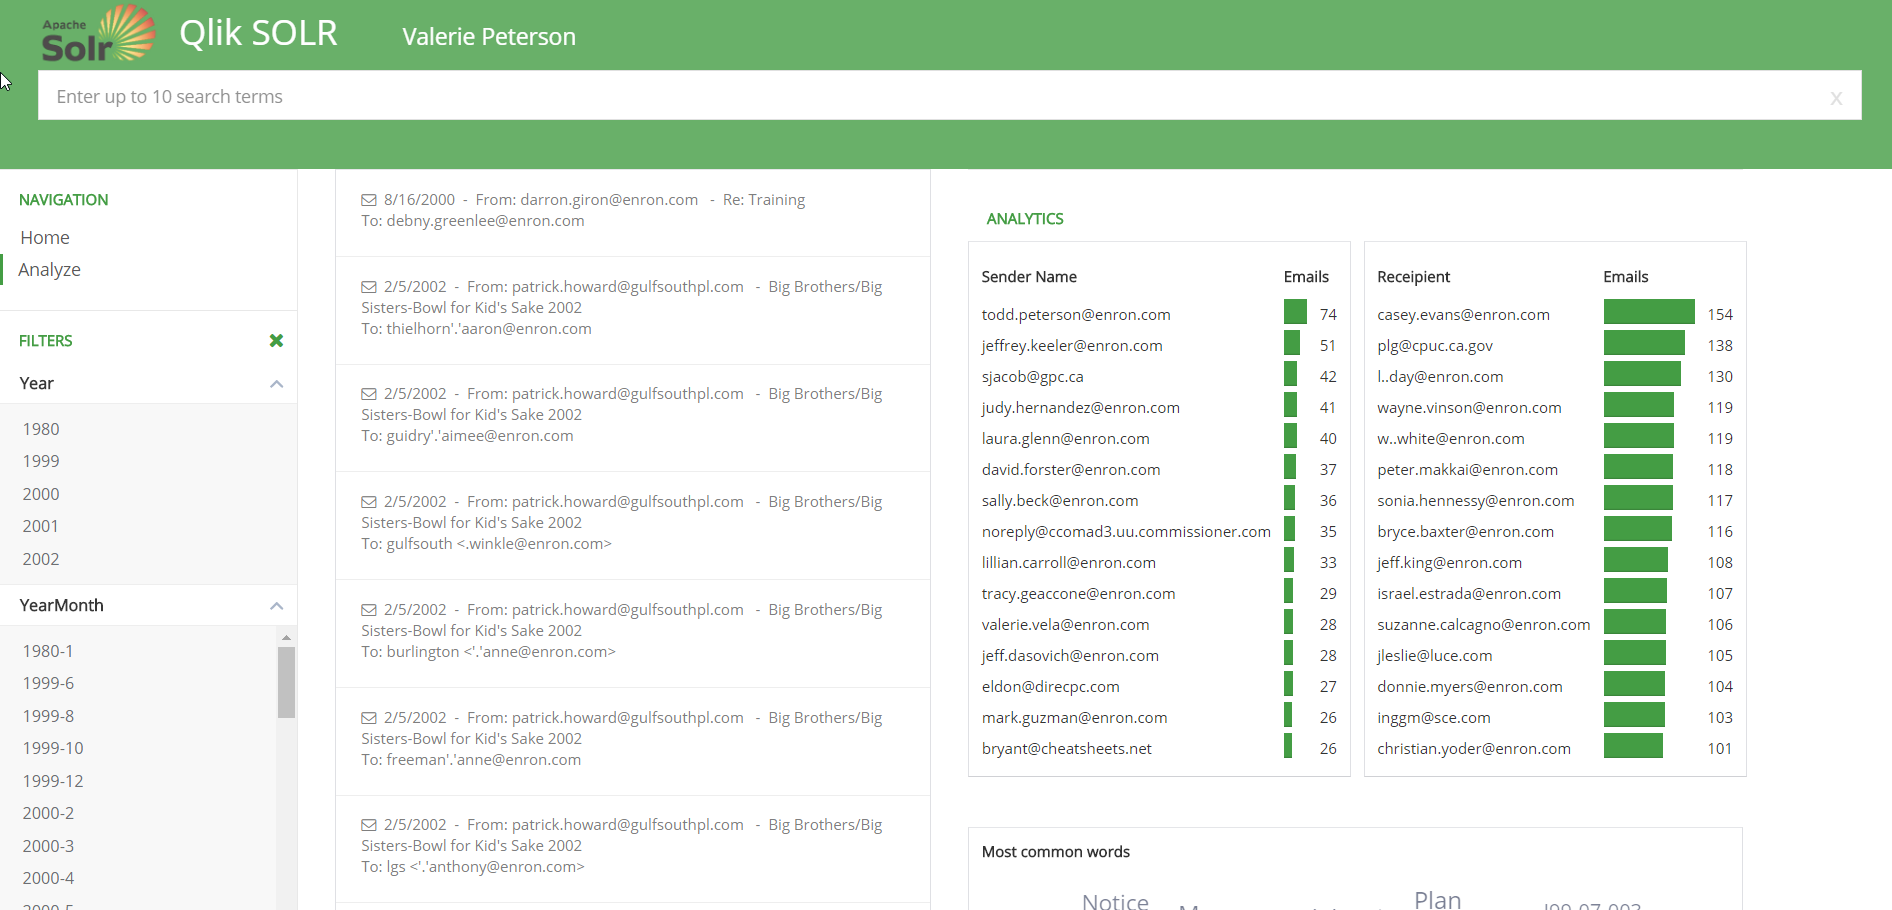
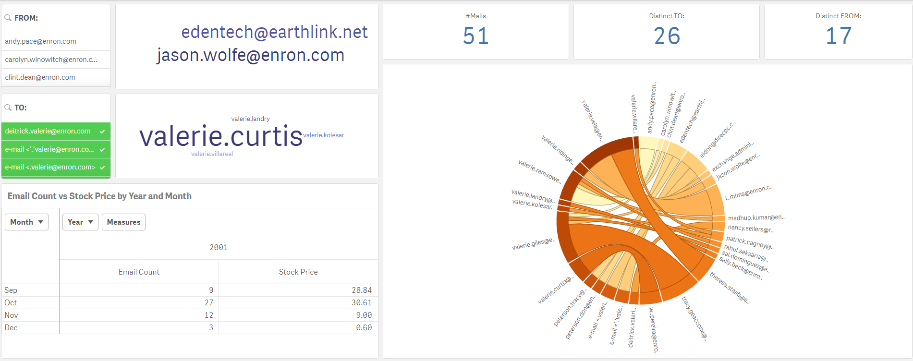 Detail and specifics - name, email address
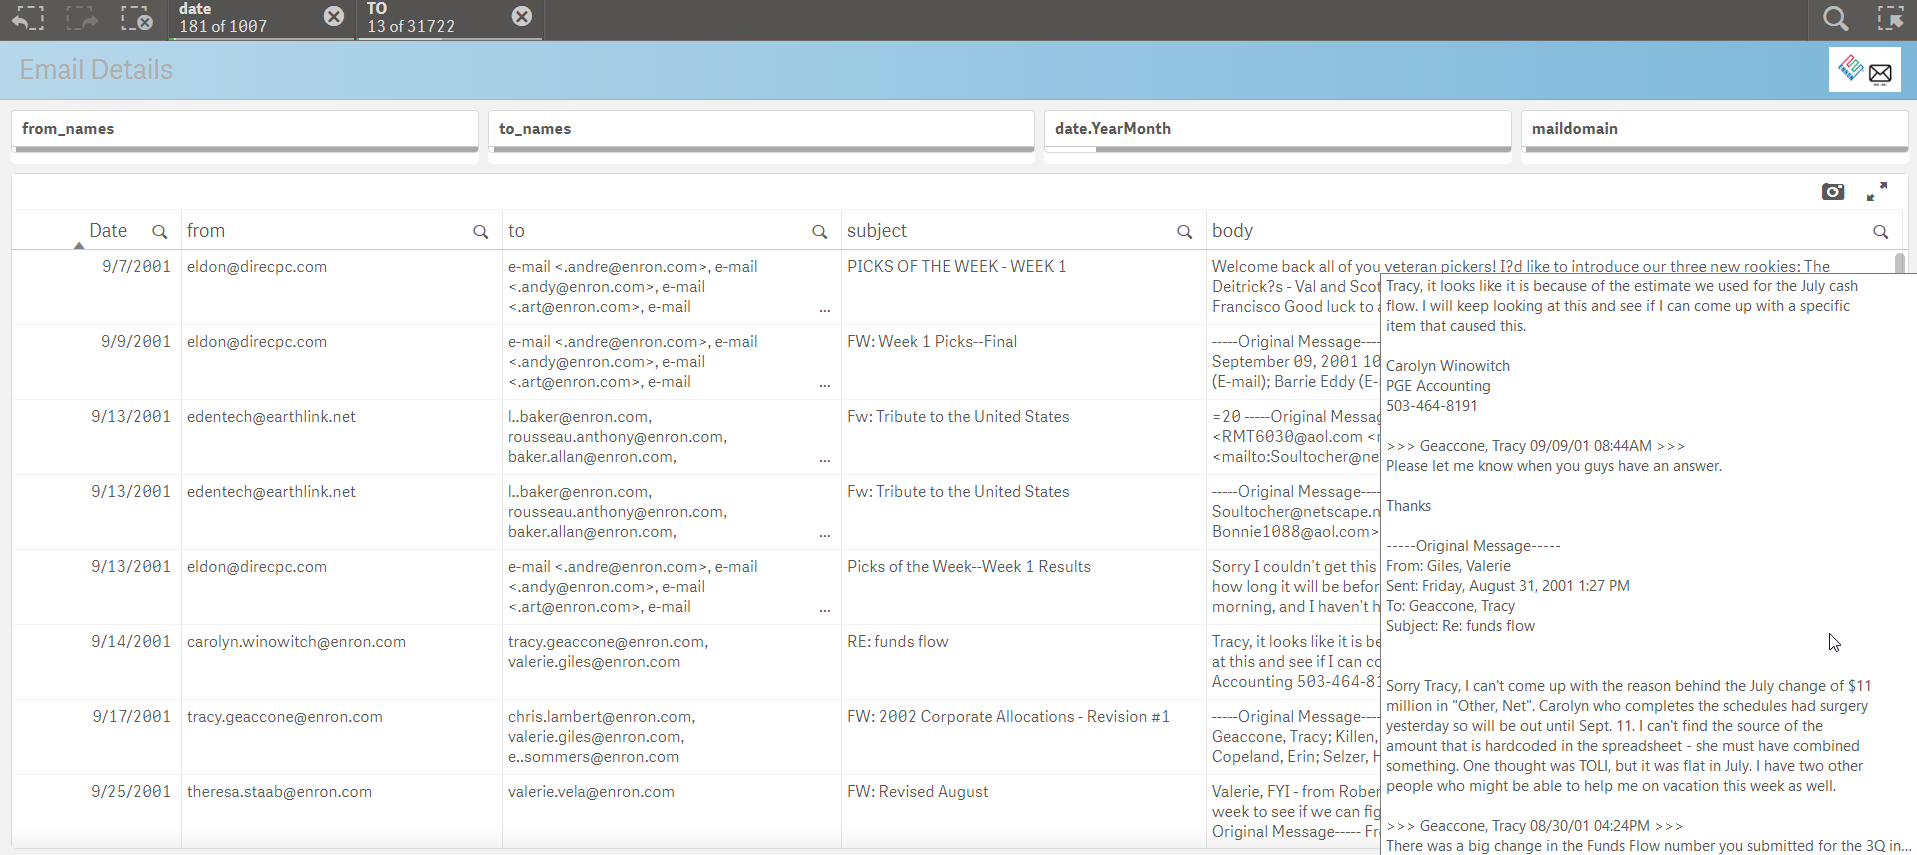
This associative search allows us to dive down into the details of the “TO” elements of the data set and see the metrics affiliated with those names. We can also jump over to the final sheet of the Qlik Sense app and look at the individual emails body content filtered by our prior selections made in the application.
QIX API Powered Solr Search
The above approach of using Qlik in-memory to front end the Solr search engine is just one of the many ways Qlik can access unstructured data in big data systems. Let’s consider another application also using Qlik with Solr – this time with just the Qlik API’s. As a quick refresher, the Qlik engine (called QIX) is a fully API enabled engine with tremendous extensibility that allows Qlik to plug into any web based technology (like Solr). Using the awesome QlikSocial framework from the esteemed Johannes Sunden he adapted the webapp to connect to Solr on demand and build a full webapp from scratch. This is a great example of what we call Custom Analytics.
We start with a search box… And our name(s) of interest:
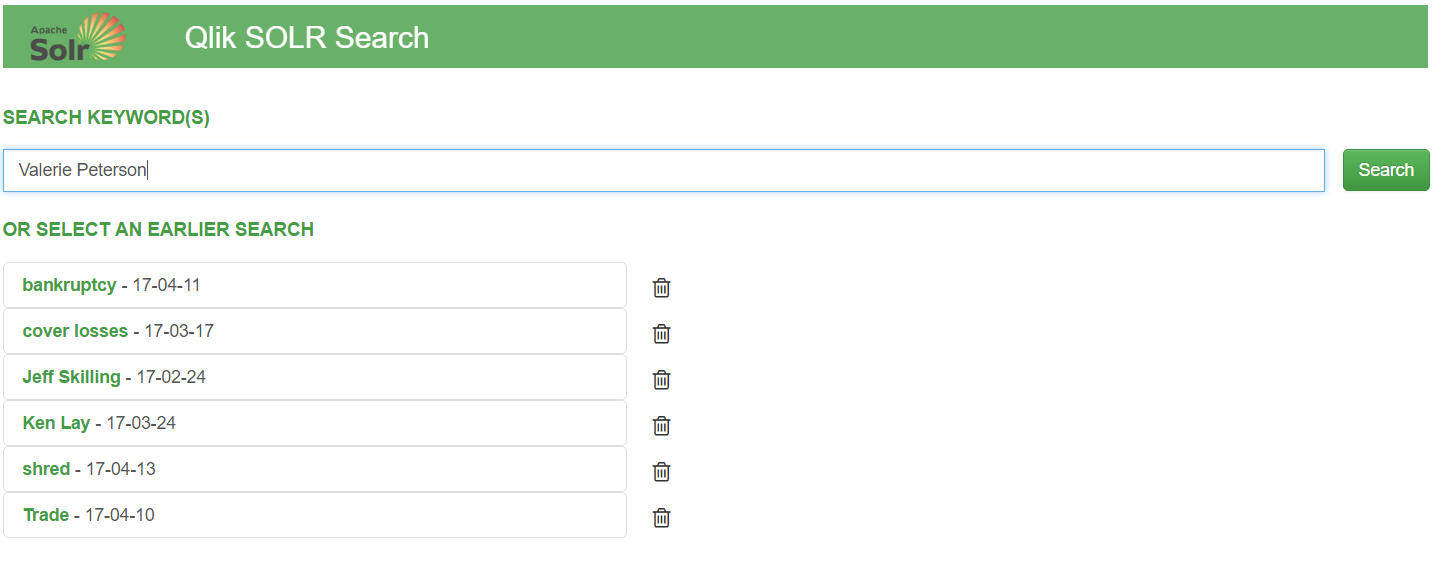
Now unlike the formatted Qlik Sense app, when a user hits the “search” bar – everything will happen dynamically on the fly using the API’s.
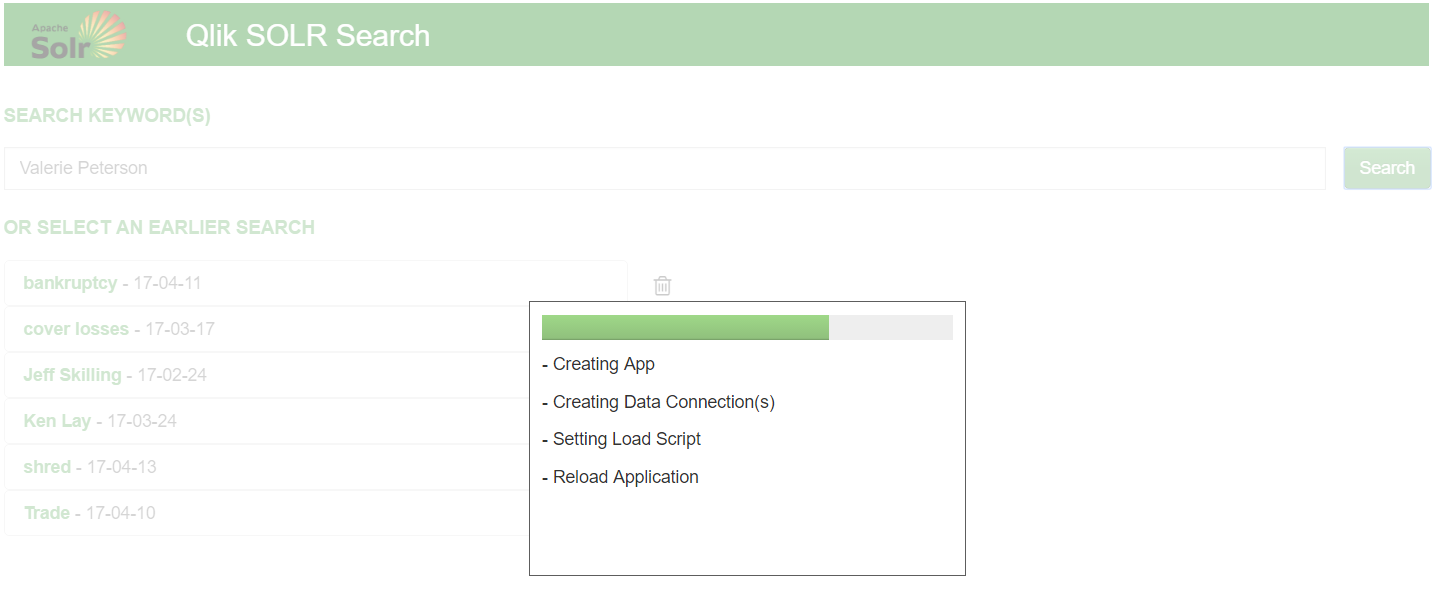
Qlik will dynamically generate a REST connection to Solr, create and load the requesting data into memory, and then build a web app around the data using bootstrap.js and angular.
The webapp is still using the Qlik engine, so selections and the search engine are still available – but all the charts and graphics are html and d3js charts – not Qlik. We’re just powering the app and the data interactivity with the QIX engine!
Summary
Solr is an extremely powerful unstructured search engine that can benefit from the speed and structure of Qlik analytics. It can provide a focusing lens on the core Solr search technology. That data can be consumed in a number of formats including a completely structured Qlik Sense app, or as an API powered web application without any Qlik UI components.
For more information, visit our demo site at cloudera.qlik.com
Enjoy!
Regards,
David Freriks (@dlfreriks) | Twitter
Emerging Technology Evangelist
-
Welcome to the Qlik Product Innovation Blog!
The PRODUCT INNOVATION BLOG is a space where you can come to learn WHAT'S NEW across all of the products in our growing Qlik product portfolio. You c... Show MoreThe PRODUCT INNOVATION BLOG is a space where you can come to learn WHAT'S NEW across all of the products in our growing Qlik product portfolio. You can FOLLOW the entire blog or individual products (listed as authors) so that you only get notified about just those items that are most important to you.
- Qlik Sense
- Qlik Sense Cloud
- QlikView,
- Qlik Analytics Platform,
- Qlik DataMarket,
- Qlik NPrinting,
- Qlik GeoAnalytics, and
- Qlik Connectors
As we continue to grow, we hope that this makes it easier for you to stay up-to-date on all of the amazing innovations Qlik has to offer.

WHERE TO GO FROM HERE...
To ensure that you are notified regarding every update, click the 'Follow' button in the top right corner of the page. To follow an individual product, choose the product name from the Author's drop-down and then click on the 'Follow' button.
-
The University of Maryland
This week the Academic Program hosted a workshop at the University of Maryland in the United States. The university wasintroduced to Qlik by a local ... Show MoreThis week the Academic Program hosted a workshop at the University of Maryland in the United States. The university was
 introduced to Qlik by a local partner who hires students from the University with Qlik experience. The workshop was facilitated by two senior Solutions Architects who taught students about the power of Qlik and how Qlik Sense can be used in both their professional and personal lives to simplify their data!
Below is a quote from the professor expressing his gratitude
"It was very evident that Jesse and David used this knowledge in Thursday's demonstration, even down to the smallest detail of including "Terp" in product descriptions. My hat is off to Jesse and David for your great teamwork. The business example allowed us to see the power of Qlik"
-
Qlik Sense Cloud Business and the Web Connectors
Wow that's some title huh? Ooooh - "Qlik Sense Cloud Business and the Web Connectors" - sounds like the title for a fantasy adventure novel. Seriously... Show MoreWow that's some title huh? Ooooh - "Qlik Sense Cloud Business and the Web Connectors" - sounds like the title for a fantasy adventure novel. Seriously, Denise LaForgia and I are back with a Qlik Sense Cloud Business update including some new videos to briefly introduce you to some really cool and new capabilities available in Qlik Sense Cloud Business - our new Web Connectors starting with access to data for Google Analytics, Twitter and Facebook. Take it away Denise!
Thanks Mike!
As promised in my blog last month, I’m back with more exciting updates about new features in Qlik Sense Cloud Business. Following our launch of REST Connectivity, I’m excited to announce that Facebook, Twitter and Google Analytics data sources are now also available in Qlik Sense Cloud Business under our new Web Connectors package.
For business users in particular, these connectors provide an easy way to bring together and analyze multiple data sources and data sets that are critical to sales, marketing, and other business initiatives. While some tools for social and sentiment analysis might allow you to analyze data from those sources individually, the power of Qlik Sense lets you associate this data about social and digital activity with other information about your customers, sales, marketing campaigns, customer service, and more.
Here’s an overview of the type of data each connector can return:
Google Analytics
The data returned includes many of the fields you’d see in the Google Analytics dashboard, such as page views, top landing pages, most visited pages, etc. You can retrieve data on any Google Analytics-enabled website.
- Accounts: returns the accounts that the user has access to
- DataFromQueryURI; enter a query URI on this table
- DataFromTemplateQuery: returns a report from one of the available prebuilt queries
- WebProfiles: returns the profiles that the user has access to
- WebProperties: returns the web properties the user has access to
Watch Mike's brief video to get a general idea of how it works:
Community page and video download
Twitter
The content returned includes all tweets that include a hashtag or search term, and you can use Twitter query operators to pull data for more specific, detailed searches.- Mentions: returns up to 800 tweets for a Twitter screen name
- Search: returns tweets based on a search term and other parameters
- SearchAdvanced: returns tweets based on search term and other parameters and returns more columns than simple search
- UserSearch: returns information about an account based on a named user search or topic search
In this video Mike shows how simple it is to get after Twitter data:
Community page and video download
Facebook Fan Pages and Groups
The data retrieved includes textual content (posts and comments) as well as counts of likes and shares.
- Feed: returns the feed of posts (including status updates) and links published by the selected page, or by other users on the page.
- Page: returns a single page
- User Info: returns a single user - note - user identify / vanity id is used as the parameter
In the final video we close the loop on the last of the connectors by simply getting access to Facebook data:
Community page and video download
How to Get Started
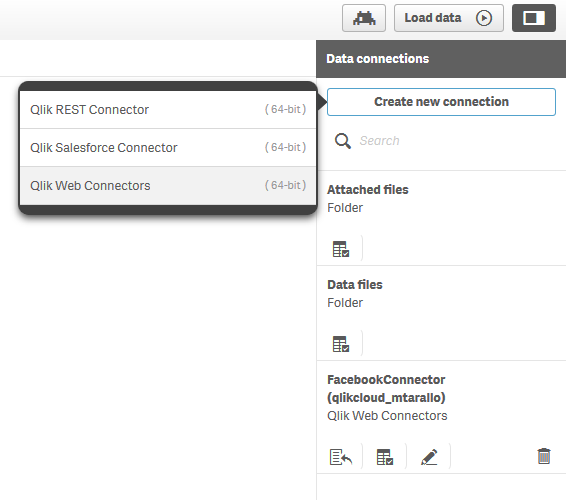
While in your Qlik Sense Cloud Business workspace, you can set up your connections within your app by going into the data load editor and selecting the Create New Connection button. You’ll have to authenticate each connection using credentials from an account – your personal account, or one belonging to your business, group or organization. Once the connection is established, you can begin retrieving data.
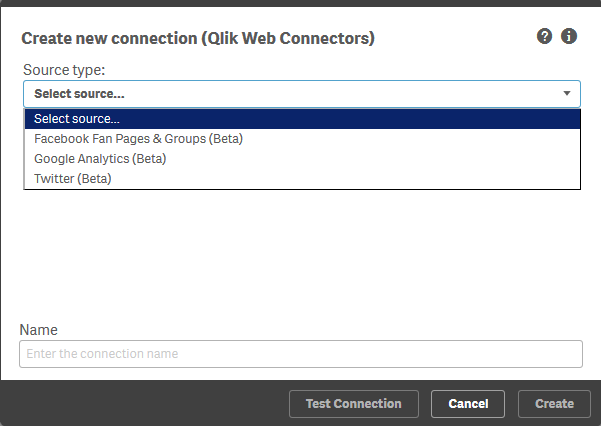
We’re rolling out additional connectors in the next few weeks, so stay tuned for additional information!
Learn more
Of course check out the videos and for more detailed information and instructions, visit these resources:
Enjoy your day!Denise LaForgia
Senior Product Marketing Manager
Qlik
Resources:
-
The Calculation Engine
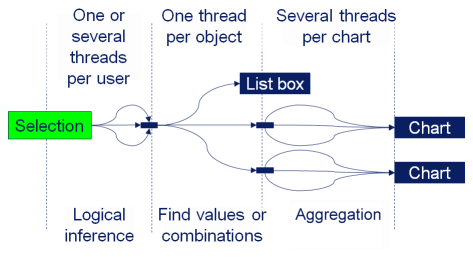
In a previous blog post, I wrote about Logical Inference and Aggregations, explaining that two different evaluation steps are executed every time yo... Show MoreIn a previous blog post, I wrote about Logical Inference and Aggregations, explaining that two different evaluation steps are executed every time you click in QlikView. This post will focus on the second evaluation step – The calculation of all objects.
This is The Calculation Engine.
The Calculation Engine (sometimes called the Chart Engine) is used in all places where you have aggregations. And since you have aggregations in almost every expression, the calculation engine can be invoked from any object: Usually it is invoked when calculating the measure in a chart, but it is also used for labels, for calculated colors, for text boxes, for show conditions, and for advanced search strings.
The calculation engine runs through two steps: First it finds combinations of the values of the fields used in the aggregation function, and, if necessary, builds a temporary look-up table. Then, it performs the actual aggregation using the look-up table to create all relevant combinations. If the aggregation is a measure in a chart or in an Aggr() function, the aggregation is made separately for every dimensional value, using the appropriate scopes.
- The Logical Inference
- The Calculation Engine (once for every object or aggregation)
- Find all combinations (create the necessary look-up tables)
- Aggregate
The different phases can be seen in the picture. The text “Chart” here represents any object with an aggregation, and the text “List box” represents a standard List box without aggregation.
Examples:
Sum( Amount )
In this case, the summation is made in the data table where the field Amount is found. Hence, “finding the combinations” is reduced to looking in this table.Sum( NoOfUnits * UnitCost )
In this case, there are several fields inside the aggregation function. If the fields reside in different data tables, QlikView first generates the look-up table for UnitCost using the appropriate key, e.g. ProductID. Then it generates all combinations of the relevant field values using the look-up table – basically a join – and makes the summation on the fly.Sum( NoOfUnits * UnitCost ) / Count( distinct OrderID )
The numerator is the same as before (and treated the same) but now there is an additional aggregation in the denominator. So, QlikView will need to generate a help table for this aggregation too, listing the distinct order IDs. For each dimensional value, two aggregations are made, whereupon the ratio between the two is calculated.Sum( If( IsThisYear, Amount ))
Flags are often used inside aggregation functions, and usually this is not a problem. However, be aware that QlikView will create all combinations of the two fields before summing, and that this could in odd cases cause duplication of records.The aggregation step is multi-threaded. However, finding the relevant combinations of field values is currently a single threaded operation, and may occasionally be the bottle-neck when calculating a chart. So be aware of this when you use fields from different tables in the same aggregation function. You might want to consider moving a field to the “correct” table to minimize the impact of this step.
PS. All of the above is of course true for both QlikView and Qlik Sense. Both use the same engine.
If you want to read more about QlikView internals, see also
Symbol Tables and Bit-Stuffed Pointers
Colors, states and state vectors
Logical Inference and Aggregations
It’s all Aggregations
-
The Above Function
The Above() function is a very special function. It is neither an aggregation function, nor a scalar function. Together with some other functions, e.g... Show MoreThe Above() function is a very special function. It is neither an aggregation function, nor a scalar function. Together with some other functions, e.g. Top(), Bottom() and Below(), it forms a separate group of functions: Chart inter-record functions. These functions have only one purpose: To get values from other rows within the same chart.
The basic construction is the following:
Above( Sum( Sales ) )
This will calculate the sum of sales, but for the row above.
The most common use case is when you want to compare the value of a specific row with the value of the previous row; e.g. this month’s sales compared to last month’s sales.
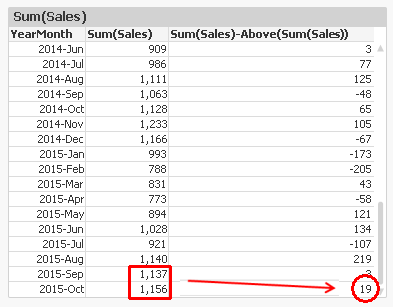
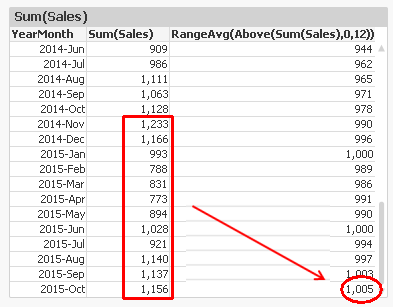
Another use case is when you want to calculate rolling averages. Then you need to use the second and third parameter; the offset and the number of cells. Below, I use
Above( Sum( Sales ), 0, 12 )
The function will return 12 rows: the value for current row and the 11 rows above. This means that you need to wrap it in a range function in order to merge all values to one value. In this case, I use RangeAvg() to calculate the average of the 12 rows.
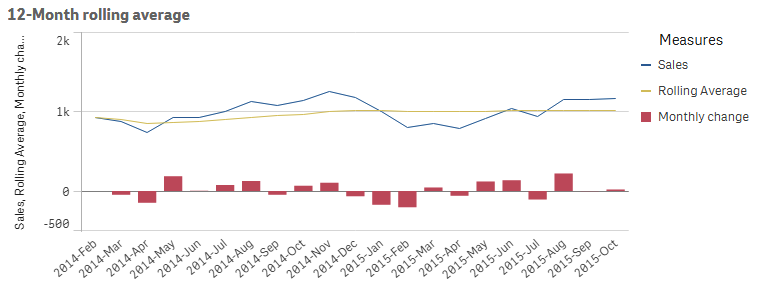
However, both the above solutions have a flaw: They don’t take excluded values into account. For example, if April is excluded due to a selection, the previous month of May becomes March, which probably isn’t what you want.
To correct this, you need to make the chart show all months, also the excluded ones. In QlikView, you have a chart option “Show all values” that you can use. A method that works also in Qlik Sense, is to add zero to all values, also for the excluded dimensional values:
Sum( Sales ) + Sum( {1} 0 )
Make sure to “Show zero values”.
You can also use the Above() function inside an Aggr() function. Remember that the Aggr() produces a virtual table, and the Above() function can of course operate in this table instead. This opens tremendous new possibilities.
First, you can make the same calculations as above, by using
Only(Aggr(Above(Sum({1} Sales)), YearMonth))
Only(Aggr(RangeAvg(Above(Sum({1} Sales),0,12)), YearMonth))
Note the Set Analysis expression in the inner aggregation function. The {1} ensures that all values in the virtual table are calculated, so that the Above() function can fetch also the excluded ones. Using {1} is maybe too drastic – it is often better to use a Set expression that clears only some fields, e.g. {$<YearMonth=>}.
Further, you can have a virtual table that is sorted differently from the chart where the expression is displayed. For example, the expression
Aggr(Above(Sum(Sales)),Year,Month)
displays the value from the previous month from the same year. But if you change the order of the dimensions, as in
Aggr(Above(Sum(Sales)),Month,Year)
the expression will display the value from the same month from the previous year. The only difference is the order of the dimensions. The latter expression is sorted first by Month, then by Year. The result can be seen below:
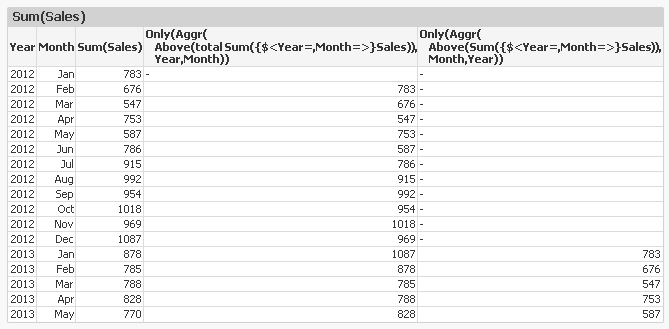
An Aggr() table is always sorted by the load order of the dimensions, one by one. This means that you can change the meaning of Above() by changing the order of the dimensions.
With this, I hope that you understand the Above() function better.
Further reading related to this topic:


