Unlock a world of possibilities! Login now and discover the exclusive benefits awaiting you.
Analytics & AI
Forums for Qlik Analytic solutions. Ask questions, join discussions, find solutions, and access documentation and resources.
Data Integration & Quality
Forums for Qlik Data Integration solutions. Ask questions, join discussions, find solutions, and access documentation and resources
Explore Qlik Gallery
Qlik Gallery is meant to encourage Qlikkies everywhere to share their progress – from a first Qlik app – to a favorite Qlik app – and everything in-between.
Qlik Community
Get started on Qlik Community, find How-To documents, and join general non-product related discussions.
Qlik Resources
Direct links to other resources within the Qlik ecosystem. We suggest you bookmark this page.
Qlik Academic Program
Qlik gives qualified university students, educators, and researchers free Qlik software and resources to prepare students for the data-driven workplace.
Recent Blog Posts
-
Thank you for making Qlik Connect a success!
Well, that’s a wrap on Qlik Connect 2024. There were so many product announcements and stories shared from our customers and partners. We were so luc... Show MoreWell, that’s a wrap on Qlik Connect 2024. There were so many product announcements and stories shared from our customers and partners. We were so lucky to have such a great crowd attending both in person and virtually. We saw so many of you sharing the week’s festivities using #QlikConnect on LinkedIn. But let’s continue the conversation here!
What were some event highlights for you?
Did you make any great connections?
Give us the details!
We loved having you in Orlando this year, hope to see you in 2025!
-
Qlik Inline load
Inline load is a type of data load that can be used when you do not have a data source. The data can be entered manually or by using the wizard within... Show MoreInline load is a type of data load that can be used when you do not have a data source. The data can be entered manually or by using the wizard within QlikView or Qlik Sense.
Here are a couple of key things to remember:- Data entered through an inline clause must be enclosed by square brackets [ ]
- The columns of the table are defined in the first line of the inline load statement, separated by comas.
- A semi colon (;) is required after the closing square bracket
Here is an example of a simple table using inline load:Load * Inline [
ID, Name, Age, Title
1, Wladimir, 31, Team Lead
2, Paul, 22, Technical Support Engineer
3, Mark, 40, Customer Support Engineer
4, Janne, 27, IT Specialist
];
In the example inline load above, the columns for the table are:
- ID
- Name
- Age
- Title
The values starting with 1, are all data values that will populate the table. After loading the data, and looking at the data model, it will look like a normal table:As with any other dataset, two inline load tables can be created and be connected as can be seen below. You can also connect your inline table to an already existing table:
Inline load using the QlikView wizard:
You can accomplish the same result using the QlikView Inline load wizard.
In the edit script window, go to Insert > Load Statement > Load Inline. A window with a structure of a table will appear. Select the top cell indicated by F1 and change its value to the name of your first column. Repeat for the other columns of your inline table. Insert the data to create the table. At the end, your table should look like this:Inline load using the Qlik Sense wizard:
In the Data Manager, select the ‘Manual Entry’ option located at the top left corner of the screen.
Add the table name and double click on Field_1 cell to insert your first column name. Repeat this for the other columns. After naming all the columns, you should have something like in the image below.
Note that at the bottom right you can see the column count = 4 and number of rows = 0. If you Insert data, you see that the number of rows is no longer 0.For more detail information on using the Qlik Sense Wizard, please see the following resources:
Manual Entry - Qlik Sense
Inline load Delimiter
Please give this post a like if you found it helpful! Also please let us know if you have any questions or leave your feedback in the comments. -
Healthcare Dashboard (Oncology)
Healthcare Dashboard AnyChart Unlock transformative insights in healthcare using Decomposition Tree, Gantt Chart, Combo Chart, Sunburst Chart, a... Show MoreHealthcare DashboardAnyChart Unlock transformative insights in healthcare using Decomposition Tree, Gantt Chart, Combo Chart, Sunburst Chart, and Timeline Chart visualizations in Qlik Sense.
Discoveries
Dive deep into metrics like admissions, patient counts, and treatment costs. Perform root cause analysis or ad-hoc explorations with ease. Maintain clear, actionable visibility of doctor-patient timelines and track each patient's journey with insightful precision.
Impact
Experience how charts like Decomposition Tree, Gantt Chart, Combo Chart, Sunburst Chart, and Timeline Chart can enable powerful insights for a healthcare (oncological) institution
Audience
Healthcare institutions looking to unlock more efficient and insightful exploration of their data within their Qlik environment.
Data and advanced analytics
This application features Decomposition Tree, Gantt Chart, Combo Chart, Sunburst Chart, and Timeline Chart visualizations built with AnyChart's extensions for Qlik Sense. The data is fictional, representing a healthcare (oncological) institution.
-
Release Cadence Update: Qlik GeoAnalytics
We are introducing changes to the release cadence of our Qlik GeoAnalytics products, including: Server, Plus, Extensions, and Connectors for Qlik Sen... Show MoreWe are introducing changes to the release cadence of our Qlik GeoAnalytics products, including:
- Server,
- Plus,
- Extensions,
- and Connectors for Qlik Sense Client Managed and QlikView.
Beginning with May 2025, we will be releasing one yearly update, with a target release month of May. If needed, we will deliver service releases throughout the year on demand.
As always, we recommend upgrading to the latest available release and SR (service release). If you are looking for information on version compatibility, see our official documentation.
This change was done to match with Qlik Sense Enterprise On Windows.
General GeoAnalytics information
About Qlik GeoAnalytics | Qlik GeoAnalytics Help
Version Compatibility
GeoAnalytics for Qlik Sense supported versions | Qlik GeoAnalytics Help
GeoAnalytics for QlikView supported versions | Qlik GeoAnalytics HelpDon't hesitate to reach out with any questions you might have.
Thank you for choosing Qlik,
Qlik Support -
OpenID Connect configuration in Qlik Cloud Services - Explained
OpenID Connect configuration in Qlik Cloud Services - Explained OpenId Connect wants to be a simplified mechanism for modern web application authentic... Show MoreOpenID Connect configuration in Qlik Cloud Services - Explained
OpenId Connect wants to be a simplified mechanism for modern web application authentication. But like most identity management schemes in software there are so many details to consider it can be hard to understand all the I/O. In this blog, I'll give my best effort to explain OpenId so you can speak about it intelligently, at least in context of configuring it for use with Qlik Enterprise SaaS.
OpenID Connect has more words and acronyms to try to explain what it is than letters in the word "authentication", including OAuth, JWT, claims, client, authorization server, and more, so it makes sense to begin with some basic definitions.
TL;DR
- OpenID Connect and OAuth 2 basic description
- Qlik Cloud Service input fields for configuring an identity provider using OpenID Connect
- Resources to learn more about Qlik Cloud Services and authentication
Basic Definitions
- OpenID Connect == aka OIDC, an authentication scheme for modern web applications
- OAuth 2.0 == an authorization framework and the foundation of OpenID Connect
- JWT == JSON web tokens contain the payload exchanged in an OAuth 2.0 handshake
- Token == a JWT
- Payload == Information in the form of claims to be exchanged
- Claims == the information describing the subject of the JWT
- Subject == aka "sub", a unique identifier, and claim, typically representing a user
- Resource Owner == the user accessing a third-party application through OpenID Connect
- Authorization Server == an identity provider, or the resource server storing information about the resource owner
- Third-party Application == the "client" application requesting information about the resource owner from the authorization server
- Client == for the purposes of this blog, Qlik
- Scopes == permissions the authorization server grants the client, in many cases access to additional claims necessary to fulfill the client auth request
Check out the links at the end of the blog to learn more about OpenID, OAuth 2.0, and JWT
This is not an exhaustive list of terms in the OIDC orbit, however, it's a decent primer for what you need to know for integrating OpenID with Qlik.
The Double-click
If all I gave you were the basic definitions, you may feel bamboozled by the title of the blog. So here is some additional context for OpenID Connect and OAuth 2.0 before I get into Qlik-specific details.
OpenID Connect
OpenID Connect is an identity layer built on the OAuth 2.0 protocol. OIDC, as it is commonly referred, verifies identities between third-party applications like Qlik and an identity provider like Azure Active Directory, Okta, or Auth0. OIDC exchanges information using JWTs (aka JSON web tokens.)
OAuth 2.0
OAuth 2.0 is a framework for authorizing applications to share user profile information between a resource owner (the user), the authorization server (the identity provider), and the third-party application (aka the client, aka Qlik.) Exactly what information is shared depends upon the "scopes" the authorization server grants the client application.
Qlik and the Identity Provider
In Qlik SaaS, there are four different types of identity providers you can set up in an instance. This blog is interested in only discussing the Interactive option because it is the choice for connecting Qlik to an OIDC provider.
Selecting Interactive populates the Provider drop-down list with a number of popular vendors who offer OIDC capabilities. Depending on the provider you select, common values in the Claims mapping and Advanced settings sections will auto-populate in the text boxes. I'll discuss Claims mapping in more detail below. For now, I'm going to move to the Application credentials section of the configuration
Application credentials
The Application credentials section of the configuration is where you enter in the information that identifies Qlik as a registered application with the identity provider.
This blog doesn't cover the manual configuration options. Check help.qlik.com for information related to Application credential manual configuration.
Provider configuration URI
The configuration URI is a publicly accessible web address Qlik can navigate to access the OIDC metadata for the identity provider. The metadata informs Qlik of additional URIs to authenticate users and acquire JWTs containing supported claims, among other data describing the authorization server. Typically, the configuration URI will look like this:
https://login.microsoftonline.com/<your-azuread-tenant-id>/v2.0/.well-known/openid-configuration
Client ID
The Client ID is a public, unique string issued by the identity provider representing the application registration; in this case Qlik is the registered application with Microsoft Azure Active Directory. Qlik supplies the Client ID to Azure AD during authentication requests to route the request properly. Without the Client ID, Azure AD can't identify the app registration and responds with an error.
Client secret
The Client secret is a private, unique string issued by the identity provider, known only to the client and the authorization server. It is used in requests made to the identity provider to acquire the JWT token containing the authenticating user's profile information.
Courtesy xkcd
Realm
The Realm is an optional value intended to contain a pattern to determine the validity of an OpenID authentication request. In Qlik, it is sometimes used to specify a Windows domain which gets prefixed to the userid.
Claims mapping
When a user authenticates successfully to Qlik, the authentication service generates a new "internal" token using the claims from the identity provider token. The claims are "mapped" to this new token based on the claim names in each of the text boxes for the corresponding claim.
Certain claims, like the sub, email, and email_verifed are required claims from the identity provider token. Others, like groups and picture are optional claims. In Qlik SaaS, all of the claims listed in the mapping section are configurable, meaning you can set it to any claim name you know exists in the identity provider token.
sub (Subject)
The sub is a unique identifier representing the End-User at the identity provider.
The sub claim value must be unique for each End-User accessing Qlik SaaS because the platform relies upon the sub claim to act as the unique UserId in Qlik.
The typical sub value looks like a random string of characters like AItOawmwtWwcT0k51BayewNvutrJUqsvl6qs7A4. But as you can see, as a UserId the sub isn't readable. If you are migrating from an on-premises Active Directory to Azure AD, you may want to consider an alternate claim for the mapped sub.
A Short Detour to AD Land
If you are used to example\hardcoreharry representing a UserId, then chances are you have migrated from an on-premises Active Directory to Azure AD.
The identifiable UserId in this pattern is known as the sAMAccountName. sAMAccountName is an available claim if your Azure AD synchronizes with an on-premises AD through AD-Connect. If you have Qlik Sense applications with Section Access script, consider changing the sub claim to map the sAMAccountName from the identity provider token.
name
The name is a standard claim sent in OIDC JWTs. It represents the End-User's full name. Qlik will use this mapped claim as the friendly name used in greetings, user profile information, and in access control settings for artifacts like spaces.
groups
Groups is not a standard claim of OIDC. It is an optional claim that needs to be configured to be sent by the identity provider. Its name gives away the values the claim contains, but make sure you know the way the values appear. Certain identity providers like Azure AD do not send friendly names for native groups using an optional group claim, sending the unique identifier for the group instead.
email
Email is a standard claim of OIDC, and is intended to represent the preferred email address of the End-User. Some providers do not send the email address in the email claim because their own services support the user having multiple preferred email addresses. For example, in my Azure AD there is no value in the email claim for my users, however, the upn contains the End-User email address because it is the user principal name for that user.
client_id
The client_id claim contains the same value you entered in the Application credentials. It is required by OAuth 2.0 to be present in the payload of claims.
picture
The picture claim contains a url for the End-User's profile picture. If you configure the picture claim to map a different claim, the value must be a url and must refer to an image file. If no picture claim is sent by the identity provider, Qlik will not attempt a mapping.
email_verified
The email_verified claim contains a boolean value confirming the user has verified their email with the identity provider. It is standard claim of OIDC, but it is not a requirement to be sent by the identity provider. This can cause problems for claims mapping with Qlik because Qlik requires the presence of an email_verified claim set to true to perform the complete claims mapping process.
Each identity provider handles email verified differently
-
Okta and Auth0 send an email_verified claim because they require End-Users to verify their email address to access the service.
-
Onelogin does not send an email_verified claim in the default payload. You will need to add a custom claim to your configuration to send the email_verified claim to Qlik, and identify the claim name in this text box for Qlik to map it.
-
Azure AD does not send an email_verified claim in their token because Azure B2B users do not have to verify their email and because the user may have the same email address for accounts in different AZure Active Directory instances, it's not possible to provide a single verification mechanism which all ADs can read from. I address handling Azure AD email_verified claim challenges in the Advanced options section.
Advanced options
For the majority of providers, there are two advanced options you can adjust. One is to specify the scopes the configuration should read from, and the other is a text box to supply a url to be navigated to when a user logs out of Qlik SaaS.
There is one special advanced option that appears if you are using Azure AD as a provider, and that is a switch for the email_verified claim. I mentioned above that Azure AD does not supply an email_verified claim in the token sent to Qlik.
You could set up a custom claim in Azure AD that sends a boolean value to Qlik. I've done it, and it's a pain. So I asked the R&D team to copy what our friends at Auth0 do and provide the switch. Once the switch is set to true, Azure AD claims map to Qlik without any issue.
Recap
So there you have it, clear as mud right? Hopefully you come away from reading this with a better understanding of the inputs for an OpenID Connect configuration with Qlik Enterprise SaaS. While filling in these inputs is straightforward, it's unfortunate that every provider out there implements OIDC differently. Along with reference links for OIDC and OAuth 2.0 below, check out the links related to configuring these different providers with Qlik.
Happy Qlikking!
References
OpenID core specification - https://openid.net/specs/openid-connect-core-1_0.html
Auth0 OpenID Connect Protocol - https://auth0.com/docs/protocols/openid-connect-protocol
OAuth 2.0 RFC - https://tools.ietf.org/html/rfc6749
OAuth 2 Simplified - https://aaronparecki.com/oauth-2-simplified/
JWT Introduction - https://jwt.io/introduction/
Qlik Enterprise SaaS Identity Provider Configuration Guides
Okta - Coming soon!
Keycloak - Coming soon!
-
Augmented Analytics with the University of Liverpool
Educator Iris Cagatay regularly invites us to run workshops with his students about Qlik and BI, but in this case, we gave a special lecture and demo ... Show MoreEducator Iris Cagatay regularly invites us to run workshops with his students about Qlik and BI, but in this case, we gave a special lecture and demo session on Augmented Analytics. These students already had knowledge of Qlik Sense having used their Qlik Sense Business access through the Academic Program, after a session we gave them last year.
After a brief refresh on Qlik and the basics of Qlik Sense, we moved on to give an overview of the ways in which some functionalities of Qlik Sense use augmented analytics. Augmented analytics is the use of enabling technologies such as machine learning and AI to assist with data preparation, insight generation and insight explanation to support how people explore and analyze data.
In Qlik Sense augmented analytics is used in features such as the Insight Adviser and Insight Adviser Chat, NL insights, associative insights, recommended association, forecasting, clustering, autoML and key driver analysis. Qlik Technical Trainer Piter Harb explained each of these use cases and then demo’ d them inside the software for the students, using a data set from one of our training courses.
After this section we moved on to how AutoML is used in Qlik Sense Enterprise, its different use cases within a business and how to create a data set that is ready for ML, before going on to demo the Automl outputs. Piter closed the session by highlighting a number of resources students can use to expand their understanding of AutoMl, we’ve included these below:
Useful Resources
- Augmented Analytics: https://www.qlik.com/us/augmented-analytics
- 9 Qlik Continuous Classroom (QCC) AutoML courses: https://learning.qlik.com/mod/page/view.php?id=24708
- AutoML Walkthrough: https://www.youtube.com/watch?v=vwAt3aH4Hec
- Qlik Help: https://help.qlik.com
- Qlik Community: https://community.qlik.com
As well as the above resources, the Qlik Academic Program provides free access to Qlik Sense Business Software and our full Qlik Continuous Classroom training to educators and students at degree issuing universities. To learn more go to qlik.com/academicprogram
-
【オンデマンド配信】生成AI どう使う?ChatGPTの機能と限界と活用事例
5月21日に実施した無料Webセミナー、「生成AI どう使う?ChatGPTの機能と限界と活用事例~ChatGPTは歯科医師国家試験に合格するのか?~」をオンデマンドでご覧いただけます。 長年の Qlik Sense ユーザーである九州歯科大学の守下准教授は、ChatGPTを使って学生の成績アップを... Show More5月21日に実施した無料Webセミナー、「生成AI どう使う?ChatGPTの機能と限界と活用事例~ChatGPTは歯科医師国家試験に合格するのか?~」をオンデマンドでご覧いただけます。
長年の Qlik Sense ユーザーである九州歯科大学の守下准教授は、ChatGPTを使って学生の成績アップを図れないかと考え、ChatGPTが学生の教育にどこまで利用できるかを国家試験問題を使って検証を行いました。結果は全問正解…だったでしょうか?
検証結果とそこから考えられる教育への応用と、生成AIの使用に対する課題をお話しいただきました。
九州歯科大学事務でのWhisper(OpenAIが文字起こしサービスとして公開した無料の音声認識モデル)を利用したDXの事例は、一般企業にとっても業務効率化のヒントになりそうです。
また、守下先生は、Qlik Sense を利用して常に医療情報データや学生の成績データを分析されています。実際の成績データの詳細分析による、勘や経験に頼らない効果的な教育カリキュラムの考案など、一般企業の人材育成にも通じる取り組みもあわせてご紹介いただきました。
動画は下記からご視聴いただけます。

-
Using Insight Advisor API in your Web App
We all know and love using Insight Advisor right within the Qlik Sense hub or inside Analytics apps, helping us analyze data, create visualizations or... Show MoreWe all know and love using Insight Advisor right within the Qlik Sense hub or inside Analytics apps, helping us analyze data, create visualizations or build data models.
In this post, we will tap into the Insight Advisor API to leverage its power within a separate web application.
We will create a simple web app that allows to ask natural language questions against our Qlik Sense app and get a recommended visualization as a response that we will then render using nebula.js
Pre-requisites:
You will need to grab the following before starting:- Qlik Cloud tenant URL
- Web Integration ID (you can get this from the Management console under Web, make sure to whitelist our localhost’s origin: http://localhost:1234)
- App Id
Installation
Run npm install to install the content of package.jsonFolder structure:
- src
- index.html (UI)
- index.js (main file)
- and cloud.engine.js (enigma.js library for engine session handling)
The following sections discuss the main parts of building the web app and calling the API, they are not in any particular order. I will provide the complete code for the project at the end of the post so you can see where everything fits.
1. Connecting to Qlik Cloud
First things first, we need to handle the authentication to Qlik Cloud.
Interactive login process:
async function getQCSHeaders() {
  await qlikLogin(); // enforce tenant login
  const response = await fetch(`${tenantUrl}/api/v1/csrf-token`, {
    mode: 'cors',
    credentials: 'include',
    headers: {
      'qlik-web-integration-id': webIntegrationId,
    },
  });

  const csrfToken = new Map(response.headers).get('qlik-csrf-token');
  return {
    'qlik-web-integration-id': webIntegrationId,
    'qlik-csrf-token': csrfToken,
  };
}

async function qlikLogin() {
  const loggedIn = await fetch(`${tenantUrl}/api/v1/users/me`, {
    mode: 'cors',
    credentials: 'include',
    headers: {
      'qlik-web-integration-id': webIntegrationId,
    },
  });
  if (loggedIn.status !== 200) {
    if (sessionStorage.getItem('tryQlikAuth') === null) {
      sessionStorage.setItem('tryQlikAuth', 1);
      window.location = `${tenantUrl}/login?qlik-web-integration-id=${webIntegrationId}&returnto=${location.href}`;
      return await new Promise((resolve) => setTimeout(resolve, 10000)); // prevents further code execution
    } else {
      sessionStorage.removeItem('tryQlikAuth');
      const message = 'Third-party cookies are not enabled in your browser settings and/or browser mode.';
      alert(message);
      throw new Error(message);
    }
  }
  sessionStorage.removeItem('tryQlikAuth');
  console.log('Logged in!');
  return true;
}
2. Communicating with the Qlik Cloud Engine
(content of the cloud.engine.js file)
We need to open a session using enigma.js to communicate with the Qlik QIX engine.
import enigma from "enigma.js";
const schema = require("enigma.js/schemas/12.1306.0.json");

export default class EngineService {
  constructor(engineUri) {
    this.engineUri = engineUri;
  }

  openEngineSession(headers) {
    const params = Object.keys(headers)
      .map((key) => `${key}=${headers[key]}`)
      .join("&");
    const session = enigma.create({
      schema,
      url: `${this.engineUri}?${params}`,
    });
    session.on("traffic:sent", (data) => console.log("sent:", data));
    session.on("traffic:received", (data) => console.log("received:", data));
    return session;
  }

  async closeEngineSession(session) {
    if (session) {
      await session.close();
      console.log("session closed");
    }
  }

  async getOpenDoc(appId, headers) {
    let session = this.openEngineSession(headers);
    let global = await session.open();

    let doc = await global.openDoc(appId);
    return doc;
  }
}
3. Including the Nebula Charts needed and rendering the recommended viz from Insight Advisor
When we eventually get back a recommendation from Insight Advisor, we will use a nebula object to embed it in our web app.
For a full list of available Nebula objects, visit: https://qlik.dev/embed/foundational-knowledge/visualizations/
We need to install “stardust” that contains the main embed function and all the nebula objects we need:
npm install @nebula.js/stardust

then install all objects needed
npm install @nebula/sn-scatter-plot
npm install @nebula/sn-bar-chart
etc...
import { embed } from '@nebula.js/stardust'; import scatterplot from '@nebula/sn-scatter-plot'; etc...Inside the rendering function, we will use stardust’s embed method to render the recommended chart type we get from Insight Advisor.
async function fetchRecommendationAndRenderChart(requestPayload) {
  // fetch recommendations for text or metadata
  const recommendations = await getRecommendation(requestPayload);

  const engineUrl = `${tenantUrl.replace('https', 'wss')}/app/${appId}`;
  // fetch rec options which has hypercubeDef
  const recommendation = recommendations.data.recAnalyses[0];
  // get csrf token
  const qcsHeaders = await getQCSHeaders();
  const engineService = new EngineService(engineUrl);
  // get openDoc handle
  const app = await engineService.getOpenDoc(appId, qcsHeaders);
  await renderHypercubeDef(app, recommendation);
}

async function renderHypercubeDef(app, recommendation) {
  const type = recommendation.chartType;

  const nebbie = embed(app, {
    types: [
      {
        name: type,
        load: async () => charts[type],
      },
    ],
  });

  document.querySelector('.curr-selections').innerHTML = '';
  (await nebbie.selections()).mount(document.querySelector('.curr-selections'));

  await nebbie.render({
    type: type,
    element: document.getElementById('chart'),
    properties: { ...recommendation.options }
});
4. Calling the Insight Advisor API for recommendations
You can either call the API with a natural language question or a set of fields and master items with an optional target analysis.
Insight Advisor API endpoints that can be called:
api/v1/apps/{appId}/insight-analyses
Returns information about supported analyses for the app's data model. Lists available analysis types, along with minimum and maximum number of dimensions, measures, and fields.api/v1/apps/{appId}/insight-analyses/model
Returns information about model used to make analysis recommendations. Lists all fields and master items in the logical model, along with an indication of the validity of the logical model if the default is not used.api/v1/apps/{appId}/insight-analyses/actions/recommend
Returns analysis recommendations in response to a natural language question, a set of fields and master items, or a set of fields and master items with an optional target analysis.
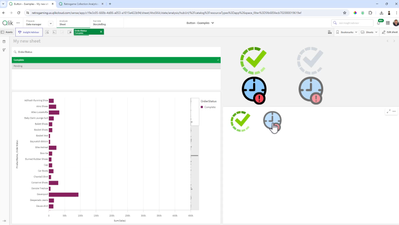
// Getting the recommendation
async function getRecommendation(requestPayload) {
  await qlikLogin(); // make sure you are logged in to your tenant
  // build url to execute recommendation call
  const endpointUrl = `${tenantUrl}/api/v1/apps/${appId}/insight-analyses/actions/recommend`;
  let data = {};
  // generate request payload
  if (requestPayload.text) {
    data = JSON.stringify({
      text: requestPayload.text,
    });
  } else if (requestPayload.fields || requestPayload.libItems) {
    data = JSON.stringify({
      fields: requestPayload.fields,
      libItems: requestPayload.libItems,
      targetAnalysis: { id: requestPayload.id },
    });
  }
  const response = await fetch(endpointUrl, {
    credentials: "include",
    mode: "cors",
    method: 'POST',
    headers,
    body: data,
  });

  const recommendationResponse = await response.json();
  return recommendationResponse;
}
Results:
For the complete example that includes calling the API with fields, master items, and a target analysis type, visit qlik.dev post: https://qlik.dev/embed/gen-ai/build-insight-advisor-web-app/
The full code for this post can be found here:
https://github.com/ouadie-limouni/insight-advisor-api
Make sure to change the variables in index.js.I hope you find this post helpful, please let me know if you have any question in the comment section below!
Ouadie -
Qlik Data Integration Client Managed May 2024 General Availability Release
As May brings Spring to a close and heralds the glimpse of summer, the days get a bit brighter and last longer. May seems full of new hope. Apart from... Show MoreAs May brings Spring to a close and heralds the glimpse of summer, the days get a bit brighter and last longer. May seems full of new hope. Apart from Star Wars Day, which always occurs on May the 4th (be with you), another galactic event that happens in May is our General Availability releases of both Qlik Replicate and Qlik Enterprise Manager.
Qlik Replicate May 2024 General Availability Release
As part of our ongoing commitment to build strong technical and commercial working relationships with your cloud platforms of choice, this release significantly improves the way we work with the likes of Snowflake, Databricks, Amazon AWS and Microsoft Azure. Here are just a few highlights.
Snowflake
Snowpipe Streaming - Qlik Replicate now supports Snowpipe Streaming, a new method for loading data into Snowflake in addition to Bulk Loading. Snowpipe Streaming can help reduce latency when replicating from source to target, as the data is streamed directly into Snowflake tables rather than staging. This method also does not require using the Snowflake warehouse, which can optimize your operating costs, depending on your use case.
Full Load enhancement – This release introduces a new way to use more files in a single copy command, resulting in faster loading times, especially with larger tables. Configuring how many files should be moved and when to time out is now possible.
Databricks
Some improvements that were added in previous service releases are now available in this GA release.
OAuth is a new authentication method supported in Databricks endpoints. It has become a popular choice for many organisations; it is useful for unattended scenarios, such as tasks running in the background without client intervention. I have written a separate blog about this if you want to read more. ( OAuth, OAuth my kingdom for OAuth )
Change Data Partitioning with Unity Catalog
Qlik Replicate added support for Databricks Unity Catlog, with the ability to divide targets into partitions. This feature was only available under a feature flag, but it is now standard in this GA release.
SAP Endpoint Enhancement
SAP continues to be a mission-critical system for many organizations. Qlik can uniquely empower your SAP data by offering several different methods of replicating SAP data and combining it with other non-SAP data.
One popular replication method for SAP HANA is Trigger-Based CDC, and this release now supports SAP HANA tables without a Primary Key (PK).
With the Transform configuration option, it is now possible to define the PK you want to use to create the triggers of the table,
We have also optimized CDC performance for the SAP HANA Trigger-Based method by introducing Commit Timestamp (CTS) over Log Table. This method is much faster and uses fewer artefacts.
From this release, CTS is now the default and recommended option for Trigger-Based CDC.
⚠️Important Note:⚠️If you are using Log Table in previous versions of Qlik Replicate, this setting will be preserved after an upgrade to the May 2024 release to prevent any existing tasks from failing.
After upgrading to this release, you can take advantage of CTS. However, to avoid data loss, follow the instructions on Qlik Help!
Please see Switching from Log Table mode to Commit Timestamp (CTS) mode
There have also been several improvements across several other endpoints, such as
- Microsoft SQL Server (MS-CDC) - Timestamp and transaction ID preservation
- PostgreSQL - capturing changes from partitioned tables
- Teradata - replicating 4-byte emoji characters
Security and Compliance
Qlik has always taken trust and security seriously, implementing security and privacy by design in our products for a long time. We offer world-class architecture and experience to confidently meet your security, compliance, and privacy needs.
FIPS Compliance – FIPS (Federal Information Processing Standards) is a set of standards developed by the United States Federal Government for computer systems, defining approved encryption algorithms for handling sensitive information. In this release, FIPS compliance is now supported as part of the standard setup routine, making it a more streamlined experience for our public sector customers.
For more information, please see Qlik Help. FIPS compliance
In addition, the following endpoints have enhanced access and authentication methods
- Amazon Kinesis -support for AWS PrivateLink
- MySQL endpoints - caching SHA-2 pluggable authentication
Qlik Enterprise Manager May 2024 General Availability Release
Enhanced API Support
We have extended the Qlik Enterprise Manager APIs with two new APIs to support adding and changing tables within specific tasks.
- GetTaskTableSelection: Receive the list of tables for a specific task.
- PutTaskTableSelection: Override the list of tables for a specific task.
All our APIs can be used as REST, .NET, and Python. More details can be found on Qlik Help. Qlik Enterprise Manager API guide
As always, each new release is fully supported for two years. To learn more, please visit the Downloads and Release Notes section on Qlik Community.
We hope you enjoy using Qlik Data Integration products. We would love to hear your feedback and success stories, especially any improvement gains you achieve.
To learn more about what is included in these releases, be sure to check out the Release notes, which are available here
To obtain any of these releases, go to the Qlik Downloads Site in the Community, filter “Product Category” by “Qlik Data Integration”, select “Latest release and patch” in “Show Releases”, and then select the product and the versions you would like to download.
If required, you can filter further by selecting the latest “Release” and/or Service Release (SR) version under “Release Number”.
For additional help in using the downloads site - watch this handy video guide here:
How-to-download-Qlik-Products -
Dissecting the Engine API - Part 5: Multiple Hypercube Dimensions
My friend, Øystein Kolsrud - Software Architect at Qlik, is back with part 5 of the Qlik Engine API fundamentals: Multiple Hypercube DimensionsPreviou... Show MoreMy friend, Øystein Kolsrud - Software Architect at Qlik, is back with part 5 of the Qlik Engine API fundamentals:
Multiple Hypercube DimensionsPrevious articles:
- Part 1: Let's Dissect the Qlik Engine API - Part 1: RPC Basics
- Part 2: Let's Dissect the Qlik Engine API - Part 2: Handles
- Part 3: Let's Dissect the Qlik Engine API - Part 3: Generic Objects
- Part 4: Let's Dissect the Qlik Engine API - Part 4: Hypercubes
With part 5 of this series Øystein will discuss some consequences of how the engine computes the data sets that hypercubes define.
Introduction
The hypercubes we have looked at so far were used to calculate multiple expressions for all values of a single field. We have seen how we in one go can compute both the sales, and the sales per month for all employees. Our next step will be to compute these statistics not only for the total set of data, but for sales per year as well. The data we have contains sales information for two different years, so if we want to calculate our expressions for a particular year, then we could simply select that year, and retrieve the data. The engine will do all the filtering for us and guarantee that only sales for the selected year is included in the hypercube computations. It is quite possible to use such a flow to iterate across the years in order to get sales information for each year, but as anyone who has ever added a table visualization to an app knows, there is a more efficient way to do this! We can simply extend the hypercube with the "Year" dimension, and have the engine do all the work for us!
How the engine deals with multiple dimensions
When the engine encounters multiple dimensions in a hypercube, it will compute the expressions for all possible combinations of values of the dimensions. Since our data contains information about sales for two employees from the years 2019 and 2020 we get the following set of four combinations:
"Amalia Craig", 2019
"Amalia Craig", 2020
"Amanda Honda", 2019
"Amanda Honda", 2020The hypercube definition we will use for our computations needs to contain two entries in the "qDimensions" array, like this:
{
  "jsonrpc": "2.0",
  "id": 21,
  "method": "SetProperties",
  "handle": 4,
  "params": [
    {
      "qInfo": {
        "qId": "3cb898dc-b7dc-44ed-ba83-c27fae5d0658",
        "qType": "myCube"
      },
      "qHyperCubeDef": {
        "qDimensions":
          [ { "qDef": { "qFieldDefs": [ "SalesRep"  ] } },
            { "qDef": { "qFieldDefs": [ "Year" ] } }
          ],
        "qMeasures":
          [ { "qDef": { "qDef": "Sum(Sales)" } },
            { "qDef": { "qDef": "Sum(Sales)/Count(Month)" } }
          ]
      }
    }
  ]
}
Now that we have added a second dimension, the resulting table will contain four columns (two dimensions, two measures), so in order to get all data, we need to set the width of the page ("qWidth") to 4:
{
  "jsonrpc": "2.0",
  "id": 22,
  "method": "GetHyperCubeData",
  "handle": 4,
  "params": [
    "/qHyperCubeDef",
    [ { "qLeft": 0,
        "qTop": 0,
        "qWidth": 4,
        "qHeight": 20
      }
    ]
  ]
}
The response will contain 4 rows with 4 cells each for a total of 16 cells (and I'll be truncating to reduce verbosity):
{
  "jsonrpc": "2.0",
  "id": 22,
  "result": {
    "qDataPages": [
      {
        "qMatrix": [
          [ { "qText": "Amalia Craig", ... },
            { "qText": "2019", ... },
            { "qText": "104480", ... },
            { "qText": "2749.4736842105", ... }
          ],
          [ { "qText": "Amalia Craig", ... },
            { "qText": "2020", ... },
            { "qText": "156662", ... },
            { "qText": "2701.0689655172", ... }
          ],
          [ { "qText": "Amanda Honda", ... },
            { "qText": "2019", ... },
            { "qText": "84396", ... },
            { "qText": "2482.2352941176", ... }
          ],
          [ { "qText": "Amanda Honda", ... },
            { "qText": "2020", ... },
            { "qText": "169293", ... },
            { "qText": "2821.55", ... }
          ]
        ],
        ...
      }
    ]
  }
}
And there you have it! The engine has computed our two expressions for both employees for both years!
The size of hypercubes
The data rows you get for a particular cube depends not only on the number of field values of the dimensions, but also on how those values relate to each other in the data model. Say for instance that "Amanda Honda" had no sales recorded for the year 2019 (perhaps because she was hired in 2020). The loaded data will then not contain any records associating "Amanda Honda" with the year "2019". When you get the data for the hypercube in this scenario, then there will only be three rows returned as the combination of the field values "Amanda Honda" and "2019" is excluded by the data.
You can check how many rows a hypercube has by looking at the property "qSize" of the hypercube layout. This is what the "GetLayout" response could look like in our case:
{
  "jsonrpc": "2.0",
  "id": 23,
  "result": {
    "qLayout": {
      "qInfo": {
        "qId": "3cb898dc-b7dc-44ed-ba83-c27fae5d0658",
        "qType": "myCube"
      },
      "qHyperCube": {
        "qSize": {
          "qcx": 4,
          "qcy": 3
        },
        "qDimensionInfo": [ ... ],
        "qMeasureInfo": [ ... ],
        ...
      }
    }
  }
}
The "qSize" property indicates both the number of columns ("qcx") and the number of rows ("qcy").
Excluded combinations
One might think that there should be a row generated also for combinations that do not have values. After all, one could without lying say that the sales for "Amanda Honda" in 2019 was 0. But this is not how the engine works! And that is a good thing! If the engine didn't do this type of filtering, then most cubes would result in such a large number of rows that they would be completely unusable. Consider for example that all sales transactions had both a timestamp and a unique ID associated with them. Then we create a hypercube that lists the timestamp, the ID, and the sales amount for each transaction represented in 1000 USD. We could define our cube like this:
"qHyperCubeDef": {

  "qDimensions":

    [ { "qDef": { "qFieldDefs": [ "Timestamp"  ] } },

      { "qDef": { "qFieldDefs": [ "ID" ] } }

    ],

  "qMeasures":

    [ { "qDef": { "qDef": "Sales/1000" } } ]

}
The number of rows this cube would yield would be equal to the number of IDs, as there is exactly one timestamp associated with each ID. Also, in this case it clearly makes no sense to return rows that show the sales for nonexistent combinations of "Timestamp" and "ID". In fact, if we did, then we would soon run into trouble. Imagine that there are 10 IDs. The resulting table would in that case contain 10*10=100 rows (if we assume that the timestamps are unique as well). If there were 1000 IDs then there would be a million rows. And if there were a million IDs then you'd better dive for cover and hope you don't bring down the entire engine when you try to compute the layout! Because the resulting number of rows would be astronomical!
It's good to be aware of this engine behavior as there are in fact cases where you risk creating such huge cubes. I have accidentally done so myself on several occasions. And I can tell you, it's not a good thing... The problem occurs when you add two fields to a cube that have no association to each other what so ever. A company could for instance have data for both sales and purchases, both of which have unique ID's, but are stored in different tables. Then I create a table visualization with timestamp and ID, but accidentally choose the ID from the "Purchases" table instead of from the "Sales" table like this:
"qHyperCubeDef": {

  "qDimensions":

    [ { "qDef": { "qFieldDefs": [ "Sales.Timestamp"  ] } },

      { "qDef": { "qFieldDefs": [ "Purchases.ID" ] } }

    ],

  "qMeasures":

    [ { "qDef": { "qDef": "Sales.Sales/1000" } } ]

}
Since all possible combinations of "Sales.Timestamp" and "Purchases.ID" are legal, this is likely to give me a hypercube of a rather intimidating size.
Summary
Hypercubes with multiple dimensions is a very common thing in Qlik Sense. Apart from the obvious example of a table visualization, most other visualizations allow for some form of multiple dimension configuration as well. Two examples that I frequently use are the bar chart and line chart visualizations, both of which will have cubes with multiple dimensions under certain configurations.
The handling of hypercubes is at the very core of how the engine deals with computations, but there are of course limits to what the engine can handle. If you run into surprisingly long computation times or very high engine memory usage, then be on the lookout for visualizations that accidentally span very large sets of field value combinations. Such cubes can sometimes give you nasty surprises.

-
Do..Loop
The do..loop control statement is used in the script to iterate through one or more statements until a condition is met. It is useful when you need t... Show MoreThe do..loop control statement is used in the script to iterate through one or more statements until a condition is met. It is useful when you need to dynamically check a condition while executing statements in the script. There are two ways the do..loop can be used. The first is to check the condition before executing statement(s) in the loop and the second is to check the condition after the statement(s) in the loop have been executed. Let’s look at some examples.
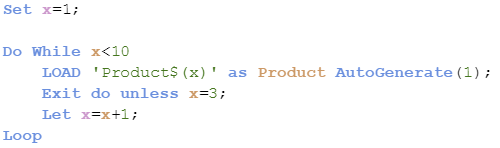
The script below checks to see if the condition has been met before the statements are executed. When x is no longer less than 10, the do..loop will stop.
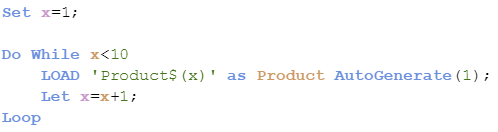
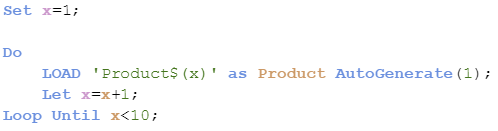
The script below is a little different. In this script, the condition is checked after the statements are executed so the statements will always run at least one time.
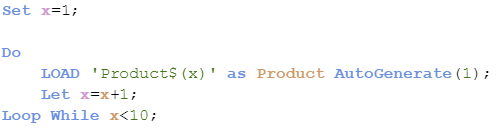
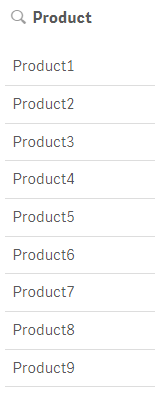
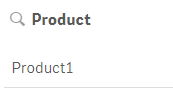
Both scripts produce the same results as seen below. Products 1 through 9 were created.
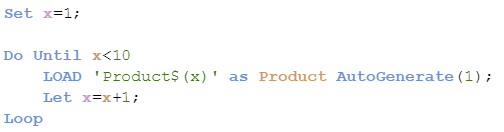
The do..loop also can be used with the “Until” keyword instead of the “While” keyword producing different results. In the script below, the statements will be executed until x is less than 10. Since x is equal to 1 which is less than 10, the statements never run so no products are generated.
Now if the condition is checked after the statements are run, as shown in the script below, one product will be created since the statements run once before the condition is checked.
Now what if you need to exit the do..loop. You can do this using Exit do. The loop will be exited and execution will continue with the statement(s) following the loop. Here is an example of what this looks like. In the script below, the loop will exit after the Load statement runs 3 times, stopping when x is equal to 3.

In the script below, this loop will exit after the Load statement executes one time. Since x is not equal to 3, the loop will be exited when execution gets to the exit do statement.
The do..loop is helpful in the script when you need to execute statements while /until a condition is met. It provides flexibility since the condition can be dynamic and be evaluated before or after the statement(s) in the loop. This is a little different from the For..Next loop where a counter is used to determine the number of times the statement(s) in the loop are executed. Learn more about loops in Henric’s blog Loops in the Script.
Thanks,
Jennell
-
May Qlik Digest
Welcome to the May Qlik Digest featuring a rockin’ party at Qlik Connect, upcoming webinars, exciting learning promotions, and more! 3 reasons that... Show MoreWelcome to the May Qlik Digest featuring a rockin’ party at Qlik Connect, upcoming webinars, exciting learning promotions, and more!
3 reasons that’ll give you FOMO.
1. Customer Lightening Round
A quick, fun, and energetic exploration into how successful global brands have conquered unique business challenges and found the opportunities in their data.
Featuring Qlik customers: Penske Transportation Solutions: Sarvant “Rana” Singh, VP, Data & Emerging Technologies; and Anthony Arana, Director, Data Engineering and Business Intelligence
Vanguard: Glenn Wilkins, Sr. Enterprise Architect
Takeuchi: Susan Dean, Director of Business Technology
Genentech: Prashant Sahay, Analytics Director Technology
2. Qlik Ecosystem Discussion
Learn how to kick your data journey into high gear. Katie Linendoll and our strategic partners, AWS and Accenture, discuss how partner expertise enhances Qlik deployment
3. Data. Analytics. AI. And rides.
Are you registered for Qlik Connect? Beyond over 100 breakout sessions, 30+ certifications, and 60+ areas to explore on the show floor, you need to get ready for one of the biggest parties Qlik has ever thrown. We’ve reserved areas of Universal Islands of Adventure theme park just for you. Featuring themed lands and cutting-edge rides, Islands of Adventure promises excitement around every .
June 5 • 7:00 PM - 10:00 PM
New Qlik Learning Promotions!
Sometimes your work can’t wait for an upcoming class with in-person training. That’s why there’s the Qlik Continuous Classroom, our self-paced learning platform. It allows you to catch up on courses and assessments that match your role, style, and schedule. Redeem code SELFPACED20 for 20% off Qlik Continuous Classroom subscriptions. Explore the catalog here.
Or if you prefer traditional classroom training, where one of our expert instructors offers demonstrations and hands-on exercises, we are offering a discounted rate of 30% with code CLASSROOM30 on all public courses.
Use our course catalogue to find the right training course(s) for you.
Act fast, these codes expire on June 30th.
Look out for a new Qlik Learning experience!
Qlik has joined forces with Talend to bring you the very best of data analytics and integration, and now we're doing the same with your learning experience. Our new, integrated learning platform combines the best of both worlds, providing you with a one-stop-shop for all your training .
Take a moment to watch this sneak peek.
Do More with Qlik: Qlik Cloud Analytics Recap and Getting Started
May 29, 2024, at 10:00am EDT
Join Mike Tarallo, as he shows you how to quickly get started with Qlik Cloud. Mike will explain exactly what makes Qlik Sense the next-generation data exploration and visualization software, and make it easy for you to take action today.
Join Our Customer Survey: We Value Your Feedback!
We're excited to announce that we launched our semi-annual customer survey on May 27! This is your opportunity to share your thoughts and experiences with us, helping us better understand your needs and preferences.
If you haven’t already, make sure to check your inbox for our survey invitation!
-
BMW & Layout Container
BMW & Layout ContainerJOIN DATATesting layout container features.DiscoveriesNew possibilities with layout container featureImpactNew design to catch i... Show MoreBMW & Layout ContainerJOIN DATATesting layout container features.Discoveries
New possibilities with layout container feature
Impact
New design to catch insights
Audience
Developers
Data and advanced analytics
Design only
-
-
Get discounted trainings and subscriptions!
Have you heard the news? Qlik Learning has launched a super exciting deal for you: Get a big 30% discount on public training courses (discount coupon... Show MoreHave you heard the news?
Qlik Learning has launched a super exciting deal for you:
- Get a big 30% discount on public training courses (discount coupon: CLASSROOM30)
- and a cool 20% off on Qlik Continuous Classroom subscriptions (discount coupon: SELFPACED20).
And guess what? We've made it super easy for you to grab these amazing deals - just use the discount coupons on our website and let the savings begin!
But you need to hurry... Coupons must be redeemed by June 30th!
Happy Learning!
-
Switch Control Statement
The switch control statement is one of many controls statement that can used to determine the flow of the script. In Qlik Sense help, it is defined a... Show MoreThe switch control statement is one of many controls statement that can used to determine the flow of the script. In Qlik Sense help, it is defined as:
The switch control statement is a script selection construct forcing the script execution to follow different paths, depending on the value of an expression.
Syntax:
Switch expression {case valuelist [ statements ]} [default statements] end switch
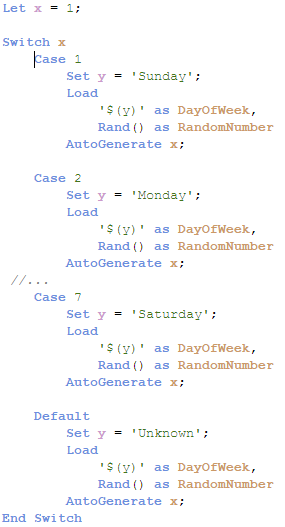
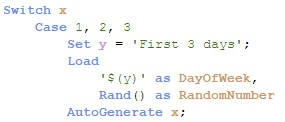
The switch control statement can be used in the script to identify a specific execution path. With the switch control statement, several paths can be defined and a default path can be defined as well when no match is found in the case clause. The various script paths cannot cross – they should be individual paths that do not overlap. In the script below, the expression x will be compared to each case. When there is a match, the script for that case will be executed.
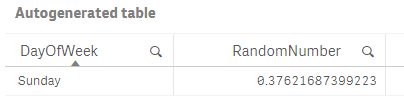
In the example below, Case 1 will be executed – the variable y will be set to Sunday and one record will be generated in the table.
Below is a look at the record generated.
It is also possible to have more than one value for a case, for instance, you can use the script below to run the same script if x matches 1, 2 or 3.
When faced with various script execution paths, try using the switch control statement. While I rarely have a need to use it, I like how neat and straight-forward the syntax is. I have attached an example Qlik Sense app with the full script for you to test out for yourself.
Thanks,
Jennell
-
Watch Q&A with Qlik: Qlik Cloud Data Integration!
Don't miss our previous Q&A with Qlik! Hear from our panel of experts to help you get the most out of your Qlik experience. See the recording here... Show MoreDon't miss our previous Q&A with Qlik! Hear from our panel of experts to help you get the most out of your Qlik experience.
Our experts offered answers and creative solutions to your Qlik Cloud Data Integration questions.

-
Qlik Cloud 4月の新機能
分析の新機能 サイクリック軸 マスターアイテムでサイクリック軸を作成できるようになりました。アイコンをクリックして軸を切り替えることができます。 QVS ファイルによる再利用可能なロードスクリプト ロードスクリプトを QVS ファイルとして保存できるようになりました。QVS ファイルをQlik... Show More分析の新機能
サイクリック軸
マスターアイテムでサイクリック軸を作成できるようになりました。アイコンをクリックして軸を切り替えることができます。
QVS ファイルによる再利用可能なロードスクリプト
ロードスクリプトを QVS ファイルとして保存できるようになりました。QVS ファイルをQlik Cloud にアップロードしたり Web ストレージに格納しておき、ロードスクリプトに挿入することができます。QVS は QVS ビューアで参照することができます。よく使用される処理をQVSファイルにし、再利用することで開発効率を上げることができます。
Help: QVSファイルを使用した再利用可能なロード スクリプトの作成
ボタンアクションの実行時評価オプション
ボタンに複数のアクションを設定する場合のオプションが追加されました。アクションは上から順次実行されますが、実行時間の評価オプションをオフにすると、アクションに設定された数式はそれぞれ独立して評価されます。オンにすると、アクションが実行されるタイミングで数式が評価されます。
Visualization bundle テーブルの改善
- ストレート テーブルの列をより狭くできるようになりました。
- ピボット テーブルには、メジャーの書式設定、テキストの配置、軸の制限が追加されました。
- ストレート テーブル、ピボットテーブルの双方にリンクを表示できるようになりました。
チャートの背景色の不透明度の指定
チャートの背景色の透明度を指定できるようになりました。背景色に「単色」を設定して色を選択し、スライダーで透明度を指定することができます。シートの画像を透かして見せたり、オブジェクトを重ね表示する際に使用することができます。また、16進数のカラーコードは#の有無にかかわらず貼り付けることができるようになっています。
データ統合の新機能
変換フローデザイナー
変換タスクで、フローデザイナーによって変換処理を定義することができるようになりました。SQLを書かずにドラッグアンドドロップの操作で変換処理を作成できます。フローは SQL ステートメントに変換され、実行時に選択したデータ プラットフォームにプッシュされます。
SAP ODP コネクタ
SAP ODP コネクタがリリースされました。SAP ODP フレームワークへ接続し、Extractors、CDS ビュー、BW オブジェクト、SAP HANA Information View などの複数のタイプのデータアーティファクトからのデータキャプチャができます。
前提条件:
- Data Movement ゲートウェイ サーバーに、必要なSAP Java Connectorをインストールする
- データソースに必要な権限を付与する
- データソースのコネクタを構成する
選択したテーブルのリロード
変換タスクやデータマートタスクなどのほとんどのデータタスクで、選択したテーブルを手動でリロードできるようになりました。エラー発生時の回復や、個別のテーブルの更新に便利です。タスクの監視画面の下部で、テーブルを選択して「テーブルをリロード」をクリックします。
その他
- Anthropic (Amazon Bedrock) 分析コネクタに Claude 3 Sonnet と Haiku のサポートが追加されました。
- PostgreSQL または Microsoft SQL Server (MS-CDC を使用) をデータ ソースとして使用する場合にDDL 変更をキャプチャできるようになりました。
- SAP アプリケーション コネクタのバックエンド データベースとして SAP HANA が追加されました。
管理者向けの新機能
カスタムセキュリティロール
- 特定の権限を持つカスタマイズされたロールを作成し、個人またはグループに対して権限を付与することができます。
- 初期リリースではExcelへのデータエクスポートについての権限のみですが、今後拡張予定です。
- User Default(既定のロール)で許可された権限を、カスタムルールで制限することはできません。
- スペースでの権限よりカスタムロールが優先して適用されます。
Capacity model の Basic User に Excel エクスポートの権限を与えることはできますが、スペース毎にエクスポートの許可・不許可をコントロールすることはできません。
ゲートウェイー直接アクセス
Direct Access gateway 1.6.5 がリリースされました。
新機能
- SAP ODP コネクタのサポート
- Qlik のサポートがトラブルシューティングするための新しいログの導入
- 日本リージョンのサポート
- 暗号化セッションのメモリ割り当ての改善によるパフォーマンスの向上
解決された問題
- セキュリティの脆弱性
- プロセス分離のパフォーマンス
- 誤ったインストール パス
テナント全体のホームのカスタマイズ
テナント管理者と分析管理者は、全てのユーザーのログイン時に表示されるホーム画面を作成することができます。管理者でない各ユーザーは自分の個人ページをカスタマイズできます。
Help: Qlik Cloud 分析 ハブのテナント全体のホーム ページのカスタマイズ
その他
- パフォーマンス評価が完了または失敗したときに、通知を受け取るように選択できます。
- ODBC ベースの Qlik DynamoDB コネクタが追加されました。以前の JDBC ベースの Qlik DynamoDB コネクタ(英語のみ)は、2024 年 7 月末まで引き続きサポートされます。
- Microsoft 365 のメールプロバイダにOauth 2.0 接続が行えるようになりました。
-
クラウドの上で
本ブログは On Top of the Cloud (著者:James Fisher)の翻訳です。 Qlik では、お客様のクラウド分析の採用を支援するジャーニーにおいて、私たち自身の”山頂”に到達しました。2022年に到達したモーメンタムは、それ自体が信じられないほど充実した経験でした。Qlik ... Show More本ブログは On Top of the Cloud (著者:James Fisher)の翻訳です。
Qlik では、お客様のクラウド分析の採用を支援するジャーニーにおいて、私たち自身の”山頂”に到達しました。2022年に到達したモーメンタムは、それ自体が信じられないほど充実した経験でした。Qlik Cloud のアクティブユーザーが 400% 近く増加し、1日で作成されたアプリの数は 1,500以上に達しました。
グローバルホームセンター小売業者の Leroy Merlin 社は、Qlik Cloud のフルパワーを活用して、店舗の従業員を含む何千人ものユーザーに実用的な分析を提供している、このクラウドジャーニーの最前線にいるお客様の 1社です。分析をオンプレミスからクラウドに移行することで、サーバーとハードウェアのコストを 70% 削減することができました。グローバル小売業者の Urban Outfitters 社は、Qlik Cloud を積極的に採用しています。これにより、すべての店舗従業員が個々の店舗の KPI のあらゆる側面に関する最新のデータを取得し、それらの洞察に基づいてすぐに行動することができます。
Qlik Cloud は、クラウドが提供する規模とコスト効率だけでなく、新しい機能を活用し、データ管理方法を革新し、最終的にビジネスのためにより良い、より迅速な決定を下すことができるため、世界中の組織における大きな価値の獲得を支援しています。今日、トップ 10 の顧客のうち 8社が Qlik Application Automation でデータと分析のワークフローを自動化し、Salesforce、Slack、Microsoft Teams などの一般的な SaaS アプリケーションに接続できる分析用のデータパイプラインを作成しています。分析用のデータパイプラインを流れるデータを完全に理解するのに役立つカタログとデータ系統機能のユーザー数は増え続けています。そして、Qlik Cloud に導入された強力な予測分析ソリューションである Qlik AutoML の導入も進んでいます。
Leroy Merlin 社を含む多くのお客様は、Qlik Cloud に移行する前に、クライアント管理の Qlik Sense または QlikView を使用していました。Qilk では顧客をサポートし、自社のペースで Qlik Cloud を採用できるように、リソース、ツール、ベストプラクティスの豊富なライブラリを提供するマイグレーションセンターを用意しています。
太陽はゆっくりと沈み始めていますが、私たちはこの山頂から降りるつもりはありません。Qlik Cloud で新しいデータ統合機能を開始しているからです。Qlik Cloud データ統合 は、自動化され、効率的で管理されたデータパイプラインを介して、分析およびデータエンジニアが企業品質のデータを統一、変換、配信するのに役立つように設計されています。当社のソリューションは、データの発信元やフォーマットに関係なく、共通のクラウドサービスを活用して、データの検索、操作、管理を容易にしながら、ほぼリアルタイムで、適切な送信先、適切なフォーマットで安全な配信を保証します。
また、より多くの組織が Qlik Cloud を採用できるように、セキュリティとコンプライアンスを強化しています。
-
米国公共部門の顧客向けに、Qlik Cloud Government では FedRAMP 認証を取得しています。Qlik は、このFedRAMP 認証を達成する唯一の包括的な Software-as-a-Service(SaaS)データ分析プラットフォームです。
-
私たちは、ヨーロッパの自動車産業に情報セキュリティシステムに対する一貫した標準化されたアプローチを提供する標準である Trust Information Security Assessment Exchange(TISAX) 評価を完了しています。
-
厳格な暗号化とガバナンス要件を持つ組織の場合、Customer Managed Keys を使用すると、Qlik Cloud でデータを保護するために独自の暗号化キーを持参できます。
-
HIPAA/HITRUST コンプライアンスにより、米国の HIPAA 規制要件の対象となる米国のヘルスケアおよびライフサイエンス組織は、プラットフォーム内で個人健康情報(PHI)データを使用する機能を含む Qlik Cloud の可能性を最大限に活用できるようになります。
- Qlik Cloud では日本リージョンを開設しています。これにより日本国内のお客様にデータレジデンシーによる経済的安全保障をご提供します。
また、Qlik Cloud にさらなる機能強化を導入しています。当社のレポート機能はパワーポイント出力をサポートし、ビジネスユーザーは目的の分析でプレゼンテーション対応機能を作成できます。また、OEM ISV パートナーとエンタープライズ顧客の両方に Qlik Cloud でマルチテナントプロビジョニングを提供しています。これにより、テナントの作成、構成、継続的なコンテンツハイドレーションなど、柔軟なクラウド API キーのオンボーディングとメンテナンスタスクを自動化する機能が提供されます。
Qlik Cloudは、組織が新しい機能を活用し、データの管理方法を革新し、最終的により良い迅速な意思決定を行うのを支援しています。
-
-
Football_app
Football_appHapag-LloydI did this app not for work obviously. It shows some football stats, but with focus on how the fact if game was played on home ... Show MoreFootball_appHapag-LloydI did this app not for work obviously. It shows some football stats, but with focus on how the fact if game was played on home stadium or away impacted the statistics(like goals, shots, ball possession etc)Discoveries
If team plays game at home, they score more, and win the games more often
Impact
It didn't, I did it just for myself 🙂
Audience
I showed it just to my Professor at my Business Informatics studies and my colleagues from the group. They liked it.
Data and advanced analytics
I used alternate states for it, to enable on one side of the dashboard to select games played at home, and on the second side games played away.