Unlock a world of possibilities! Login now and discover the exclusive benefits awaiting you.
Analytics & AI
Forums for Qlik Analytic solutions. Ask questions, join discussions, find solutions, and access documentation and resources.
Data Integration & Quality
Forums for Qlik Data Integration solutions. Ask questions, join discussions, find solutions, and access documentation and resources
Explore Qlik Gallery
Qlik Gallery is meant to encourage Qlikkies everywhere to share their progress – from a first Qlik app – to a favorite Qlik app – and everything in-between.
Qlik Community
Get started on Qlik Community, find How-To documents, and join general non-product related discussions.
Qlik Resources
Direct links to other resources within the Qlik ecosystem. We suggest you bookmark this page.
Qlik Academic Program
Qlik gives qualified university students, educators, and researchers free Qlik software and resources to prepare students for the data-driven workplace.
Recent Blog Posts
-
Enhance your AI Skills with a Free Qlik Learning Live Webinar!
Imagine completely transforming the way you work with your data using the power of Artificial Intelligence (AI) in Qlik. Since 2018, we have been addi... Show MoreImagine completely transforming the way you work with your data using the power of Artificial Intelligence (AI) in Qlik. Since 2018, we have been adding features to help our users get the most value from their data.
After all these years, one thing is clear: this is just the beginning!
Don't want to fall behind but not sure where to start?
Join the Qlik Education Team for a special 90-minute webinar session on July 9th at 10:00 AM EST/4:00 PM CEST; that will provide a deep dive into the world of Artificial Intelligence and explore the Augmented Analytics Capabilities in Qlik Sense.
What You'll Learn in This 90-Minute Webinar:
- Fundamentals of Artificial Intelligence (AI): Understand the basics and different types of AI.
- Insight Advisor: Discover its conversational capabilities to enhance your application use.
- AutoML: Learn how it uses historical data to predict future outcomes through classification and regression algorithms.
- Qlik Cloud Analytics and Large Language Models (LLMs): See how Qlik can help you leverage their power.
We have prepared a wealth of valuable content for you, and we’re excited to help you elevate your data analysis skills to the next level.
REGISTER now to secure your spot as spaces are limited.
Don’t miss out on this FREE opportunity!
We look forward to seeing you there!
-
More on qlik-embed: Charts on the Fly and OAuth Impersonation
In the last couple of posts, we explored qlik-embed, Qlik’s new library for embedding Qlik Sense analytics into web applications, and went over how to... Show MoreIn the last couple of posts, we explored qlik-embed, Qlik’s new library for embedding Qlik Sense analytics into web applications, and went over how to do silent authentication with OAuth. Since then, the library has seen some updates, and today, we’ll delve into a new feature that allows to embed charts that are created on the fly as well as look into how to handle anonymous access using OAuth impersonation.
-
What’s New in qlik-embed?
Charts on the Fly
One of the features that standout in the newest qlik-embed release is "charts on the fly." This allows you to create charts dynamically from data within a Qlik Sense app without needing the chart to pre-exist in the app itself.
Instead, you pass a chart definition including dimensions, measures, and chart properties, and qlik-embed generates it on the fly in your web app.
Here’s a quick example using qlik-embed web components:
<!DOCTYPE html>
<html lang="en">

<head>
    <meta charset="UTF-8" />
    <meta name="viewport" content="width=device-width, initial-scale=1.0" />
    <meta http-equiv="X-UA-Compatible" content="ie=edge" />
    <style>
        .container {
            padding: 8px;
            gap: 8px;
            position: relative;
            flex: 1 0 auto;
            display: flex;
            flex-direction: column;
            align-items: stretch;
            box-sizing: border-box;
        }

        .viz {
            width: 600px;
            height: 600px;
            padding: 16px;
            border: 1px solid #bbb;
            border-radius: 3px;
            box-shadow: 1px 1px 10px rgba(0, 0, 0, 0.2);
            position: relative;
        }
    </style>
    <title>@qlik/embed-web-components example - using OAuth</title>
    <script crossorigin="anonymous" type="application/javascript"
        src="https://cdn.jsdelivr.net/npm/@qlik/embed-web-components@1/dist/index.min.js"
        data-host="<YOUR TENANT>" data-client-id="<CLIENT ID>"
        data-redirect-uri="https://localhost:3000/index_oauth_object.html" data-access-token-storage="session"></script>
</head>

<body>
    <div id="main-app">
        <div class="container">
            <h1>@qlik/embed-web-components Example</h1>
        </div>
        <div id="analytics-chart" class="container">
            <h2>"qlik-embed" <em>analytics-chart</em> embedding chart on the fly.</h2>
            <div class="viz">
                <qlik-embed id="visualization" ui="analytics/chart" app-id="<THE APP ID>"
                    type="barchart" dimensions='["Type", "Experience"]' measures='["Count([Demo ID])"]'
                    properties='{ orientation: "horizontal", barGrouping: { grouping: "stacked" } }'
                    context___json='{ theme: "Breeze", interactions: { select: false } }'></qlik-embed>

            </div>
        </div>
</body>

</html>
This feature is particularly powerful for creating highly dynamic and responsive dashboards where the visualizations can adapt to the user's needs in real time. However, keep in mind that "charts on the fly" is currently limited to the chart types available in the analytics/chart UI within qlik-embed. You can refer to the chart compatibility table for the most up-to-date information.
Notice that you can now pass context using the context___json (triple underscores (
___)) to apply a specific theme etc..For instance:
<qlik-embed context___json='{ theme: "Breeze" }' ... />-
Understanding OAuth Impersonation
OAuth impersonation tokens in Qlik Cloud are a game-changer for web applications needing to access resources on behalf of users, especially when dealing with different identity providers. This method replaces the need for third-party cookies with OAuth tokens to maintain state, significantly improving security and user experience.
Things to keep in mind when using OAuth Impersonation:
- Do Not Expose Machine-to-Machine Clients on the Frontend: keep your client secrets in the backend.
- Use a Backend Web Application for Token Issuance: Create an endpoint in your backend application to issue tokens.
- Explicitly Set Scopes on Impersonation Tokens: Ensure your tokens have the minimal required scopes to enhance security.
Here’s an example snippet for issuing impersonation tokens using the @qlik/api library:
import { auth as qlikAuth, users as qlikUsers } from "@qlik/api";

const qlikConfig = {
  authType: "oauth2",
  host: "https://tenantName.region.qlikcloud.com",
  clientId: "OAuth impersonation client Id",
  clientSecret: "OAuth impersonation client secret",
};

//set the host configuration to talk to Qlik tenant
qlikAuth.setDefaultHostConfig(qlikConfig);

//access token method the frontend will call
app.post("/access-token", requiresAuth(), async (req, res) => {
  const userId = req.session?.user?.id;
  try {
    //call to Qlik Cloud tenant to obtain an access token
    const accessToken = await qlikAuth.getAccessToken({
      hostConfig: {
        ...qlikConfig,
        userId,
        noCache: true,
      },
    });
    console.log("I got an access token!");
    //access token returned to front end
    res.send(accessToken);
  } catch (err) {
    console.log(err);
    res.status(401).send("No access");
  }
});
Or using the fetch API:const hostConfig = { host: "https://tenantName.region.qlikcloud.com", }; const payload = { client_id: "OAuth impersonation client Id", client_secret: "OAuth impersonation client secret", grant_type: "urn:qlik:oauth:user-impersonation", user_lookup: { field: "subject", value: "SUBJECT_VALUE", }, scope: "user_default", }; async function getAccessToken(hostConfig, payload) { const getToken = await fetch(`${hostConfig.host}/oauth/token`, { method: "POST", mode: "cors", credentials: "include", headers: { "Content-Type": "application/json", }, body: JSON.stringify(payload), }); const response = await getToken.json(); //console.log(response); return response; } (async () => { await getAccessToken(hostConfig, payload); })();Once you have the backend that generates the access token built, you can access it on the frontend in the qlik-embed library by using the "data-get-access-token" attribute and passing it the name of the function that calls your access token backend API endpoint, like this:
    <script crossorigin="anonymous" type="application/javascript"
        src="https://cdn.jsdelivr.net/npm/@qlik/embed-web-components@1/dist/index.min.js"
        data-host="<YOUR TENANT>" data-client-id="<YOUR CLIENT ID>"
        data-get-access-token="getAccessToken" data-auth-type="Oauth2"></script>

    <script>
        async function getAccessToken() {
            const response = await fetch("<BACKEND API URL>/access-token", {
                method: "POST",
                credentials: "include",
                redirect: "follow",
                mode: "cors"
            });
            if (response.status === 200) {
                const tokenResp = await response.json();
                const accessToken = tokenResp.access_token;
                return accessToken;
            }
            const err = new Error("Unexpected serverside authentication error");
            err.status = response.status;
            err.detail;
            throw err;
        }
    </script>
You can visit qlik.dev for more information about authentication concepts.
The qlik-embed library continues to evolve, bringing powerful new features and enhanced security capabilities to the table. Whether you're creating dynamic visualizations on the fly or implementing different auth methods, qlik-embed provides the tools needed for bring Qlik analytics into your web applications.
-
-
Talend Data Catalog 8.1 is Here!
Talend Data Catalog 8.1 is Here! Author(s): Don Pinto & Christophe Toum Effective data governance hinges on rich metadata from diverse sources, provid... Show MoreTalend Data Catalog 8.1 is Here!
Author(s): Don Pinto & Christophe Toum
Effective data governance hinges on rich metadata from diverse sources, providing context and enabling easy discovery of siloed assets. Managing this metadata is crucial for understanding data origins, changes, and access control. Without it, companies struggle with data quality, productivity, and compliance.
Building on the success of previous versions, Talend Data Catalog (TDC) 8.1, released in May 2024, effectively addresses these challenges. Here are a few top-level TDC 8.1 release highlights:-
- Enhanced metadata bridges mean that with TDC 8.1, you can start harvesting metadata from even more sources including dbt (core and cloud), Couchbase, Databricks, Unity Catalog and Spark notebooks, GraphQL, Snowflake access history, and more. This enables you to discover data across various sources - regardless of where it’s stored.
- Business Process Model and Notation (BPMN) standard support means that with Talend Data Catalog 8.1, you can create standardized process models that are easier to understand and collaborate on, and seamlessly integrate with third-party applications like Lucidchart.
- Improved data documentation and mapping brings better user experience for editing descriptions, comments, and issues with the HTML-based editor, the ability to creating semantic mappings linked with business glossary terms. As a result, the data models are more accurate, understandable, and trustworthy for everyone in the organization.
- More scalable search is powered by Solr - instead of a Lucene index, and the worksheets capability revolutionizes how you find and organize information. This capability significantly enhances and scales data discovery, especially for larger datasets, boosting productivity for governance stakeholders.
Now, we have just shared a few key capabilities of the release, but if you want to dive deeper, you can find the official release notes here.
For on-premise TDC 8.0 deployments, now is the time to upgrade. For customers using the managed cloud version of TDC 8.0, we are planning to schedule a migration to TDC 8.1 before the end of year 2024, and customers will be notified prior to this migration. Customers with a current TDC 8.0 subscription can get TDC 8.1 without additional cost. To help you realize these benefits as quickly as possible, reach out to your Qlik contact to engage and kick-start your TDC migration.
- Enhanced metadata bridges mean that with TDC 8.1, you can start harvesting metadata from even more sources including dbt (core and cloud), Couchbase, Databricks, Unity Catalog and Spark notebooks, GraphQL, Snowflake access history, and more. This enables you to discover data across various sources - regardless of where it’s stored.
-
Qlik のデータ統合と品質ビジネスにとって決定的な年
本ブログは"A Monumental Year for Qlik’s Data Integration and Quality Business"の翻訳です。 著者:Drew Clark データ統合の分野では昨年、巨額の買収や噂など、さまざまな紆余曲折がありましたが、ChatGPT やその他の大規模... Show More本ブログは"A Monumental Year for Qlik’s Data Integration and Quality Business"の翻訳です。
著者:Drew Clark
データ統合の分野では昨年、巨額の買収や噂など、さまざまな紆余曲折がありましたが、ChatGPT やその他の大規模言語モデルの登場ほど、地殻変動をもたらすインパクトが大きいものはありませんでした。AI は主流となり、私がお話をしてきたほぼすべての企業が、競争優位のために戦略的に AI 導入を進めています。
さらに、私はすべてのお客様に、「AI の成功は、正確でタイムリーかつ高品質なデータを、すぐに利用できる形式で用意できているかにかかっています」と伝えています。この哲学は、今年の Qlik Connect で私が発表したすべての製品開発における指針です。お話しすべき製品のリストは長くなりますが、まずは Qlik Talend Cloud から始めましょう。
Qlik Talend Cloud ビジョンの紹介
Qlik Talend Cloud は、Talend と組み合わせた初のサービスであり、私たちのジャーニーにおける極めて重要なステップです。将来の SaaS データ統合、品質、AI イノベーションの舞台を整えるだけでなく、最先端のソリューションを提供するという当社のコミットメントを体現しています。万を超えるテナント、複数の地域、10以上の認定を持つ Qlik Cloud インフラストラクチャを基盤とするこのプラットフォームは、当社の新たなイノベーションの道標としての役割を果たします。さらに、Talend Cloud の機能も時間をかけて移行していきます。
Qlik Talend Cloud の導入により、私たちは市場にイノベーションのビッグウェーブをもたらします。この新しいプラットフォームは、信頼できるデータ資産を組織全体に提供する、AI を活用した ELT パイプラインをノーコードで迅速に構築・展開することを可能にします。それでは、データ統合と品質プロセスに具体的なメリットをもたらす Qlik Talend Cloud の機能と主要テーマを掘り下げてみましょう。
革新的なデータ製品 - データ製品は、高度にキュレートされた、信頼できる、再利用可能なデータ資産であり、データ生産者と消費者の間のギャップを安全に埋めるものです。これらのデータセット、ビジネスで承認されたメタデータ、およびドメインロジックのコレクションは、レコメンデーションエンジン、予測機械学習、ビジネスアナリティクス、および生成 AI のような強力なデータアプリケーションのバックボーンを形成します。
キュレートされたデータマーケットプレイス - 私たちのデータ製品ビジョンのもう一つの要素は、データ製品のコラボレーションと消費を促進するデータマーケットプレイスを提供することです。マーケットプレイスに自然言語検索を導入することで、データ製品の発見、理解、共有を極めて直感的かつ容易にすることを想定しています。
モダンデータエンジニアリング - データパイプラインと変換ロジックを定義するための当社独自のノーコード/プロコードアプローチも飛躍的な進歩を遂げました。組み込まれた AI 技術のおかげで、コネクタファクトリーは大幅にアップグレードされ、現在では 170以上の SaaS データソースをサポートし、毎月さらに多くのソースをリリースしています。ちなみに、必要なデータソースコネクタが見つからない場合は、こちらからリクエストしてください。
また、Stitch Data の SaaS データロード技術を Qlik Talend Cloud に組み込みました。新しい Starter Package は、SaaS データをデータウェアハウスにロードしたいお客様に最適です。Starter Packageの素晴らしい点は、SAP 接続、データ変換、データ製品などのより高度な機能へのシームレスなパスも提供されることです。今年後半に Qlik Talend Cloud Starter Package やその他のエディションが発売される予定なのでお楽しみに。
データ変換の話をしていましたが、Transformation Flows の導入も、これらの機能も大幅にアップグレードします。Talend Cloud のパイプラインデザイナーをベースにしたシンプルなドラッグ&ドロップのインターフェースにより、データエンジニアも SQL の専門家でない人も、視覚的な変換フローを簡単に作成できます。ELT データパイプラインの一環として、カスタム SQL コードの代替として変換フローを使用できます。
Qlik Talend Cloud は、変換フローを SQL 文に変換し、オーケストレーションし、実行時に選択したデータプラットフォームにプッシュします。Snowflake、Databricks、Google Big Query、Azure Synapse Analytics、Microsoft Fabric はすべてサポートされています。
スキルに関係なく、すべてのデータエンジニアに適したデータ変換機能が充実しています。ポイント&クリックで完全に自動化されたデータマートを作成したり、ドラッグ&ドロップで変換フローを作成したりできます。独自の SQL をコーディングするスキルがない場合は、自然言語のプロンプトから SQL 変換を生成する新しい AI アシスタントを使用することもできます。データ変換の詳細については、このリンクをご確認ください。
AI イノベーション - さまざまな AI イニシアチブの展開を支援する生産性とインフラストラクチャ機能を多数追加しました。カスタム SQL を使用して、機械学習(ML)モデルをトレーニングするためのデータセットを照合することができます。今年の後半には、Databricks の AI 機能を特別にサポートする変換フロープロセッサを追加して、この機能を強化する予定です。また、ベクトルデータベースのサポートや、RAG(Retrieval Augmented Generation)アプリケーションをサポートするデータパイプラインの構築を支援する複数のLLM も追加しました。構造化データソースと非構造化データソースを企業コーパスに使用する機能を提供することで、またもやイノベーションを実現しています。同時に、Snowflake Cortex のサポートも拡大しています。最後に、データエンジニアがデータパイプラインを構築しながら「会話」できるチャットインターフェースも追加しました。この便利な副操縦士のような機能は、データ品質ルールの構築、カラムの標準化、データ探索などの開発タスクを加速します。新しい AI 機能の詳細については、こちらのリンクをご覧ください。
パイオニア的存在の Trust Score for AI
また、「Trust Score for AI」と呼ばれるさらなる AI イノベーションを発表できることを誇りに思います。このユニークな製品とサービスは、AI プロジェクトで使用されるデータの主要な品質指標を確立し、監視するのに役立ちます。Qlik Trust Score for AI は、AI データの全体的な品質を反映する単一の分かりやすいスコアを提供することで、AI データセットの信頼性を評価するように設計されたシステムです。
サンプルデータセットまたはご自身のデータで信頼スコアをこちらから体験してください!
クライアントマネージド製品の強化
これまで Qlik Talend Cloud についてお話してきましたが、私たちはクライアントマネージド製品への投資を続けていることを強調したいと思います。私たちは企業における導入の現実を理解しており、お客様のインフラやワークロードがすべてクラウドで稼働するわけではないことを認識しています。業界の他の多くのベンダーのように、クラウドへの移行を強制しているわけではありませんし、データ処理のワークロード実行場所を選択する自由を引き続きサポートします。この 1年の製品アップデートをすべて挙げることはできませんが、ハイライトをいくつかご紹介します。
- Talend Studio の機能強化 - Talend Studio の UI に、すべての開発者にアピールする新鮮でモダンなルック&フィールを採用しました。
- Studio の生成 AI パイプライン – RAG ベースの要件向けにベクトルデータベースと LLM エンベディングをサポートする新しいコンポーネントも追加し、プラットフォーム全体に AI 機能を織り込むというテーマを継続しました。
- Snowpipe Streaming - 昨年発表した Snowflake Cortex は唯一のイノベーションではありません。Qlik Replicate は Snowpipe Streaming のサポートもリリースしました。これはSnowflake にデータをロードする新しい方法で、バルクロードとは対照的に Snowflake のテーブルに直接ロードすることで、レイテンシーの短縮とコストの削減に貢献します。
- FIPS コンプライアンス - Qlik Replicate May 2024 リリースでは、標準セットアップルーチンの一部として FIPS コンプライアンスがサポートされています。
- API サポートの強化 - Qlik Enterprise Manager API を拡張し、特定のタスク内でテーブルを追加・変更できるようになりました。
最後に
この1年はデータ事業部を率いてのエキサイティングな1年でした。今回発表した私たちのビジョン、イノベーション、そして製品をこれ以上ないくらいに誇りに思います。将来に向けて、データ統合と品質ソリューションが最先端の AI 開発を確実に促進するために前進したことは明らかであり、これらの強力なツールが私たちの働き方や生活に革命を起こし続けることを確信しています。私たちは正しい道を歩んでおり、お客様や業界アナリストからもそのようにご認識いただいています。今後のさらなるエクサイティングな進化にご注目ください。
-
QlikView - New Security Patches Available Now
Update 21st of March 16:00 CET: published CVE numberUpdate 27th of March 10:45 CET: added FAQ Hello Qlik Users, A security issue in QlikView has been ... Show MoreUpdate 21st of March 16:00 CET: published CVE number
Update 27th of March 10:45 CET: added FAQHello Qlik Users,
A security issue in QlikView has been identified and patches have been made available. Details can be found in the Security Bulletin High Severity Security fix for QlikView (CVE-2024-29863).
Today, 20th of March 2024, we have released two service releases across the latest versions of QlikView to patch the reported issue. All versions of QlikView prior to and including the releases below are impacted:
- QlikView May 2023 SR1 (12.80.20100)
- QlikView May 2022 SR2 (12.70.20200)
Call to Action
As no workarounds can be provided, Customers should upgrade QlikView to one of the following versions that contain the fix:
- QlikView May 2023 SR2 (12.80.20200)
- QlikView May 2022 SR3 (12.70.20300)
This issue only impacts QlikView. Other Qlik data analytics products including Qlik Cloud and Qlik Sense Enterprise on Windows are not impacted.
Additional Details
- All Qlik software can be downloaded from our official Qlik Download page (customer login required). Follow best practices when upgrading QlikView.
- Qlik provides patches for major releases until the next Initial or Service Release is generally available. See Release Management Policy for Qlik Software.
- Notwithstanding, additional patches for earlier releases may be made available at Qlik’s discretion.
- The information in this post and Security Bulletin High Severity Security fix for QlikView (CVE-2024-29863) is disclosed in accordance with our published Security and Vulnerability Policy.
The Security Notice label is used to notify customers about security patches and upgrades that require a customer’s action. Please subscribe to the ‘Security Notice’ label to be notified of future updates.Frequently Asked Questions
Q: Is the vulnerability present in the QlikView Plugin or other QlikView products?
A: The vulnerability is related to the MSI files on disk.Q: Will deleting the MSI files mitigate the issue?
A: Qlik does not consider removing the MSI files a complete workaround. A server user can restore them. -
Creating a Collapsible Filter Panel
In my last blog / video. I showed you how to easily create visual buttons to apply selections and change their visual selection state so they can appe... Show MoreIn my last blog / video. I showed you how to easily create visual buttons to apply selections and change their visual selection state so they can appear enabled or disabled (selected, not-selected). In this video I'll show you how to setup a filter panel using buttons and the layout container to create a simple collapsible filter panel that is both esthetic and functional while also providing real estate for your dashboard objects.
Resources:
- Sample attached
- More Tips and Tricks

-
How to Calculate Duration when you have only one date time column
In this video I quickly show you how to create a duration column using 1 single date / time column. This comes in handy when wanting to calculate diff... Show MoreIn this video I quickly show you how to create a duration column using 1 single date / time column. This comes in handy when wanting to calculate differences in time period values stored in the same column.
- Sample .QVF attached
- Qlik Help Reference: Previous()
- Telemetry app mention
-
Qlik Connect 2024 に参加してきました!
本年 6月 3日から 5日にかけて米国オーランドにてQlik Connectが開催されました。日本からは 40名近いお客様・パートナー様が参加されました。その模様をお送りします。 初日は午後からパートナー様向けのセッションが開催されるため、パートナーの皆様は、20時間近くのフライトを苦ともせず(?)... Show More本年 6月 3日から 5日にかけて米国オーランドにてQlik Connectが開催されました。日本からは 40名近いお客様・パートナー様が参加されました。その模様をお送りします。
初日は午後からパートナー様向けのセッションが開催されるため、パートナーの皆様は、20時間近くのフライトを苦ともせず(?)、一足早く続々と現地入りされました。
夕方からはすべての参加者を対象としたウェルカムパーティが開催され、ここで他の日本からの参加者との初めましてのご挨拶となります。また Qlik エグゼクティブも参加しているので一緒に記念写真を撮られた方も多数いらっしゃいました。
4日は基調講演からスタートです。Qlik の本格的な AI への取り組みや新製品Qlik Talend Cloud と Qlik Answers の発表、AI Council からの提言などが発表されました。
その後は 100を超えるブレイクアウトセッションと、Qlik やスポンサーパートナーの展示パビリオンなど消化しきれないくらいのコンテンツが用意されていました。また、この日は「Rapidly Unlocking Enterprise Data Value To Gear Up for the GenAI Challenge」と題したパネルディスカッションに富士通の池田様がご登壇、集まったグローバルオーディエンスに対し、同社での AI やデータの取り組みを(もちろん英語で)ご紹介されていました。
この日の夜にはホテル近くのダイナーで Japan & APAC Night を開催。日本とアジアからの参加者80名ほどが国を超えた情報交換や、ボウリング、ビリヤードなどを楽しまれていました。
5日の午前中はグローバルパートナー(アクセンチュアと AWS)やゲスト講演の講演に加え、恒例のトランスフォーメーションアワードが発表されました。今年から新たに設定された5つの部門の一つである Data Mastery アワードを富士通様が受賞されました。おめでとうございます!昨年のホンダ様に続き日本から2年連続の受賞となりました。
午後は前日と同じようにブレイクアウトセッションとパビリオン巡りとなります。2日目だと少し余裕ができてきたのか、ブースでじっくりとお話を聞かれる方が多かったようです。特に新製品の Qlik Answers のブースは質問したい方が絶えることがありませんでした。
そして夜は全員参加の Appreciation Dinner と称して、ユニバーサルスタジオへ移動です。なんとアイランズ・オブ・アドベンチャーを貸切り、敷地内のあちこちに屋台形式で食事が用意され、Jurassic World VelociCoaster や Hagrid’s Magical Creatures Motorbike Adventure などのライドが乗り放題でした。
v
あっという間の 3日間でしたが、参加された方からは「Qlik の最新情報を体感できた」「同じ情報でも担当者や関係者から直接聞くと理解が全く違いました」「他の海外参加者の話が大変参考になった」「Qlik 関係者は参加必須ですね」などの嬉しいお言葉をいただきました。
Qlik Connect で発表された内容はこれから Qlik Japan チームが皆様にお届けしてまいります。ご期待ください。また、来年の Qlik Connect の日程と場所も発表されました。来年 5月 13日にフロリダでお待ちしています!
-
Creating a Qlik Sense App Thumbnail with Adobe Express Web
Give your Qlik Sense Apps some style. Make them stand out in the Qlik Cloud Hub with eye catching and visually pleasing thumbnails. See how I use Adob... Show MoreGive your Qlik Sense Apps some style. Make them stand out in the Qlik Cloud Hub with eye catching and visually pleasing thumbnails. See how I use Adobe Express to quickly and easily give my Qlik Sense Apps some polish.
Full Video:
https://youtu.be/n8y0GINxDu0
Full Playlist:
https://www.youtube.com/playlist?list=PLW1uf5CQ_gSqF5bcmbBrk1q7Q4-h899V1
-
Qlik Introduces a New Era of Visualization
Our ability to tell stories is an art form as old as language itself. From ancient cave paintings to oral traditions passed through generations, the e... Show MoreOur ability to tell stories is an art form as old as language itself. From ancient cave paintings to oral traditions passed through generations, the essence of stories has evolved alongside our communication methods. It began with visual tales etched on cave walls, transitioned into spoken narratives, and eventually found its way into written, printed, and typed forms.
Ultimately, modern analytics and visualizations serve the same purpose as sharing and retelling stories: guiding business users to make important and informed decisions. These decisions, however, are not made alone, and require stories to persuade and engage others, often in boardrooms or video calls. But the goal of the story remains unchanged: to inspire action, instill confidence, and ensure safety.
So, what happens in the next chapter?
Today, Qlik is proud to announce a new era in data visualization and dashboard design. With the latest advancements in Qlik, you can bid farewell to the days of grappling with custom style sheets and juggling third-party add-ons. It's time to explore your creativity and take control of your narrative like never before!
Chapters:
1. The layout container adventure
Picture this: designing beautiful dashboards that are not only interactive but also fun and easy. Say hello to the Layout container, your new-found playground for creativity. Stack objects, craft custom and composite KPIs, and toggle individual object visibility with ease. With multi-selection, grouping, and a plethora of styling tools at your fingertips, designing experiences just got a whole lot faster and more intuitive. Need inspiration? Dive into this vibrant dashboard crafted by Luis Felipe Tensini, Qlik Partner Ambassador, and prepare to be amazed.
2. Charting new narratives & filter pane styling
It's not just about data; it's about presentation. You now have the power to improve the way you tell your story. Control borders, shadows, fonts, and more to add depth and personality to your visualizations while maintaining your company's branding. Explore data effortlessly with customizable filter panes. From grid mode to compact views, from checkboxes to radio buttons, tailor your data display for a truly immersive user experience.3. Cyclic group dimensions delivered
Cyclic groups for Master Item Dimensions—another QlikView legendary feature delivered. Allowing users to dynamically cycle through dimensions in every chart, maximizing the potential to tell stories while conserving screen space. With this innovation, charts become versatile tools, accommodating multiple use cases effortlessly. Crafting compelling narratives is simplified: select the Cyclic option in the master items library, choose desired fields, and effortlessly switch between them in your chart.4. A tale of dashboard themes…enhanced
Plot twist! We've introduced enhancements, including new straight tables, pivot tables, line objects, and rich text objects. Take command of your space with the ability to control the visibility of the main selection toolbar and sheet header, freeing up valuable real estate for content and custom navigation bars.Cliff notes: Visualizations have undergone a remarkable makeover. You now have permission to evoke the freedom of creativity, captivate your audience, and transform data into insights like never before. The future with Qlik Cloud is bright!
From ancient cave tales to today's dynamic dashboards, the evolution of storytelling parallels human communication methods. Innovation ushering in a future where every data point tells a tale waiting to be explored.
Your adventure into the world of Visualizations & Dashboards does not stop here… continue your journey and check out the ‘What’s New: Qlik Showcase App’ or these new and improved stylish apps below and see for yourself!
In the grand scheme of things, Qlik’s evolution promises freedom, creativity, and limitless possibilities in data visualizations. The only limit is your imagination.
Highlights:
- Filter pane styling: styling options for the filter pane
- Chart Border and Shadow: More control for app developer. Use it to create depth effect, enhance or hide the border. Perfect for layout container. Overrides the theme setting.
- Layout Container: Freeform layout for grouping and stacking. New way to create content and design dashboards
- Pivot Table: New pivot table and will replace native pivot in the future
- Styling improvements: Grid, Funnel and Sankey chart is getting styling
- Copy and paste style: Transfer styling settings from one chart to another
- Cyclic master dimensions
Helpful Links:- What’s New in Qlik Cloud
- Technical preview
- Visualization Update | Qlik YouTube
- How to Create Visual Button Selection States | Do More with Qlik
- How to Create Collapsible Filter Panel | Do More with Qlik
- Cyclic Group Dimensions | SaaS in 60
Inspiration from Qlik Community: -
Looping through cloud-based file data using a metadata connector (video)
In today's blog....as promised, Qlik Solution Architect Tomilayo Komolafe (Tomi) is back providing real in-the-trenches solutions to real customer pro... Show MoreIn today's blog....as promised, Qlik Solution Architect Tomilayo Komolafe (Tomi) is back providing real in-the-trenches solutions to real customer problems. ( If you missed Tomi's introduction to the Qlik Design Blog and our last post / video, you can visit this link - Contact Tracing with Qlik Sense SaaS - and Active Intelligence Solution.)
When working with a Qlik customer, Tomi stumbled upon a particular problem of not being able to iterate over, or loop through, file data stored in a cloud-based platform. Tomi recorded a video of the particular solution, which I embedded below along with some sample data and a sample Qlik Sense App.(attached below) - I would like to mention that Tomi borrowed some Qlik script for this solution from Qlik MVP and Luminary @stevedark of Quick Intelligence fame. I would like to also thank Steve for his valuable contributions, not only to help make this solution easy and possible but also for all the help he provides to our Qlik Community members (reference material links below). 👍 - Thanks Steve and Tomi for demonstrating teamwork for results a Qlik core value to help our customers.Before we get started - a word from our sponsor 😁
- Don't forget to sign up for our next Do More with Qlik - next week 4/8 @ 2PM - where Jeff Goldberg and I will cover Qlik Sense SaaS and our new Webhooks integration.
Register here:
The Problem
The problem was observed when recently working with a customer who needed to bring in 800+ csv files stored in his company’s OneDrive shared folder location into Qlik. If the files were stored in his local directory, he could use Qlik’s wildcard character to ingest many of these files. Something as simple as “*.csv” for example would have returned all files that are CSVs in his lib file path. Unfortunately, many of these cloud vendor options such as Google Drive, OneDrive, Dropbox, etc, don’t allow for use of special characters in their environment. Obviously, he would’ve needed to load all 800 CSV files individually right? 😉
Luckily, there’s a solution that automates this process in Qlik and still provides enough flexibility for the end user. Watch this video to learn how and note the links and reference materials below - including sample solution and data attached.
Can't see the video? YouTube blocked by your region or organization? Download LoopFiles.zip for a copy of the .mp4 file that you can download and watch on your computer or mobile device.
Reference: (Steve Dark solutions)
Files:
- sample_data_and_app.zip
- Extract .xls files to cloud-based storage location of your choice (OneDrive in this example)
- Import .QVF file
- Add / Edit Metadata / cloud data source connections appropriately
Qlik Help:
- Don't forget to sign up for our next Do More with Qlik - next week 4/8 @ 2PM - where Jeff Goldberg and I will cover Qlik Sense SaaS and our new Webhooks integration.
-
Managing your Analytics lifecycle in Qlik Cloud Analytics - UPDATE!
Introduction The majority of customers use some form of software development lifecycle in their organizations. When moving to SaaS customers are somet... Show MoreIntroduction
The majority of customers use some form of software development lifecycle in their organizations. When moving to SaaS customers are sometimes unsure of if or how to apply these techniques to a Qlik Cloud Analytics tenant.
We will explore some of the technical processes that need to occur within or interacting with a Qlik Cloud Analytics tenant as part of a software development lifecycle. We look at a number of areas including setting up your tenant in a way that supports your SDLC, encouraging re-use, building context aware applications, and many other topics. Qlik Cloud Analytics runs on Qlik Cloud, Qlik’s SaaS platform for our customer’s data analytics and data integration needs. We see customers being able to manage their entire data landscape and are continually expanding our cloud offerings. We have introduced new services such as Data Integration, Application Automation, Machine learning and AI, as well as adding many new features to Qlik Cloud Analytics. While there are many other areas where Qlik Cloud can be integrated into your SDLC, this document will focus on Qlik Cloud Analytics.
The aim of this document is not to provide a strict SDLC process for customers to follow, rather it aims to provide examples of how SDLC processes could work in a Qlik Sense Enterprise SaaS environment. We encourage you to implement or amend the parts or this you need so Qlik Sense Enterprise SaaS fits into your organization.
Read it all in the PDF attached in this post.
-
Qlik now supports HIPAA requirements for US Healthcare
Qlik is excited to announce that we have recently completed our SOC2 Type 2 + HITRUST attestation in addition to releasing Customer Managed Keys, an a... Show MoreQlik is excited to announce that we have recently completed our SOC2 Type 2 + HITRUST attestation in addition to releasing Customer Managed Keys, an advanced encryption offering for customers hosting data in Qlik Cloud. These additional levers of governance enable Qlik Cloud to now host Personal Health Information (PHI), subject to HIPAA requirements, and enable Qlik to enter into a Business Associate Agreement (BAA) with customers.
Qlik has invested heavily to support our customers through their journey into the cloud and this achievement illustrates Qlik’s commitment to ensure customers feel safe deploying their data into Qlik Cloud. Now US Healthcare customers can benefit from all of the advantages of Qlik Cloud like automation and AutoML with the peace of mind that compliance is fulfilled.
Advanced Data Encryption
We launched Customer Managed Keys, a security offering in Qlik Cloud which allows customers to bring their own encryption keys (BYOK) to protect the data stored at rest in their Qlik Cloud tenant.
Customers can now host PHI and sensitive data in Qlik Cloud with trust and take advantage of SaaS and the full potential of Qlik Cloud. US Healthcare organizations can leverage the power of Qlik Cloud to enhance patient outcomes, improve service delivery, and close the gaps between data insights and actions.
To learn more about Customer Managed Keys, watch the video here.
Summary
Qlik Cloud delivers enterprise data integration and world-class analytics into a single platform and through our advanced encryption services we can support customers become data-driven and navigate their HIPAA compliance requirements.
To learn more about Qlik Cloud for US Healthcare, visit our website.
-
Qlik Cloud 5月の新機能
分析の新機能 テーブルの画像表示 ビジュアライゼーション バンドルの新しいストレート テーブルとピボット テーブルに画像を埋め込むことができるようになりました。画像はメディア ライブラリまたは URL から取得できます。 データロードエディターの改善 データロードエディターのスクリプト編集機能... Show More分析の新機能
テーブルの画像表示
ビジュアライゼーション バンドルの新しいストレート テーブルとピボット テーブルに画像を埋め込むことができるようになりました。画像はメディア ライブラリまたは URL から取得できます。
データロードエディターの改善
データロードエディターのスクリプト編集機能が改善されました。
スクリプトエディターと同様に、データプレビュー機能やビジュアルウィザードが追加され、Storeステートメントの記述やQVSファイルのインクルードが容易になりました。また、サイズ変更可能なパネルや、インクルードされたQVSファイルの内容をプレビューできるようになるなど、使いやすくなっています。
カタログ上のシートへのリンク
カタログ上にシートへのリンクを貼り付けることができるようになりました。
自動化のための接続を共有
共有スペースで自動化接続を作成および管理し、テナントの他のユーザーが自動化を作成する際に、これらの接続を使用できるよう許可します。
詳細については、Qlik Community: Shared automation connectionsを参照してください。
自動化で共有接続を構成するには、自動化エディターの右側のブロック構成メニューのConnectionタブを開きます。ここにSelect Space のフィルターが追加されています。ここで選択したスペースで、接続を共有して使用できるようになります。作成した共有接続は管理コンソールの自動化セクションで、スペースを移動したり、所有者を変更したりすることができます。
今後、共有スペースで自動化を作成できるようになる予定です。
ゲートウェイー直接アクセス 新バージョン 1.6.6
- ServiceNowアクセスのサポート
アウトバウンド、暗号化、および相互認証接続を介して安全にファイアウォールで保護されたデータソースに接続 - 新しい認証方法のサポート
Azure Synapse Analytics: Azure OAuthとAzure Active Directory
Azure SQL Database: Azure OAuthとAzure Active Directory
Snowflake: Oauth
Databricks: Azure Oauth
MongoDB: SCRAM-SHA-256 および LDAP - ODBCコネクタ使用時のメタデータのページング機能強化
10,000以上のテーブルが取得される場合、タイムアウトを防ぐために10,000のバッチでテーブルが取得されます。 - .NET 8.xの要件
このバージョンから、Direct Accessゲートウェイを使用するには、.NET 6と.NET 8.xの両方をインストールする必要があります。 - サポート性の向上
トラブルシューティングのために、Direct Accessゲートウェイのリクエストの継続時間を測定するロギングが追加されました。
データ統合の新機能
Qlik Data Gateway - Data Movement 2023.11.11
- 日本リージョンをサポートします。
- メタデータの並列抽出:複数のテーブルのメタデータを同時に取得
- ランディングタスクとレプリケーションタスクの監視情報の更新が60秒ごとから10秒ごとに短縮
その他問題解決しています。
※ 日本リージョンを利用する場合は、Data Movement 2023.11.11 以降をご使用ください。
管理者向けの新機能
アプリシートの使用状況の把握
2024年5月28日より、下記のイベントが管理コンソールと、監査APIのイベントセクションに表示されています。アプリでシートが表示される都度ログに記録されます。
com.qlik.v1.analytics.analytics-app-client.sheet-view.opened
その他
- 7月13日から管理コンソールのイベントに「com.qlik.user-identity.impersonation」が表示されなくなります。

- ServiceNowアクセスのサポート
-
P&L Pivot Chart Extension
Several years ago, I blogged about how I used IntervalMatch to create a profit and loss statement. Now that Qlik Sense has the P&L Pivot chart extensi... Show MoreSeveral years ago, I blogged about how I used IntervalMatch to create a profit and loss statement. Now that Qlik Sense has the P&L Pivot chart extension in the visualization bundle, I decided to test out the extension to see how it may help create a P&L report in Qlik Sense. This blog will review some of my findings and what was involved to create the P&L Pivot chart shown below.
The P&L Pivot chart extension provides a lot of properties that allow you to change the style and coloring in the chart. You can find a complete list of the properties here in Qlik Help. The chart above uses one dimension and 6 measures but I could have used up to 9 measures with my single dimension or used 2 dimensions and up to 8 measures. After loading the data into Qlik Sense, my next step was to create a style template that I could use to handle the formatting of the chart. Here is a snapshot of the template in Excel:
I added a header row so that I could easily see what options I could set but it is not required and can be omitted. In the styling template, Column A should include the data that is in the first dimension of the chart you will be applying the template to. Note that this data is case sensitive. The other columns have the various styles that can be modified via the template.
Here is an example of the same template in a CSV file.
If a template is used, it needs to be loaded via the script. Here is how you can load the Excel and CSV versions of the templates:
Excel:
CSV:
The key in both scripts is that the entire template needs to be loaded into one field which can later be selected from the Style template field drop down in the Properties window of the P&L Pivot chart. In the Excel script, the styles are concatenated into one field separated by semi-colons. In the CSV file, the file format is set to Fixed record to load all the data into one field. Note that the name that you give the field in the script will be the template name you select from the Style template field drop down.
Each row of the template should have this format:
DimensionValue;Bold;Background;FontStyle;TextColor;Align;FontSize;Comment
- DimensionValue is the data value of the dimension in the row that you would like the change
- Bold is used to bold the text in a row
- Background is used to set the background color of a row
- FontStyle is used to change the font style of a row to italic or oblique
- TextColor is used to change the default black font color of a row to white
- Align is used to set the alignment to center
- FontSize is used to change the font size of a row
- Comment is used to replace all zeros with a space
Check Qlik Help to see the default and styling options that are available in the styling template.
There are many additional properties that can be set in the properties window of the P&L Pivot chart extension. I kept many of the defaults but here are some that I changed. In the Table Format section of the Properties, I checked Indent to indent the P&L Heading. The columns can be narrow so I moved the Column width slider all the way to the right, (for max width), and changed the Font family so that I could see as much of the numeric values in the chart as possible. I tweaked the header coloring in the Header format section. I opted not to color variances below 0% red because then I would lose some of my styling template changes. While I used a styling template in my example, you do not have to. The P&L Pivot chart extension can be styled via the Properties window without using a template.
The P&L Pivot chart extension provides a ton of styling options that can be used to easily make your profit and loss statement looks exactly the way you want. It is worth checking out or you can watch this video to learn more.
Thanks,
Jennell
-
Connector Factory - May and June 2024 releases
Qlik Data Integration Additional SaaS application connectors We’re continuing to expand the connectivity of Qlik Cloud Data Integration with the ad... Show MoreQlik Data Integration
Additional SaaS application connectors
We’re continuing to expand the connectivity of Qlik Cloud Data Integration with the addition of three more business applications that can now be used as a data source. By eliminating the need for custom connectors to access these sources, Data Engineer productivity is increased and Data Consumer’s time to insight is decreased. The new connectors are for:
- Anaplan, which provides business planning software
- Oracle Fusion, a suite of applications built on Oracle Cloud
- Oracle Fusion Project Management, which is used to manage project deliveries.
Qlik Replicate
The May 2024 release of Qlik Replicate delivered a number of improvements related to connectivity with Snowflake, Databricks, SAP, AWS and Microsoft Azure. You can find out more about these enhancement in this blog.
Qlik Data Analytics
Updated DynamoDB Connector
This connector has been updated to be based on ODBC instead of JBDC. The Qlik DynamoDB connector now also supports authentication using AWS IAM credentials (access key & secret key) or a credentials file. Note that the previous JDBC-based Qlik DynamoDB connector will continue to be supported until the end of July 2024.
Learn more about the DynamoDB connector.
New version of Direct Access gateway
The Qlik Data Gateway - Direct Access allows Qlik Sense SaaS applications to securely access behind-the-firewall data, over a strictly outbound, encrypted, and mutually authenticated connection.
In May, we released Direct Access gateway 1.6.6 which introduced the following enhancements and new functionality:
- Support for accessing ServiceNow via the Direct Access gateway
- Support for Azure Active Directory authentication when using the Azure Synapse Analytics and Azure SQL Database Connectors.
- Support for Azure OAuth authentication when using the Azure Synapse Analytics, Azure SQL Database and Databricks Connectors.
- Support for OAuth authentication when using the Snowflake Connector
- Support for SCRAM-SHA-256 and LDAP authentication when using the MongoDB Connector
- Enhanced metadata paging when working with ODBC connectors
- Additional logging to improved supportability
You can learn more about the Gateway here.
Qlik Application Automation
Sharing Automation Connections
Users can now create and manage automation connections in shared spaces. You can find out more about this new capability in this blog.
-
【7/10(水)14:00 開催】SAP データ活用の課題解決 Web セミナー
生成 AI の業務への組み込みは、DX のさらなる推進という従来からの取り組みと共に、多くの企業での喫緊の課題となっています。そしてその根幹にあるのはデータ活用であることは言うまでもありません。 その中でも生産・流通・財務・人事など主要業務システムの根幹でもある SAP データの活用は多くの企業が望... Show More生成 AI の業務への組み込みは、DX のさらなる推進という従来からの取り組みと共に、多くの企業での喫緊の課題となっています。そしてその根幹にあるのはデータ活用であることは言うまでもありません。
その中でも生産・流通・財務・人事など主要業務システムの根幹でもある SAP データの活用は多くの企業が望んでいます。Qlik は、これまでに数多くの SAP ユーザー様との対話を重ね、SAP データ活用の課題の理解に努め、さまざまな解決策をご提案してまいりました。
本 Web セミナーではこれらを集大成し、SAP ユーザーの皆さまが抱える課題を整理し、最適なソリューションと顧客事例をご紹介します。SAP の運用に関わる方だけでなく、SAP データをさらに活用したいビジネスユーザーの方、SAP の投資効果を高めたい経営部門のご参加をお待ちしています。
※参加費無料。パソコン・タブレット・スマートフォンで、どこからでもご参加いただけます。
今すぐ申し込む
【開催概要】
日時:2024年 7月 10日(水)14:00 - 15:00
会場:オンライン
参加費:無料 -
Welcome Talend Members!
Welcome Talend Community members to the Qlik Community! We are so DELIGHTED to have you be a part of the Qlik family and Qlik Community! Our Community... Show MoreWelcome Talend Community members to the Qlik Community!
We are so DELIGHTED to have you be a part of the Qlik family and Qlik Community! Our Community is a place to ask questions, find solutions, engage with other members and employees, and so much more. We would like to take this time to show you around and help you acclimate to your new surroundings.
Before we start showing you the ropes, a very important note:
YOUR ACTION IS REQUIRED!
Please register (click 'Sign Up' underneath the login form) for the Qlik Community by creating a Qlik Account. You MUST use the same email address used to register on the Talend Community. This will ensure your activity from the Talend Community persists within the Qlik Community.
If you do not remember the email address you signed up with or do not see your previous activity, please reach out to qlikcommunityadmins@qlik.com.
If you are a member of both Communities, your accounts should merge into one. If this is not what you experienced, please reach out to qlikcommunityadmins@qlik.com.
Participating in the Discussions
The Talend forums can be found by going to Forums > Data Integration. Here you will find a section called, ‘Formerly Talend’. The board names have remained the same to ensure a seamless experience. All posts have been brought over, as well as any attachments, embedded links, and likes (kudos).
Searching the Knowledgebase
Members of the Support and Digital Experience team have been hard at work, combing through the Talend articles checking validity and updating the content to ensure the latest and greatest information is at your fingertips. About 900 articles are available in the Community, with more on the way!
The articles can be found under Support > Knowledge > Official Support Articles.
Use the search bar to find articles using key terms, phrases, error messages, etc.
Filter the results using the facets on the left of the search results. Filter by 'Product' or 'Labels by Topic' to find what you are looking for.
The remaining articles will be added within the next couple of weeks. If there is anything you need and do not see, please let us know. Also in the coming weeks, redirects will be added to accommodate any saved bookmarks.
Creating Support Cases
Combining the two Communities is one amazing step towards integrating the two companies. The Support Portals will remain separate for the time being, which requires Authorized Support Contacts to continue to use the Talend Support portal to create cases.
Existing articles can still be found in the Support portal; however, they will only be maintained in the Qlik Community.
Viewing My Profile
All members that have logged in since January of 2019, were brought into the Qlik Community. Please note: if you registered for the Talend Community on or after January 11, 2024, your user will not be in the Qlik Community.
To get to your profile, click on the avatar in the top right corner and click “My Profile”.
The profile will display any recent conversations you participated in and show your current rank plus any badges earned. It will also display stats such as the number of posts, solutions accepted, likes given and likes received.
Your rank will replace the points you earned in the Talend Community. The more active you are, the higher the rank you will achieve. Learn more about ranks in the Qlik Community here.
Badges earned have been replaced with the Qlik Community badges. The two systems were very similar with badging, so you should mostly see the same badges.
Please note: badges will not appear on your profile until you log into the Qlik Community.
Learn more about Qlik Community
Here are some helpful resources to learn more about Qlik Community:
- Do’s and Don’ts for all Community members
- How to view and update your profile
- How to update your notification settings plus
- Subscribing in the Qlik Community
For more useful content about Qlik Community, see Get Started and Suzy’s Tips.
Where to ask questions about Qlik Community
We know this is a big change, but we hope an exciting one! If you should have any questions about Qlik Community, please do not hesitate to reach out to us. You can find us at the Water Cooler.
This is a lot of information all at once so please let us know in the comments below or in the Water Cooler what questions you have. We are here to help you through this transition.
Welcome again, we are thrilled to have you here!
Your Qlik Community Admins,
Melissa, Sue, Jamie, and Nicole
@Melissa_Potvin @Sue_Macaluso @Jamie_Gregory @nicole_ulloa
-
User.Environment.What?! - Session Attributes in Qlik Sense
Today - Jeff Goldberg is back and will introduce us to using session attributes to pass security and other information to a Qlik Sense session.Introdu... Show MoreToday - Jeff Goldberg is back and will introduce us to using session attributes to pass security and other information to a Qlik Sense session.
Introduction
Did you know with Qlik Sense security rules, it's possible to use attributes delivered to Qlik Sense Enterprise during the authentication process? Yup, it's true. While the conventional approach to using attributes is to import them using a User Directory Connector, session attributes are a flexible alternative to storing attributes in the repository to control capabilities and authorization in Qlik Sense Enterprise.
Qlik Sense supports session attributes through SAML, ticketing, and session authentication schemes. Session attributes are attributes sent in the request for access to the Qlik Sense server. The attributes are not stored in the repository, but in the user's Qlik Sense session. Session attributes can be referenced in security rules using the user.environment (e.g. user.environment.attributename) syntax. In addition, if there is an attribute named group sent to Qlik Sense using SAML, ticketing, or session, it can be used in Section Access data reduction.
Session Attributes in SAML
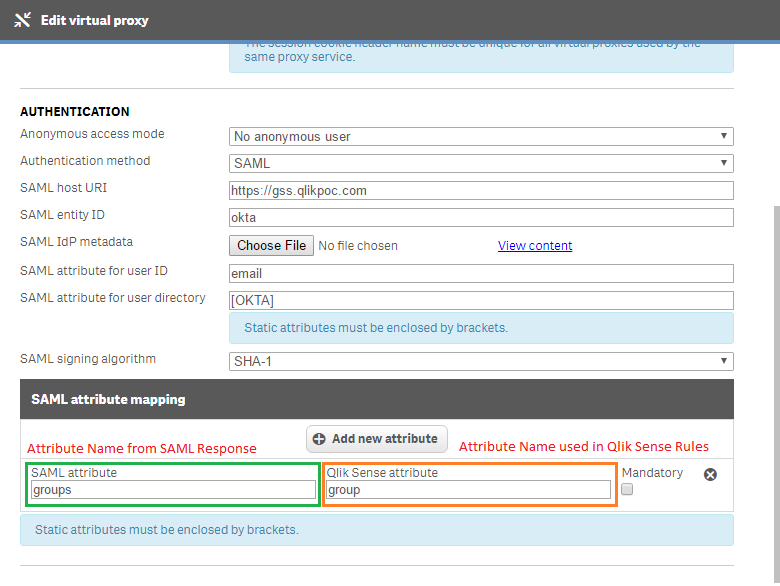
When you setup a SAML virtual proxy in Qlik Sense, there is an additional attributes section where you can add attribute names from the saml response sent by the identity provider, and the name you want to use in Qlik Sense. Here you can see I have a SAML integration with Okta. I have an additional attribute that comes in from Okta named Groups. In Qlik Sense I have it use the name group. The name on the left must match what is sent by the idp. The name on the right can be whatever you want it to be.
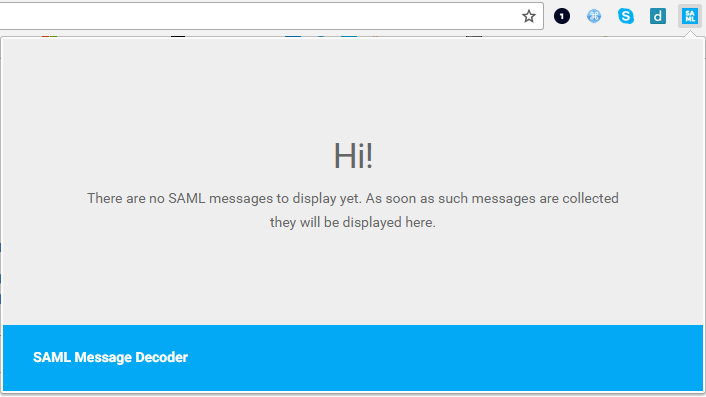
How do you identify the names of the attributes contained in the SAML response? I use SAML Message Decoder chrome extension. It's a great tool for reading through the messages sent to an IDP and sent to the Qlik Sense server.
<?xml version="1.0" encoding="UTF-8"?>
<saml2p:Response xmlns:saml2p="urn:oasis:names:tc:SAML:2.0:protocol"
        Destination="https://gss.qlikpoc.com:443/okta/samlauthn/"
        ID="id1026813850591869499238360"
        InResponseTo="_583b079d-39d2-44ab-9824-1336e628770e"
        IssueInstant="2016-12-13T14:03:23.898Z"
        Version="2.0"
        xmlns:xs="http://www.w3.org/2001/XMLSchema">
<...>
    <saml2 :AttributeStatement xmlns:saml2="urn:oasis:names:tc:SAML:2.0:assertion">
      <saml2 :Attribute Name="email"
             NameFormat="urn:oasis:names:tc:SAML:2.0:attrname-format:unspecified">
        <saml2 :AttributeValue xmlns:xs="http://www.w3.org/2001/XMLSchema"
               xmlns:xsi="http://www.w3.org/2001/XMLSchema-instance"
               xsi:type="xs:string">goldbergjeffrey@yahoo.com</saml2:AttributeValue>
      </saml2:Attribute>
          <saml2 :Attribute Name="groups" NameFormat="urn:oasis:names:tc:SAML:2.0:attrname-format:unspecified">
          <saml2 :AttributeValue xmlns:xs="http://www.w3.org/2001/XMLSchema" xmlns:xsi="http://www.w3.org/2001/XMLSchema-instance"
xsi:type="xs:string">QlikGroup</saml2:AttributeValue>
          <saml2 :AttributeValue xmlns:xs="http://www.w3.org/2001/XMLSchema" xmlns:xsi="http://www.w3.org/2001/XMLSchema-instance"
xsi:type="xs:string">Everyone</saml2:AttributeValue>
        </saml2:Attribute>
    </saml2:AttributeStatement>
</saml2p:Response>
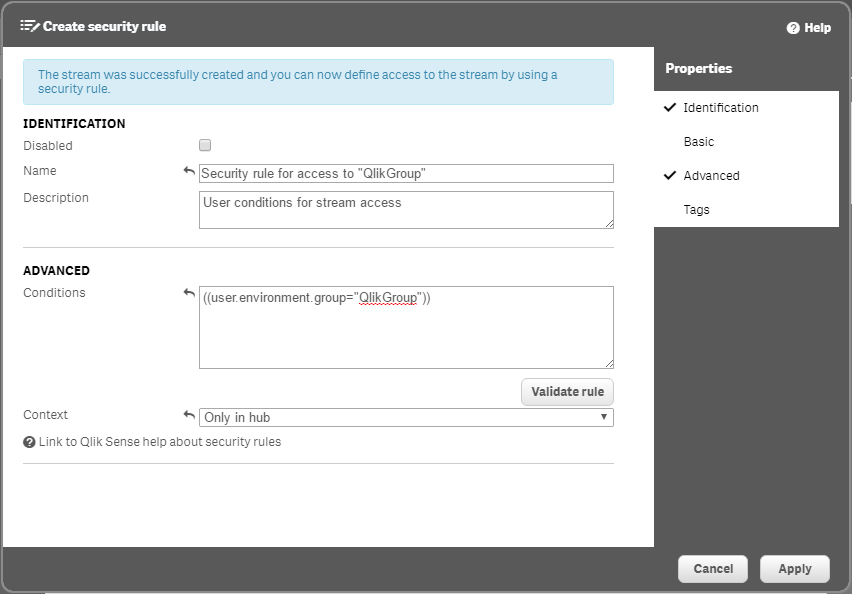
In Qlik Sense, I've created a stream for members of the QlikGroup group to access in the Qlik Sense Hub. The security rule I put in place uses the user.environment.group attribute and evaluates it against the QlikGroup group value.
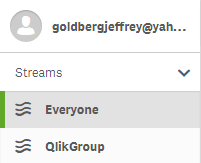
When I log into Qlik Sense, you see that I have access to the stream I created because in my SAML response I am a member of the QlikGroup group.
Session Attributes in Ticketing and Session
When ticketing and session authentication schemes are used session attributes are sent as part of the request. Here is a snippet from some sample code that demonstrates how to send attributes in a ticketing request. Notice that in the JSON message there is the UserDirectory and UserId properties and then the attributes property which is an array inside you specify an additional JSON object for each key value pair that's used to send an attribute to Qlik Sense.
ticket request message body
{...}
//The body message sent to the Qlik Sense Proxy api will add the session to Qlik Sense for authentication
string body = "{ 'UserId':'" + user + "','UserDirectory':'" + userdirectory +"',";
    body+= "'Attributes': [{"group":"QlikGroup"},{"group":"Sales"}],";
    body+= "}";

byte[] bodyBytes = Encoding.UTF8.GetBytes(body);
{...}
Once a session attribute has been sent through the ticketing or session request system those attributes are stored for the duration of the users access and are used for security rules just like in the SAML example. Let's take a quick at how this works. I'll navigate to my webpage that uses the ticketing code. Inside the ticketing code I've supplied a group attribute that will grant me access to the QlikGroup stream. During authentication, security rules will evaluate and determine that I have a group attribute and the security rule uses user.environment.group to grant me access to the QlikGroup stream.
Section Access
In the previous examples I sent along an attribute named group. In reality I could send any attribute I want through the session attributes mechanism. But the group attribute name has some additional capabilities within Qlik Sense. Using the group attribute name allows those values to pass into an application for section access data reduction purposes.
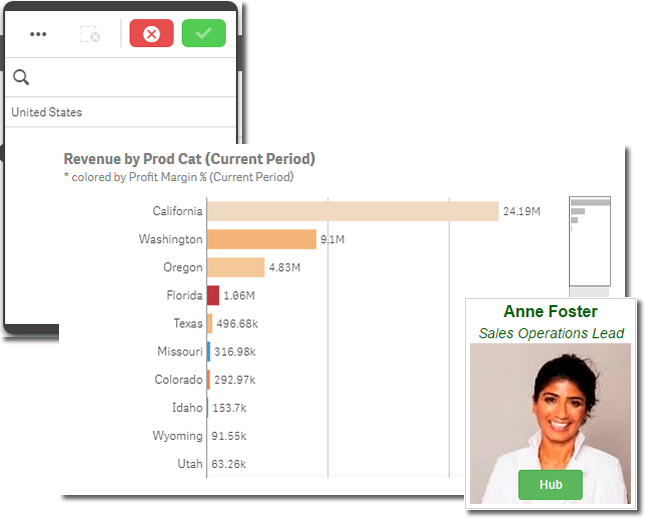
Let's go ahead and open up a sales application as Anne Foster.
Her data is reduced to only the United States because the session attribute named group has a value of "SalesUS".
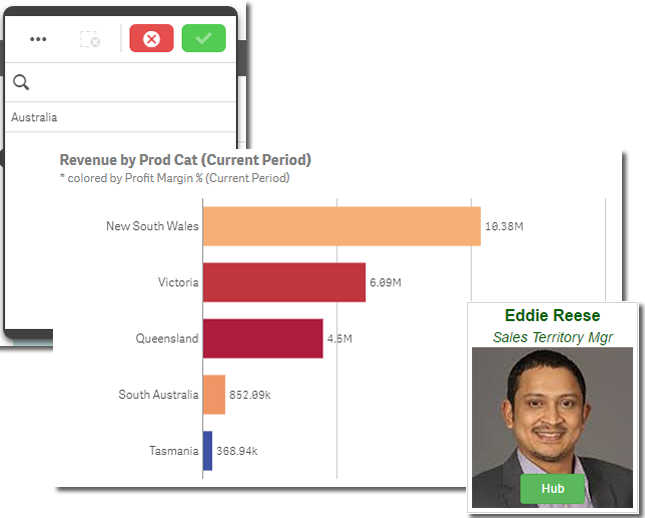
When I log in as Eddie Reese, he is only able to see Australia because his the session attribute value for him is "SalesAUS".
Wrap up
Session attributes are a powerful and flexible alternative to user directory connectors when using SAML, ticketing, or session authentication schemes. Session attributes are accessible in security rules with the user.environment syntax, and when the session attribute is named "group", the values may be used with Section Access data reduction. To learn more Qlik products and discover additional technical materials, join the conversation on our Qlik Community, Qlik Help YouTube channel and view the video libraries on the Qlik Community: New to Qlik Sense Videos - New to QlikView Videos
About Jeff:

Jeff is a Principal Enterprise Architect on the North America Enterprise Architecture team who has worked in various technology positions for over 16 years. Jeff focuses on integration, deployment, automation, security, and api topics across a wide range of software. Thanks for this valuable contribution Jeff!
(Hey Jeff - this pic is going to give me nightmares!)

Follow us:
Jeff Goldberg (@goldbergjeffrey) | TwitterMike Tarallo (@mtarallo) | Twitter