Unlock a world of possibilities! Login now and discover the exclusive benefits awaiting you.
Analytics & AI
Forums for Qlik Analytic solutions. Ask questions, join discussions, find solutions, and access documentation and resources.
Data Integration & Quality
Forums for Qlik Data Integration solutions. Ask questions, join discussions, find solutions, and access documentation and resources
Explore Qlik Gallery
Qlik Gallery is meant to encourage Qlikkies everywhere to share their progress – from a first Qlik app – to a favorite Qlik app – and everything in-between.
Qlik Community
Get started on Qlik Community, find How-To documents, and join general non-product related discussions.
Qlik Resources
Direct links to other resources within the Qlik ecosystem. We suggest you bookmark this page.
Qlik Academic Program
Qlik gives qualified university students, educators, and researchers free Qlik software and resources to prepare students for the data-driven workplace.
Recent Blog Posts
-
Replace() Function
The Replace() function can be used in the script or a chart to replace all occurrences of a sub-string with another sub-string within an input string.... Show MoreThe Replace() function can be used in the script or a chart to replace all occurrences of a sub-string with another sub-string within an input string. Basically, you can replace a character or string of characters in a field or input string. The syntax from Qlik Help looks like this:
Replace(text, from_str, to_str)
The first parameter, text, is a string. This can be a field or some text. The second parameter, from_str, is the string you would like to replace in the input string. This can be a single character or a string of characters. The third parameter, to_str, is the string that should replace the second parameter. If the from_str is not found in the text then nothing is replaced. The Replace() function works from left to right.
I have used the Replace() function when I have a field that has some characters that I do not need. For example, I was loading names in a recent project and some of the names had a leading underscore character (_). Since this was the case with only some of the names and not all, I used the Replace() function to replace the underscore with an empty string using syntax like this:

You can also nest the Replace() function. I have used this if there is more than one character I would like to replace in a string. The nesting works from the inside out so keep this in mind as it may affect your results. In the table below are a few examples of how Replace() can be used.
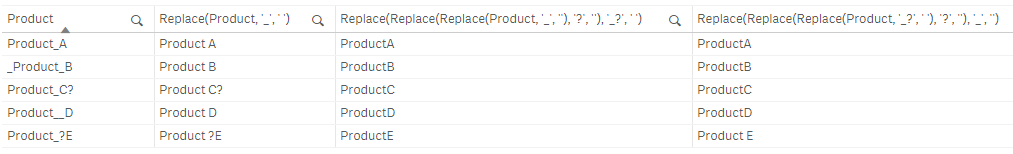
- Column 1 - shows the original text string for Product. This is the first parameter for all the Replace() examples.
- Column 2 – replaces the underscore with a space.
- Column 3 – is an example of a nested Replace() function. First it replaces the underscore with an empty string. Then it looks at the result of that string and replaces the question mark with an empty string. The last step is to look at the results of that string and replace underscore question mark (_?) with a space (which will not be found in the Column 3 example).
- Column 4 – is another example of a nested Replace() function but notice how the order affects the results for the input string “Product_?E”. Since the first Replace() function to be evaluated replaces the “_?” with a space, the next two Replace() functions do not find the second parameter to replace. Therefore, the result is “Product E” with a space before “E.” In Column 3, the result is “ProductE,” without a space, since the underscore and the question mark were replaced individually with an empty string before the Replace(‘_?’, ‘ ‘) part of the expression was executed.
While my example shows how the Replace() function can be used in a chart expression, I always use it in the script to handle any replacements as I load the data. What is nice about the Replace() function is it does not modify the text if the sub-string cannot be found. With that in mind, you should make sure you want to replace all occurrences of the sub-string because there is not an option to pick and choose which sub-string occurrences to replace - all of them will be replaced.
Thanks,
Jennell
-
Sentiment Analysis in Qlik Sense using Advanced analytics integration(Amazon Com...
In recent years we have seen tremendous growth in the generation of textual data online. Analyzing such textual data can prove to be extremely benefic... Show MoreIn recent years we have seen tremendous growth in the generation of textual data online. Analyzing such textual data can prove to be extremely beneficial for businesses in today’s digital world which would allow them to make critical decisions. For instance, for a company selling a product, it is crucial to understand the consumer’s viewpoint, and therefore analyzing the ‘reviews’ can be a great starting point. However, this also leads to an intrinsic problem — How do we analyze such constantly generating huge volume of text and interpret their meaning?
Ideally, the solution would be to break down sentences and phrases into specific components and then analyze these components by using a technique such as Natural Language Processing(NLP). NLP comprises features such as sentiment analysis, entity recognition, syntax parsing, part-of-speech tagging, etc. that can help us break down unstructured data to a granular level and allow for deeper analysis. There is a handful of toolkit such as NLTK, SpaCy, Amazon Comprehend, Google Cloud NL API, etc. that allows to process and derive insights from texts.
Scenario: Imagine your organization leverages Qlik Sense’s data analytics platform for visually understanding data & key metrics and Amazon Comprehend for text analysis. Your requirement is to be able to analyze some textual data, understand sentiments & most importantly be able to visualize the processed texts and extract any hidden insights. How would you achieve this using the two?
This is where Qlik Sense’s augmented analytics capabilities come into play. Now, as a Qlik Sense application developer, you can integrate the Qlik data model with Amazon Comprehend using the native connector for Qlik Sense. This would allow you to send a dataset from a Qlik reload script or a chart expression to Comprehend and derive inferences back to Qlik.
Now before we focus on ‘sentiment analysis’ specifically, let us get some background behind using any 3rd-party ML connectors in Qlik Sense(including Amazon Comprehend for this specific use case). This would help you understand the things running behind the hood and set the base for using any analytic connector.
1. Analytic connections:
The first step to start communicating with any 3rd-party Machine Learning endpoint from Qlik Sense is to establish an analytic connection. This can be created in the Data load editor and is native to the Qlik Sense client.
2. Server Side Extension(SSE) functions:
After a connection has been created, the next step is to integrate Qlik’s data model with the 3rd-party ML platform using the connection. This would allow for:
- sending data from Qlik’s data model & getting the inferences back using the load script
- performing real-time calculations in chart expressions
To achieve the above two use cases, we rely on the SSE functions. SSE is used to extend the built-in Qlik expression library with functionality from external calculation engines. If you are not aware of the SSE syntax, you can read more about them here. Our focus in this blog would primarily be 2 functions:
- ScriptEval — used with data load script. Here, you can send a single table to the ML model, and a single data table is returned. We can then use LOAD … EXTENSION statement to load the data back to Qlik.
- ScriptAggrStr — used with chart expression. Here, we cannot consume a table returned from the SSE function call and only the first column returned will be used by Qlik Sense.
The entire workflow for any Machine Learning connection integration within Qlik Sense comprises of the below steps:
- the SSE functions and parameters are first processed within Qlik Sense.
- they are then converted into REST requests.
- the REST requests are sent to 3rd-party ML models for processing.
- ML models process the request and send inference back to Qlik.
The image below depicts the entire flow.
Prerequisites:
- Analytic connections for machine learning endpoints must be enabled by a tenant administrator in the Management Console.
- Need to have access to 3rd-party ML models that exposes REST-based API endpoints.
Alright, now that we have an understanding of the background and things required for us to get started with text analysis, let us deep dive into the steps.
For this tutorial, we will use a part of the Datafiniti’s hotel reviews dataset and our goal would be to understand the sentiments from hotel reviews.
1. Load Data: First, we will load our dataset, which is in a CSV file using a folder connection. The script in the Data Load editor looks like below. Please note we also add a new field ‘RowNo( ) as RowID’ in our table [Hotel_review]. The purpose of this is to create associations between this and the tables returned by the 3rd-party ML systems(comprehend in this case) so we can take advantage of Qlik’s unique associative engine during analysis.
2. Create connection: Since we plan to use Amazon Comprehend for text analysis, we will create a new connection in the Data Load editor. Amazon Comprehend provides the following 5 services for text analysis -
Since in this case, our goal is to do sentiment analysis, we will select the highlighted service from the dropdown. You will also need to provide Amazon-specific details for the connection (for details read here) and finally a name (‘Amazon_Comprehend_demo’).
3. Send data to Comprehend: Next, we will use the ‘Select data’ button from our connection to send a table and a field from Qlik Sense to the Amazon Comprehend system for sentiment analysis. The table should be the name of the table with source data that you have loaded into your app. In our case, the table is ‘Hotel_Review’ and the field is ‘Reviews’.
4. Load returned table: After a table & field name is sent from Qlik Sense to Comprehend, the available return table will automatically appear under the ‘Tables’ section(as seen below). When selecting the table, you can select or deselect the columns to load. In our case, we will select all the 5 fields under the ‘Sentiments’ table returned by Comprehend and click ‘Insert script’.
Below is how the script looks like. Similar to Step 1, we also add a ‘RowNo( ) as RowID’ field to maintain the associations and then reload our app. Note that when reload of an app occurs it will first expect to load the source data as a resident table and use this as input to the request made to Amazon Comprehend endpoints.
For the purpose of simplicity, let’s breakdown the SSE function visually.
Now quickly check the Data model viewer. We can see that the associations has rightly been made and everything is as expected.
5. Analysis: Our final step is to build a dashboard and do some analysis so we can understand the sentiments of the hotel reviews processed by Comprehend.
First, I want to know the count of each predicted sentiment category. So, I create a bar chart by using ‘Sentiment’ as a dimension and ‘Count(RowID)’ as a measure. Notice, how we can use a field returned by Comprehend system along with the available Qlik sense data to derive insights.
So, looks like there are a lot of ‘mixed’ reviews for the hotels. Out of curiosity, I wanted to know why there were so many mixed reviews about these hotels. Therefore, I created a table object with detailed reviews, titles and selected only ‘Mixed’ from my bar chart as a filter. The result is below:
The reason is that most of these reviews have both the ‘bad’ and ‘good’ context in the text. So, the sentiments are mixed. The ability to derive these kinds of insights using Qlik Sense is crucial so it has the right impact on your analysis.
I also wanted to visualize the predicted sentiments by the original ratings of the hotels. So, I decided to create a Mekko chart that would allow me to visualize ratings for each segment of sentiment. To do so, I use ‘Sentiment’ as a dimension, ‘Ratings’ as cells, and ‘Count(RowID)’ as a measure.
We can infer some things from here. For e.g. out of all the Positive sentiments, 71.3% were 5-star ratings, which aligns with our general understanding. The Negative sentiments are composed of ratings ranging between 2.5–2.9. So, they turned out to be negative.
Finally, let’s build a real-time sentiment analysis sheet in our Qlik Sense app. This is very interesting as it facilitates the following:
- provides a user interface experience to input any text.
- allows inferring sentiments in real-time.
To build the sheet, we will use the ‘Variable input’ object from Qlik’s dashboard bundle that can serve as a text field. We create a new variable called vText to be used with this variable input.
We then drag & drop the object to our sheet and the result is below:
Next, we need to pass the input text to Amazon Comprehend and get the result back in real-time. To do so, we will take advantage of SSE-based chart expression. Since we need to create an expression, we basically need an object that can show us ‘Measures’. The KPI object is a natural choice for this purpose. So, we drag & drop a KPI object and write our expression.
endpoints.ScriptAggrStr('{"RequestType":"endpoint", "endpoint":{"connectionname":"Amz_comprehend_sentiment","parameters":{"languagecode":"$(vLanguage)"}}}',vText)The result can be seen below.
To enhance user experience, we will also display the result as an emoji placed inside a KPI object. The expression for passing the input text & deriving sentiment remains the same. However, we use a pick-match function to get the right emoji. Below is the expression.
pick(match(endpoints.ScriptAggrStr('{"RequestType":"endpoint", "endpoint":{"connectionname":"Amazon_Comprehend_Sentiment","parameters":{"languagecode":"$(vLanguage)"}}}',vText),
'POSITIVE','NEUTRAL','NEGATIVE','MIXED'),
'😀','😐','🙁','🙄')
After putting everything together, the final result can be seen below -
Here’s the dashboard in action.
The idea behind this blog was to give a starting point to Qlik Sense users who plan to integrate 3rd-party ML systems and do advanced analytics seamlessly. There are also certain limitations specific to the Amazon Comprehend & the connector, which you can read about here. In the next couple of blogs, we will extend this tutorial to some more interesting use-cases using the various analytics connector available in Qlik Sense SaaS.
If you wanted to check out this demo app, here is a link — https://github.com/dipankarqlik/QlikSenseApps
Let me know what you think of this amazing augmented analytics capability within Qlik Sense.
~Dipankar, R&D Developer Advocate
-
The future wordplace needs YOU!
The demand for data scientists has started to grow faster than supply, with data science vacancies growing at 37% per year a LinkedIn study has found.... Show MoreThe demand for data scientists has started to grow faster than supply, with data science vacancies growing at 37% per year a LinkedIn study has found. The BBC have reported that this demand means people are entering data science roles from various backgrounds that don’t require the traditionally needed doctorate. In addition to this there is a clear need for candidates with strong people skills, a 2020 emerging jobs report by LinkedIn found that the future of SaaS (Software as a Service) will rely upon candidates who have strong people skills to complement the new technologies. This means that you don’t need to be a data wizard to secure roles in the tech industry. Supplementing your studies by exploring extra classes or courses can also be beneficial in helping you choose a career that may interest you the most.
Enhancing your learning with something like an entry level course in a Business Intelligence solution can be a great way to do this, and when it comes to the Qlik Academic Program its appeal goes beyond those studying data-based degrees. Recently when presenting to Birmingham City University a student pursuing a course in Gemology - the study of gemstones - was thrilled to see what value Qlik Sense could add to their course and how it could enable them to analyze their data while giving them a grounding in a BI solution that could add to their CV. The big advantage to studying with the Academic Program is that this is all completely free and flexible. You can pursue an advanced data architect pathway, or you can polish up your data literacy with some vendor agnostic lessons.
One of the big challenges when leaving school and starting at university is knowing which of these careers you want to pursue afterwards. In most cases your interests and skills will develop and change throughout your studies, and what you want from a career will change as well. The growing need for strong candidates in data driven roles, such as data science or data analytics, means that what you study at degree level does not need to limit you when it comes to the job market. Exploring something like the Qlik Academic Program can empower you to make an informed choice about what kind of role you’d like to explore after your studies and give you more opportunities in a workplace that is already looking for you!
Want to learn more about the Qlik Academic Program? For more information or to apply visit qlik.com/academicprogram
-
Send Customer Email Notifications without a Qlik Sense App using Qlik App Automa...
Part 2 of Qlik App Automation Sending Customer Email Notifications. This video shows you how to send a mail message to customers using the READ FILE ... Show MorePart 2 of Qlik App Automation Sending Customer Email Notifications. This video shows you how to send a mail message to customers using the READ FILE and Send Mail blocks without a Qlik Sense App.
Bonus: Also I show how to simply call the Automation from an action Button in a Qlik Sense App.

-
Sending Personalized Email Messages from a Qlik Sense App using Qlik Application...
This tutorial shows you how you can easily create a Qlik Sense App and Qlik App Automation workflow to send a customized email message to your custome... Show MoreThis tutorial shows you how you can easily create a Qlik Sense App and Qlik App Automation workflow to send a customized email message to your customers regarding their orders. It is obviously an oversimplification - but you can see how powerful the combination of Qlik App Automation and Qlik Sense are - they are... ♪ So Happy Together ♫
-
Vote for Qlik Community's Melissa Potvin!
Hello Qlik Community ! I am pleased to let you know that our very own Director of Qlik Communities, Melissa Potvin, has been named a finalist for B2B ... Show MoreHello Qlik Community !
I am pleased to let you know that our very own Director of Qlik Communities, Melissa Potvin, has been named a finalist for B2B Community Professional of the Year by CMX, the premier industry association for the community space.
Melissa was selected from over 400 nominations and is in some stiff competition with others from companies like HubSpot, Salesforce, Microsoft – oh, and ThoughtSpot.
As you know, through partnerships with many other lines of business within Qlik including Support and Customer Success, Product Management, R&D and other key organizations at Qlik, Melissa and her awesome team continue to transform Qlik Community into the very “heartbeat” of our global community and user experience.
Please help Melissa get the winning nod by voting for her here. Voting is open until November 19th.
Select category 'B2B Community Professional'
-
Giving Thanks for the updates in Qlik Replicate and Enterprise Manager November ...
Giving Thanks for the updates in Qlik Replicate and Enterprise Manager November 2021With the Thanksgiving holidays just around the corner, there are g... Show MoreGiving Thanks for the updates in Qlik Replicate and Enterprise Manager November 2021
With the Thanksgiving holidays just around the corner, there are good reasons to give thanks in the latest release of Qlik Replicate November 2021. Along with the several performance improvements with existing endpoints, we have now also completed the support for Databricks on all three major cloud vendors, with a new endpoint for Databricks on Google Cloud platform.
In addition, the Qlik Enterprise Manager November 2021 release now supports all notifications that are available in Qlik Replicate. This means you can now use Qlik Enterprise Manager to manage all the notifications under one roof, as you will now be able to set all the notifications for all your Qlik Replicate servers and for all their replication tasks.
Qlik Replicate Nov 2021
New Endpoints:
SQL Server as a source in Azure cloud
From the November release, we are now utilizing Microsoft’s CDC API with the new Microsoft Azure SQL (MS-CDC) endpoint. This means that we can now support capturing changes from Azure SQL MI using Microsoft Change Tables, as opposed to the SQL Server transaction logs. This provides a reliable solution for replicating data from SQL Server cloud sources where online transaction logs may not be accessible.
Databricks as a target on Google Cloud Platform (GCP)
The new Databricks on GCP endpoint rounds up the support for Databricks on the major cloud vendors, complimenting other Databricks as a target endpoint for AWS and Azure. In addition, all these target endpoints are also supported with Qlik Compose for Data Lakes. This release also brings support for the latest best practices from Databricks and a more secure option for connecting to cloud storage when utilizing Databricks targets on AWS, Azure and Google Cloud.
Updated version support
With Qlik Replicate November 2021 we welcome Microsoft Edge browser support for accessing the Qlik Replicate and Qlik Enterprise Manager consoles. As with every release of Qlik Replicate, we also update the supported versions of our endpoints and platforms.
The following source and target endpoint versions have recently been added
Source Endpoints:
- PostgreSQL 13
Target Endpoints:
- Databricks on Google Cloud 8.x (starting from 8.2)
- Databricks on AWS 8.x (starting from 8.2)
- Microsoft Azure Databricks (Blob or Data Lake Storage Gen2) 8.x (starting from 8.2)
- Microsoft Azure Databricks Delta 8.x (starting from 8.2)
- PostgreSQL 13
Other Improvements:
XML and JSON data types for Snowflake Targets
With this release, we have added support for XML and JSON data types for Snowflake targets so you can now take advantage of Snowflake's optimized query and processing capabilities for both these data types. Qlik Replicate can now take JSON or XML data from your various source systems and store it as VARIANT data type in Snowflake. This is great because now you can manage and derive value from this form of semi-structured data and easily access it quickly using simple extensions to standard SQL.
SAP HANA sources improved performance
From November, we have now extended our Paraelle Load support to SAP HANA sources which helps to increase the overall performance and scalability when replicating large data volumes from SAP HANA sources. Specifically, you can now accelerate the replication of large tables by splitting the table into segments defined by date ranges, partitions or sub-partitions and then loading the segments in parallel.
Hope you enjoy the November release of Qlik Replicate and Qlik Enterprise Manager, and for those of you celebrating Thanksgiving, Happy Holidays
For the full list of all the improvements please check out the latest release notes on help.qlik.com.
Qlik Replicate November 2021 Release Notes
Qlik Enterprise Manager November 2021 Release Notes
Already have a licence? Try out the release by going to Support > Downloads on Qlik.com and filtering your options to Qlik Data Integration > Version 2021.11
If you don’t yet have a licence but still want to try out Qlik Replicate for yourself, you can take it for a test drive or talk to your local Qlik account team who would love to continue the conversation on how we can help you keep your data fresh so you can achieve Active Intelligence.
You can always keep up to date with the latest on all developments at Qlik by becoming a QlikInsider, get in the know and stay connected with access to quarterly webinars, the next one is November 17th - sign up now
-
Google Translator on Qlik Community
Hello Qlik Community! Did you see the latest Qlik Community updates Melissa posted about yesterday? Along with the current enhancements, she announced... Show MoreHello Qlik Community!
Did you see the latest Qlik Community updates Melissa posted about yesterday? Along with the current enhancements, she announced a second sprint for this month (we definitely live up to our core value of move fast)! The second sprint will roll out on November 16th.
With that, we would like to give notice about one of the upcoming changes. To better support the needs of our entire user base, we will be removing the Google Translator functionality effective November 16th.
We realize some users rely on the translator and request moving forward they use their browser’s translator option.
Here are instructions for the most common browsers:
Let us know if you have any questions or concerns about this change. We appreciate everyone’s willingness and cooperation to make Qlik Community accessible to everyone!
Melissa, Sue and Jamie
-
Qlik Sense Client-Managed GA Release - November 2021
These include new Augmented Analytics capabilities for advanced insight generation and natural language, visualization and dashboarding improvements, ... Show MoreThese include new Augmented Analytics capabilities for advanced insight generation and natural language, visualization and dashboarding improvements, and a number of enhancements to our platform. Augmented Analytics enhancements include custom chart periods that allow users to customize the time periods, current period versus the previous period comparisons by using period over period analysis, and custom analyses to define analytics returned in response to specific phrases. Visualization improvements include new, product-agnostic versions of fundamental chart types, mini charts in tooltips, improvements to labeling and presentation in charts, and new options for configuration and usability. And, we have made a number of platform and connectivity improvements.
With this release, we continue to demonstrate our commitment to our on-premises customers as we support their journey to the cloud. We understand that everyone moves at a different pace, and we continue to provide valuable new capabilities in our client-managed offering as our customers make this transition.
Register to become an Insider and get the scoop on the latest and greatest product innovation across our data integration and data analytics portfolio! The next Qlik Insider Webinar will air on November 17th, 2021 and will cover exciting new Qlik Cloud capabilities.
-
Do you know what Active Intelligence really is? Join me next week on Do More wit...
Hey Guys.....RegisterPlease join me and Helene Kerper, Senior Director of Product Marketing, as we share our top Qlik Cloud capabilities that support ... Show MoreHey Guys.....
Please join me and Helene Kerper, Senior Director of Product Marketing, as we share our top Qlik Cloud capabilities that support our vision of Active Intelligence. Active Intelligence refers to a new state of business intelligence that enables organizations to make decisions and act in real-time.
We want to share how Qlik delivers on through capabilities such as Hybrid Data Delivery, Collaborative Notes, Data alerts, App Automation, Qlik Sense Mobile, and the Qlik Insight Advisor. By taking advantage of these capabilities, you can deliver up-to-date information to the right users at the right times, in a way that enables them to act in the moment, as events happen - creating a tremendous opportunity to boost innovation, accelerate value and sharpen your competitive edge.
You won’t want to miss this, so be sure to Register today!
-
Qlik Sense Accessibility
Hey Guys - this particular post may not be relevant to everyone, yet it is an integral part of making sure that a software's capabilities can be used ... Show MoreHey Guys - this particular post may not be relevant to everyone, yet it is an integral part of making sure that a software's capabilities can be used by those who have impairments. With the release of Qlik Sense June 2018, we have added some new accessibility conformance features that comply with WCAG 2.0 standards. To learn how we are making Qlik Sense more accessible to everyone, please check out this brief video below. Please let us know what you think and post any question, I'll be happy to address them.
Qlik Sense Accessibility
Resources:
- JAWS Screen Reader - Best in Class
- Accessibility - Qlik Help
- WCAG 2.0 standards
Regards,
Michael Tarallo (@mtarallo) | Twitter
Qlik
Can't see the video? YouTube blocked by your region or organization? Download the .mp4 to watch on your computer or mobile device.
-
Community Enhancements (2021 - 8)
Hello Qlik Community! This is always a fun time of year. The work should slow down but never does. In all seriousness, while we continue to push thi... Show MoreHello Qlik Community!
This is always a fun time of year. The work should slow down but never does. In all seriousness, while we continue to push this sprint into production (and a 2nd one is already planned for later this month) December we will go on a freeze. Unless it's a bug fix of critical nature or something else profound we will go on a much needed break. Instead, we will use the time to reflect on the past year while building plans for 2022. A freeze allows us time to ensure for community stability and work on site performance improvements.
Updates today include the following:
- Right Rail Navigation Updates
We deliver consistency to community pages by streamlining the right-side navigation (what we call the 'right rail') so that as users navigate from page to page things are consistent.
Right rail setup will primarily include:
- Moderator (or for Groups we note the Group Admins)
- Upcoming Events
- Labels (may be referred to as: "Subscribe by Product or Subscribe by Topic ")
- Tag Cloud
- Recent Documents
- Community Browser
2. New Label Design when Inside a Post
It's the little things in life that please this nerd 🤓
Labels help us keep all our content organized and serve a vital purpose in our community. Members often subscribe to labels as a way to only receive notifications on content they truly care about.
A UI improvement to labels went into production today making them easier to see and more appealing to the eye. You will notice the redesigned labels when creating a new post. When you select a label it will turn green (of course we chose green!).
Old DesignNew design for labels
3. 'Request to Close' on Case Portal
When updating a case you have the option to request to close your case. A simple UI improvement to left justify and bold the text and checkbox make this feature a bit more intuitive and noticeable for our users.We have a lot of big plans for you in 2022! Yet, I can't help but wonder... if you can request just one change to the Community what would it be? Tell us in the comments ⬇️ !
Wishing all our Community Members a wonderful day, week and month ahead.
All the best,
Melissa, Sue and Jamie
- Right Rail Navigation Updates
-
REMINDER: Do not miss out on becoming an Academic Program Educator Ambassador!
Becoming an ambassador can unlock exclusive benefits! Hear more about what some of our ambassadors have to say!What does being a Qlik Academic Program... Show MoreBecoming an ambassador can unlock exclusive benefits! Hear more about what some of our ambassadors have to say!
- What does being a Qlik Academic Program Educator Ambassador mean to you?
Javier Leon from Saint Joseph's University
Josué David Lima from Universidad de Congreso
- How has being a Qlik Academic Program Educator Ambassador benefited you and your students?
Javier Leon from Saint Joseph's University
Josué David Lima from Universidad de Congreso
Are you an Educator who is:
✓ Passionate about the Qlik Academic Program and the resources provided to students and educators?
✓ Passionate about educating students to be prepared for the data driven workforce and to secure jobs?
✓ An active promoter of the Qlik Academic Program to academic peers as well as students?
✓ Willing to share your experience of the Qlik Academic Program at (virtual) events, in forums, on social media and in the press?
✓ A contributor to blogs, forums, university publications, professional journals, papers, or other materials that promote the Qlik Academic Program?If you answered yes to one or more of the above, then we encourage you to apply to the Qlik Academic Program sponsored Educator Ambassador Program!
Through this initiative, we will be shining a spotlight on our most active educator members. Our ambassadors will champion our vision to make more students data literate and to prepare them for the data driven workplace. Visit us to meet our current 2021 Educator Ambassadors.
Applications close on November 30th

-
Meet Jesse van Haasteren, a Qlik Academic Program Datathon Finalist!
Last week we announced 3 finalists from the Qlik Academic Program Datathon and we could not be more excited to share their stories!Jesse van Haasteren... Show MoreLast week we announced 3 finalists from the Qlik Academic Program Datathon and we could not be more excited to share their stories!
Jesse van Haasteren comes from a small town called Warmond in beautiful Southern Holland, west of the Netherlands. But he know finds himself living in Leiden which is a small city that lays south of Amsterdam. Here he attends the Universiteit Leiden where he is pursuing a Master's degree in a program called Biology and Business Studies which consists of one year of Biology and one year of Business. Right now he is interning at 2Foqus and will be graduating shortly.
Outside of his studies, Jesse is an avid game lover, he likes board games but he has migrated more to online gaming during the pandemic because it allows him to stay connected with his friends. Because he spends a lot of time on the computer for school, he makes fitness a priority and he runs at least three times a week.
When Jesse graduates he hopes to begin his career in the Business Intelligence and Data and Analytics field and hopefully combine that with his passion and background as a biologist.
Jesse was particularly interested in this Datathon because it was closely tied to a previous project in which he researched plants and the effects of climate change. During that project he became me more aware of his own behavior and how he could be more sustainable on a personal level.
We are so impressed and excited by Jesse's submission. He picked up Qlik Sense quickly and created beautiful visualizations to focus on sustainable goals that matter to him.
Check out Qlik World to learn more about Jesse's goals, view his amazing application, and vote on your favorite!
-
Visualization Showcase, showing the state of what is possible
Let’s face it, having all the visualizations available for Qlik in a single app is a task that is set to failure from the start. Qlik Sense offers doz... Show MoreLet’s face it, having all the visualizations available for Qlik in a single app is a task that is set to failure from the start. Qlik Sense offers dozens of charts out of the box, each one of those comes with several features and customization options that creates a matrix of hundreds of possible outputs. Still today, we sporadically find new and smart ideas to represent data with the good old bar chart in a completely new way.
So, when we started this project, we knew already that it would be forever an incomplete piece. We knew it would only show a fraction of the possible ways of using Qlik Sense Charts, but even though we decided that it was important to showcase some of the Qlik Sense offering around data visualization.
For this project we handpicked some of the new visualizations such as the Org Chart or the Grid Chart, and those that have been massively improved recently as the Line Chart with the new line chart styling.
When working on a Qlik Sense app I believe the theme makes an big difference for it to be successful, with the right theme in place we can make sure the data has the relevance it deserves.
For the Visualization Showcase app I created a theme that focus on the charts removing some of focus from other elements such as the description text. Text and descriptions are important, but in this particular app they are secondary to the more powerful story that each chart has to tell. To achieve this effect, this theme wraps each one of the charts within a container while the text elements land flat in the background. We intentionally guide users to the "highlighted" objects in the screen where they can interact with our glorious charts.
The app contains 23 sheets with examples on how to use any of the showcased charts, some of the chart pages contain multiple variations of a chart, including:
- New Visualizations
- Sankey Chart
- Mekko Chart
- Variance Waterfall Chart
- Radar Chart
- Funnel Chart
- Network Chart
- Org Chart
- Word Cloud
- Bullet Chart
- P&L Pivot Table
- Heatmap Box Plot
- Grid Chart
- Visualization Improvements
- Trellis Chart
- Sparkline
- Trend Lines and Indicators
- Accumulations & Modifiers
- Video Player
- Bar Chart Improvements
- Line Chart Styling
- Pie Chart Styling
- Table Improvements
- Multi KPI
- Mapping & GeoAnalytics
Keep in mind that we will continue to update the app with new and exciting ways of visualizing data. It would never be complete, but we will do our best.
Check the Visualization Showcase here
And don’t forget to check other related resources:

- New Visualizations
-
University Educators love the Qlik Academic Program!
Joining the Qlik Academic Program provides students with amazing analytic opportunities and benefits. But don't take our word, hear from one of our ha... Show MoreJoining the Qlik Academic Program provides students with amazing analytic opportunities and benefits. But don't take our word, hear from one of our happy educators!
Watch our Educator testimonial
-
Do You Want to Build a Snowman?
A Quick RecapWe launched the Hybrid Data Delivery service in June 2021 with the aim of continuously providing enterprise data to your Qlik Cloud Analy... Show MoreA Quick Recap
We launched the Hybrid Data Delivery service in June 2021 with the aim of continuously providing enterprise data to your Qlik Cloud Analytics apps without you writing scripts or code. And I think we successfully achieved that goal. Enterprise data is streamed in two phases and is described in the diagram below.
On the left of the illustration are the enterprise data sources such as relational databases, SAP applications and mainframe systems with a Qlik Replicate appliance synchronizing data changes to a client-managed S3 bucket. This operation is controlled by Qlik Cloud Data Services by creating and running a “Landing Data Asset”.
The second step then uploads the data from the bucket into Qlik Cloud. Once again this is controlled by the Storage Data Asset you create within Qlik Cloud Data Services. The Storage Data Asset takes the data deltas from the S3 bucket, transforms them into a QVD format, then merges the changes into an existing QVD file, or creates a new QVD file if one doesn’t exist. One notable point to highlight is that all the data sets and assets are automatically cataloged and searchable in Qlik Cloud too!
Data Warehouse Data Gravity
OK, onto our big announcement… Fanfare, please. We’ve added Snowflake as a target to the Hybrid Data Delivery Service. Now you can continuously stream enterprise data updates to your Snowflake data warehouse as well as streaming data to Qlik Cloud with the same infrastructure. But let me address why folks want their data loaded into Snowflake before I dive into the expanded architecture.
Why Snowflake?
It should come as no surprise that business leaders now understand the importance of using data and analytics to accelerate digital business initiatives. Indeed, when COVID-19 hit, many organizations that used traditional analytics techniques that relied on vast swathes of historical data realized that they needed to pivot to gain agility. Consequently, many companies deployed cloud data warehouses to support agile analytics as a core business function. The traditional data warehouses were out and the cloud data platforms, such as Azure Synapse, Amazon Redshift, Google Big Query, and Snowflake were most definitely in. In fact, Snowflake was requested by prospects and customers alike and so that’s the warehouse we decided to support first.
The Expanded Architecture
You can see from the diagram below that our Snowflake support is a little different than our support of r Qlik Cloud and uses a different route to land the change data coming from enterprise systems. It’s still a two-step process (1. Landing 2. Merging and Storing ) however the raw data is first “landed” as tables within Snowflake which negates the need for an interim cloud file store. Once the data has been landed then the storage data asset fetches the changed data from the raw Snowflake tables and merges it with the regular Snowflake tables to complete the operation. You may also have noted that Snowflake is also supported on AWS, Azure and Google too.
What’s Next for the Hybrid Data Delivery Service
The final question that you’re probably asking is “What’s next for Hybrid Data Delivery?” I’m happy to describe a general direction but can’t go into specific timelines. Oh, and the legal disclaimer is that “all of this is subject to change.” Generally, we’re looking to support other data warehouses, such as Azure Synapse, Google Big Query, Amazon Redshift, and other targets like Databricks and streaming platforms too. We’re also considering replacing Qlik Replicate with a Qlik-managed data gateway. And finally, we’re investigating alternate data transformation services and rolling out additional data services. So, stay tuned for more innovations to come.
Conclusion
Companies are deploying cloud data warehouse infrastructure to facilitate many of their strategic analytics and data initiatives. Consequently, the Hybrid Data Delivery Service has been enhanced to help customers continually ingest enterprise data into their environment in near-real time without coding or scripting. With Qlik Cloud you can turn raw data into informed action – in one platform that shifts you from using a passive toolset to an active system built to deliver real-time information and drive immediate action.
Resources
Check out the following resources for more information about Qlik and Snowflake.
-
New Qlik Sense System Administrator Certification Exam- Pre-Register Today!
Pre-registration for the new Qlik Sense System Administrator Certification Exam is available - testing begins November 15, 2021. Pre-register now for ... Show MorePre-registration for the new Qlik Sense System Administrator Certification Exam is available - testing begins November 15, 2021. Pre-register now for the best choice of appointment times. This new certification is based on the February 2021 release.
The 2-hour exam costs $250 and can be taken in a local test center or via online proctoring. Learn more about this exam on our Certifications & Qualifications page.
For the most commonly asked questions you can visit our Frequently Asked Questions page. If you have further questions, please send an email to certification@qlik.com.
-
No Users - No Value - Strategies to drive user adoption for Qlik analytics
Our @Bruno_Calver is back with an excellent white paper that focuses on the importance of the user adoption and the user community. When it comes t... Show MoreOur @Bruno_Calver is back with an excellent white paper that focuses on the importance of the user adoption and the user community.
When it comes to the unbiased analysis of data we should always look for blind spots. The same is true when it comes to the success of our analytics projects and that is what this whitepaper is all about. Typically, the focus of an analytics project is the technical task of integrating the data and building applications for analysis. But if users are not compelled to adopt the solution then any potential value is lost. This whitepaper covers a range of suggestions, ideas, resources and tips to improve your change management and internal marketing approach to improve the overall user adoption of your solutions. The goal is to ensure that the value add of analytics is embedded across your organization and part of the everyday work flow of your users.
Read more in the attached document
-
Master's students master Qlik!
Over the course of the next few weeks, I will be finishing delivering a course of lectures to the University of Sheffield. We have three groups of stu... Show MoreOver the course of the next few weeks, I will be finishing delivering a course of lectures to the University of Sheffield. We have three groups of students:
Master’s students studying Management Practices
Undergraduates studying Digital Marketing
Undergraduates studying a Supply Chain Technology module
This shows you just how diverse of a range of students we have who can benefit from the Qlik Academic Program. So far, with the help of our fantastic Solution Architects, we have completed our Lecture and Workshop for our master’s students. We had around 36 in attendance and during their three-hour workshop with our Solution Architects, Marius Popa and Andrew Dinning, they built their first Qlik Sense app! This cohort of students included those who have just finished their undergraduate degrees and have now begun their masters, and some who are already in management positions in their organizations. It was an interactive group who used the time to question and interrogate the information given to them by the Solution Architects and the data they saw in their Qlik sense app. This is an important part of being data literate, not just reading data but also arguing with and questioning what you see. The fact the students got so involved was beneficial to their learning, it also challenged us to demonstrate the wonders of Qlik and show off all the features we believe set it apart from other products on the market. Such as its ability to reconcile data from different sources.
We have also completed the first guest lecture for the students completing their undergraduate degree in Digital Marketing. Next up we have a workshop with all 240 of the students in which Marius and Andrew with take them through building their first app. This will be a blend of students attending both virtually and in person, on top of that it is our biggest UK Academic Program lecture to date! But we enjoy the challenge and are especially excited for this one. Stay tuned for the blog on this session!
Want to learn more about the Qlik Academic Program? For more information or to apply visit qlik.com/academicprogram