Unlock a world of possibilities! Login now and discover the exclusive benefits awaiting you.

Analytics & AI
Forums for Qlik Analytic solutions. Ask questions, join discussions, find solutions, and access documentation and resources.
Data Integration & Quality
Forums for Qlik Data Integration solutions. Ask questions, join discussions, find solutions, and access documentation and resources
Explore Qlik Gallery
Qlik Gallery is meant to encourage Qlikkies everywhere to share their progress – from a first Qlik app – to a favorite Qlik app – and everything in-between.
Qlik Community
Get started on Qlik Community, find How-To documents, and join general non-product related discussions.
Qlik Resources
Direct links to other resources within the Qlik ecosystem. We suggest you bookmark this page.
Qlik Academic Program
Qlik gives qualified university students, educators, and researchers free Qlik software and resources to prepare students for the data-driven workplace.
Recent Blog Posts
-
Pre-recorded Guest Lectures by Qlik to Support the University Digital Revolution
The Digital Revolution is first on the list of the 8 biggest challenges for universities in 2021 according to Anna Britten’s recent article for Univer... Show MoreThe Digital Revolution is first on the list of the 8 biggest challenges for universities in 2021 according to Anna Britten’s recent article for University Business. Even though university staff and students have had time to adapt to the new digital way of working throughout 2020, there are still plenty more things to consider for the future. Like which aspects of teaching should remain online and what should return to face to face? And which parts of the universities need to catch up with the digital transformation?
While the teaching staff work through these questions, and as many universities remain closed for now, here at Qlik we have been thinking of ways in which we can help to lighten the load of educators. We want to continue to inspire students to become data literate even if we cannot see them on campus in person. To facilitate this, we have pre-recorded a guest lecture, broken down into short segments which cover:
- The importance of Analytics
- An introduction to Qlik and Qlik Sense
- An introduction to the Qlik Academic Program
- Qlik customer stories and demos.
As well as the guest lecture, there is also a hands-on workshop that the students can access to build their first application in Qlik Sense.
These resources are available to all our educator members of the Qlik Academic Program. They have already been used in teaching at University of Sheffield, University of Liverpool and Henley Business School and we hope that many others will take advantage of them.
If you are a university educator and would like access to the guest lecture, in addition to free Qlik software, on demand training and qualifications, sign up today at qlik.com/academicprogram.
-
Featured Content Friday – Qlik Sense + Scatter Plot chart + Animator Extension =...
Hello Qlik Users!It’s our first Featured Content Friday of 2021!We are holding on to the holiday spirit a bit longer with this entry bySergey of Qurio... Show MoreHello Qlik Users!
It’s our first Featured Content Friday of 2021!
We are holding on to the holiday spirit a bit longer with this entry by
Sergey of Qurious Solutions!
Sergey is a principal consultant and has been working with Qlik products for an incredible 12 years. When asked what his favorite thing about Qlik is, Sergey responded:
Check out Sergey's creation:
Sergey created this visualization with Qlik Sense. He made great use of the scatter plot chart to create the tree and the animator extension in the Qlik Dashboard bundle to make it flicker! He also provided the script in his post so you can create your own.
Our whole team was impressed with this visualization. And if points were given, Sergey would get more for creating a GIF (we love GIFs, hint, hint)! 😉
*The information in this post is provided as-is and to be used at own discretion. Depending on tool(s) used, customization(s), and/or other factors ongoing support may not be provided by Qlik Support.
Would you like to be spotlighted in a future post? See our Featured Content Friday Revamp for more information on submitting your dashboards, screenshots, ideas, videos, workarounds, how-to’s and more!
Thank you for being a part of the Qlik Community and for choosing Qlik!
Kind regards,
Qlik Digital Support
-
Redefining the Week Numbers
Week numbers are often used in calendars, although not as commonly in some countries as in others. In northern Europe, it is very common to refer to a... Show MoreWeek numbers are often used in calendars, although not as commonly in some countries as in others. In northern Europe, it is very common to refer to a week by its number, but in many other countries it is not used at all. Just as with the week start, week numbers are defined differently depending on country, so you may need to add code in QlikView to generate your own week numbers.
So, how do you count the weeks? Is Jan 1st always part of week one? Not necessarily.
If week 53 starts as late as Dec 28th, does Jan 1st also belong to week 53? Sometimes, yes.
There is a definition made by the International Organization for Standardization (ISO 8601) that QlikView uses to calculate week numbers. It states that
- The week starts on a Monday.
- A week is always unbroken.
I.e. some years week 1 starts already in December, and in other years week 52 or 53 continues into January. - Week 1 always contains Jan 4th.
Or, differently put: Week 1 always has at least 4 days in January. A third way to say the same thing is: The first Thursday of the year always lies in week 1.
These three bullets define the three parameters you need to define general week numbers:
Set vCal_FD = 0; // First Day of the week {0=Mon, 1=Tue, ... , 6=Sun}
Set vCal_BW = 0; // Broken Weeks allowed {0=No, 1=Yes}
Set vCal_RD = 4; // Reference day = This day in Jan defines week one {1..7}How the week start - the first parameter - influences the week number can be seen in the following table. It shows how the week number would change for the days around New Year 2013 if different week starts are used. The other parameters are kept constant.
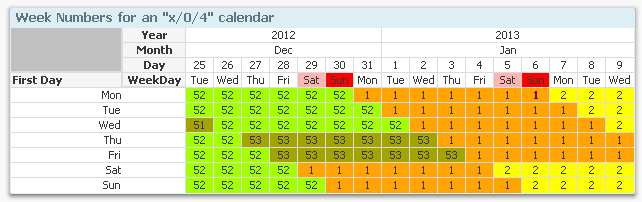
The second parameter concerns whether or not broken weeks should be used. If they are, a new week number will always be used on Jan 1st, and as a consequence the first and last weeks of the year can have less than 7 days.

And finally, the third parameter, the reference day. It defines which day that always belongs to week 1. In the table below, the reference day is 4; hence Jan 4th always belongs to week 1, which can be clearly seen. This number also defines the minimal number of days of week 1 that fall in the new year.
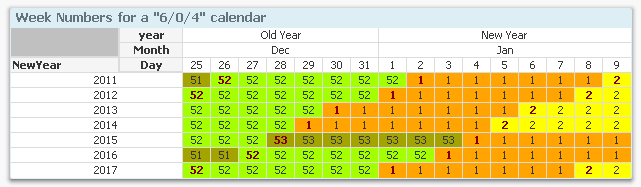
The ISO standard is thus a 0/0/4 week numbering. In countries where Sunday is used as first day of the week, I have seen several different variants: 6/1/1, 6/0/3 and 6/0/4.
If you copy the above parameters to your QlikView script and the following lines to your Master Calendar definition, you can redefine the week numbers any way you want:
Load *,
Div( Date - WeekStart( WeekYearRefDate, 0, $(vCal_FD) ) + 7, 7 ) as WeekNumber,
Year( WeekYearRefDate ) as WeekYear;
Load *,
Date( YearStart( If( $(vCal_BW), Date, WeekRefDate )) + $(vCal_RD) - 1) as WeekYearRefDate ;
Load *,
Date( WeekStart( Date, 1, $(vCal_FD) ) - $(vCal_RD) ) as WeekRefDate ;The fields WeekYearRefDate (Jan 4th in the ISO definition) and WeekRefDate (the Thursday of the week in the ISO definition) are really not necessary, but the expressions become somewhat simpler if these are used.
Until we get a general week numbering functionality built into the QlikView standard functions (and, yes, we are looking into this) you will have to redefine the week numbers using the above script. Good luck!
Further reading related to this topic:

-
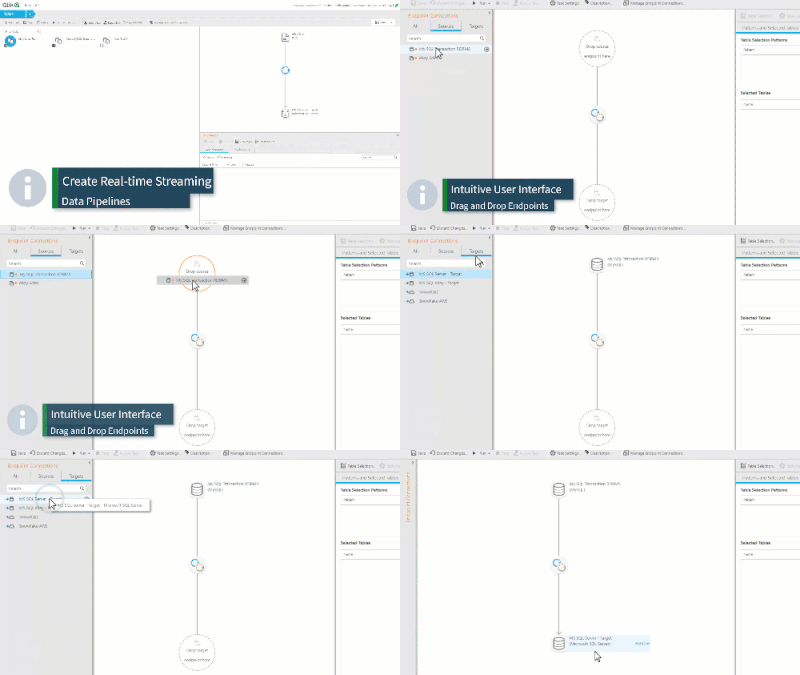
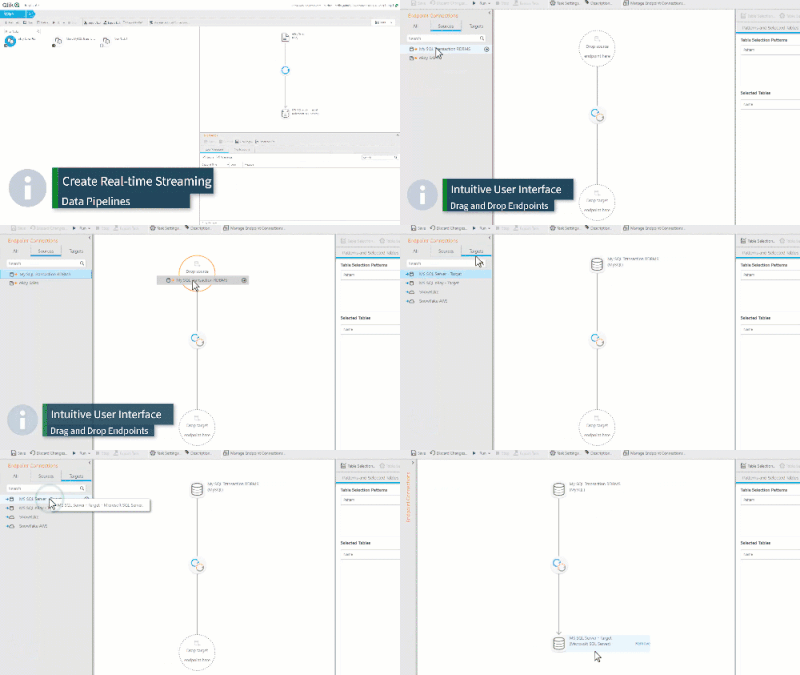
Qlik Replicate - Do More with Qlik - This Thursday - Sign Up Now!
This Thursday at 2PM ET - I'll be hosting our first Do More with Qlik Session of the year, introducing you to Qlik Replicate. Take a brief look at wh... Show More
-
Qlik Replicate - Do More with Qlik - This Thursday - Sign Up Now!
This Thursday at 2PM ET - I'll be hosting our first Do More with Qlik Session of the year, introducing you to Qlik Replicate. Take a brief look at wha... Show MoreThis Thursday at 2PM ET - I'll be hosting our first Do More with Qlik Session of the year, introducing you to Qlik Replicate.
Take a brief look at what Qlik Replicate can do and join me LIVE where I will demonstrated real-time automated data ingestion and update. Hope to see you there!
Registration and resources links below.
-
Insight Advisor Chat and Business Logic Resources
Since we released our new augmented analytics features, Insight Advisor Chat and Business Logic, I have presented these topics a few times and created... Show More
Since we released our new augmented analytics features, Insight Advisor Chat and Business Logic, I have presented these topics a few times and created / gathered some resources to showcase the various capabilities to show you how they work under the covers. Since then I felt it was important to compile these resources and share them with you. Take a look and let me know what you think. These capabilities are available in both Qlik Sense Enterprise SaaS and Windows Client-managed.
Have questions? Please post them in the comments below.Insight Advisor Chat
Insight Advisor Chat offers a fully conversational, natural language analytics experience in Qlik Sense. Multi-language natural language processing (NLP) understands user intent, and natural language generation (NLG) delivers added insight and perspective for a deeper understanding of your question. Insights include auto-generated charts, narrative insights, observations, and more. Users can dive directly into search-based visual analysis for further exploration. And because it works across Qlik Sense apps, it allows people to find the right insights even if they don't know where to look. Current languages supported with NLP include English, French, German, and Russian. And the Windows version supports integration with Microsoft Teams and Slack.
Business Logic
Business Logic provides a robust business logic layer that incorporates business rules and metadata to customize and guide the behavior of Insight Advisor when generating insights and interacting conversationally with users. It includes the ability to logically group fields, classify data, specify default behaviors, define preferred relationships, and more. Users can create calendar periods to define how measures should be filtered, aggregated, and compared based on preferred timeframes. And, they can customize natural language processing, including defining vocabulary rules and synonyms for more natural interaction.
Resources
- Augmented Analytics: - Do More with Qlik Session (TOC is in YouTube video description)
https://youtu.be/T5_-rED-5VM - Building Logical Models
https://www.youtube.com/watch?v=pPD_t0_dhwQ
(PDFs attached to blog) - Ask Insight Advisor.pdf
- Business Logic.pdf - attached
- Natural Language Query Features Guide.pdf
I hope these are helpful and please let me know if you have any questions.
Regards,
Mike Tarallo
- Augmented Analytics: - Do More with Qlik Session (TOC is in YouTube video description)
-
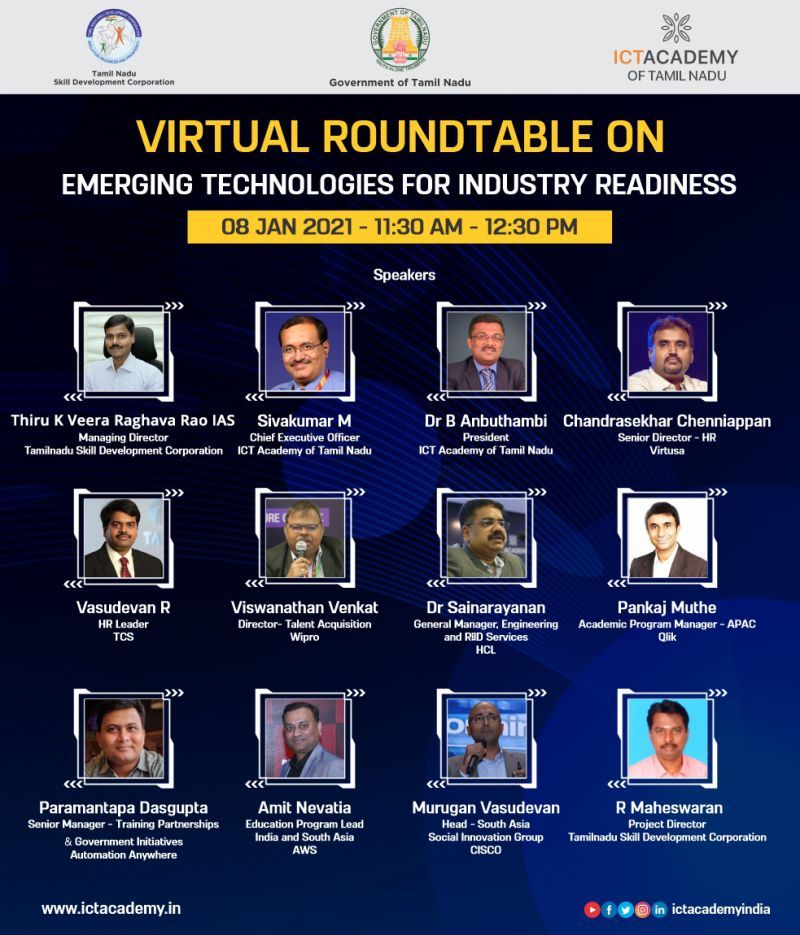
Round Table on Skills on Emerging Technologies
On January 8th, I was invited by ICT Academy as a Speaker for a round table on "Skills on Emerging Technologies - Industry Readiness of Graduates. IC... Show MoreOn January 8th, I was invited by ICT Academy as a Speaker for a round table on "Skills on Emerging Technologies - Industry Readiness of Graduates. ICT Academy is an initiative of the Government of India in collaboration with the state Governments and industries. It is a not-for-profit society, and a joint venture under the Public-Private-Partnership (PPP) model. ICT Academy was started to meet the skill requirements of the industry and generate more employment especially in tier 2 and 3 towns, the rural parts of India
The objective of the Round table was to understand from Industry Experts and HR Leaders on the needs for skilling the graduates / final year students on various emerging technologies. Based on the inputs during this Round Table, the Government shall take necessary steps in forming strategy towards skilling the Graduates with an outcome of Employability.
There were 8 experts from different industries in this Round Table and each expert shared perspectives on the following points:
- Emerging Technologies for Entry level graduates.
- Recruitment Trends 2021 for emerging Technologies
- Recruitment trends for skilled entry level graduates in areas of Cloud, Data Science, RPA, Cyber Security, AI, ML, DL and Blockchain
- Entry Level Requirements for such emerging technologies
I had the opportunity to talk about data analytics as a career and its scope as a skill for graduates, irrespective of their background. In fact, the training and qualifications offered by the Qlik Academic Program is meant for any graduate who wishes to get skilled in analytics. Many students who are part of this program are from diverse disciplines including engineering, commerce, science, humanities, medicine etc.
In a discussion with the experts during the round table, the moderator asked about the top emerging technology for graduates that will generate a lot of demand and many of them viewed data analytics as their top choice. Needless to mention, due to the huge amount of data being generated with the increase in connected devices, analytics has a bright future as a career.
To learn how you can earn your qualifications and certification in data analytics, visit qlik.com/academicprogram or write an email to academicprogram@qlik.com to know more
-
Maximizing Development Space in Qlik Sense Using Variables
As Qlik developers, we are always looking for ways to maximize the development real estate in our apps. And sometimes, we (well me), tend to overcompl... Show MoreAs Qlik developers, we are always looking for ways to maximize the development real estate in our apps. And sometimes, we (well me), tend to overcomplicate things in order to accomplish the task at hand.
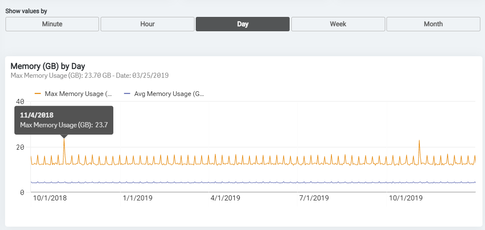
For example, I was recently involved in a project to develop a Qlik Sense app where the ask was to create visualizations in which the dimensions were variations of a date. Users could choose to see the data by minute, hour, day, week, or month. I immediately started thinking of the potential ways to handle this in Qlik Sense.
My first thought was to create a chart for each of the date slices and then, using containers, pull each of the 5 visualizations into the container and finally, using conditional show/hide rules, show only one visualization at a time based on the user selection. When giving this approach more thought, I realized that I would have to create over 100 visualizations and store them as master visualizations. That was not going to work and, quite frankly, there had to be a better way.
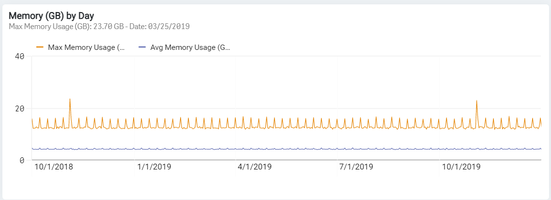
After some thought, and collaboration with my teammates, I then decided that creating a calculated dimension was a more viable option. This approach allowed me to use only a single visualization for each measure that I was looking to display. Overall, it was a quicker and lighter solution to develop.This is how I built it.
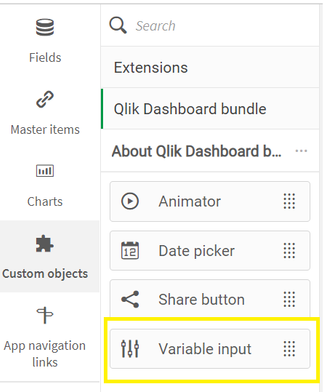
First, I used the Variable Input object to create the user defined date selector. This was good for 2 reasons. First, the user can only select one value at a time and second, the variable allowed me to customize the object based on the corresponding value of the variable.
I created the variable vViewGroup and in the Variable Input Object, I selected to show the variable labels as buttons and display them in a row. I then created the Labels to display in the object and their corresponding values to populate the variable.This is how the Variable Input Object displays on the sheet.
Once that was created, it was time to develop the visualization.
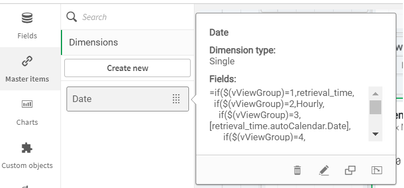
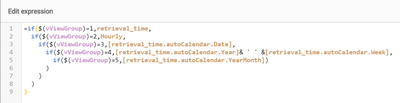
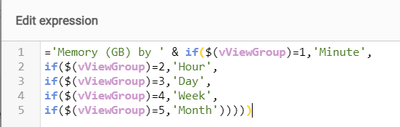
I had to first create a calculated dimension which used the vViewGroup variable to choose the date type.
Using a standard nested IF statement, I created the Date calculated dimension that allowed me to switch the dimension for the visualization on the fly based on the user’s input.
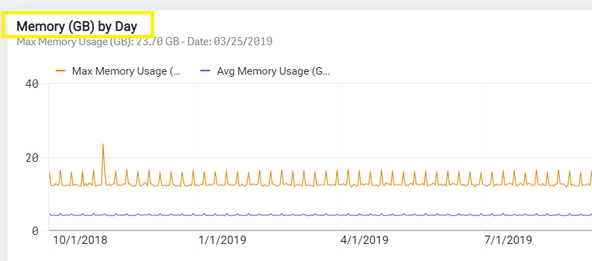
The final area that needed to change based on the user’s input was the visualization title.
In the Title property, I simply used the same nested IF statement from the calculated dimension, as part of the Title expression to Show the ‘Memory (GB) by’ and the user selected Date dimension.
That was it! I had created a single object with a variable dimension to show the data values against any of the 5 different date types.Using this method to create the visualization saved me loads of development time and will help in the future should any of the objects need to be edited.
I hope you find this simple, yet powerful, approach useful in your future app development. Happy Qlikking!
-
Qlik Academic Program Webinar
Do you need a break from remote learning? Take a minute and join us for the Qlik Academic Program webinar! This program offers educators and studen... Show MoreDo you need a break from remote learning? Take a minute and join us for the Qlik Academic Program webinar! This program offers educators and students free analytics software, a year of training, certificates, and much more! Aren't sure yet? Join us for a live webinar to learn more.
The webinar will include a quick tour of our resources; a short introductory demo of the Qlik software; and instructions on how to sign up for the program.
When: Tuesday, January 19th at 11:00AM EST
Registration: Join us by registering here. (Password is Qlik123)
Can't attend? No problem, just register and we will send you a recording!

-
New year, new Qlik Academic Program web page!
Many of us are starting back to work this week after a much needed break at the end of 2020. Meanwhile our web team at Qlik were working their magic t... Show MoreMany of us are starting back to work this week after a much needed break at the end of 2020. Meanwhile our web team at Qlik were working their magic throughout December to get our new Academic Program web page up and running.
As well as giving us a fresh look and feel, the page has plenty more information about our great free program for university students and educators. At just a glance you can now get a complete overview of all of the features such as free software, training and qualifications that are provided to our members. Students can learn how analytics skills and data literacy help them to stand out in the job market, while educators delve into our array of teaching materials to enable them to integrate Qlik into the classroom.
And don't forget to check out our brand new video at the top of the page which gives a quick overview of what we do in just 60 seconds.
So what are you waiting for, head over to qlik.com/academicprogram to check out all of the updates and to apply!
-
Rounding Errors
“If you use equality as a condition when comparing floats, I will flunk you!” I can still hear the words of the Professor in my first programming cl... Show More“If you use equality as a condition when comparing floats, I will flunk you!”
I can still hear the words of the Professor in my first programming class when studying for my engineering degree. The threat was very real – he meant it – and the reason was of course the fact that you cannot (always) represent decimal numbers in an exact binary form.
For example, we would never dream of writing a condition
If( x = 0.3333333 , … )
when we want to test if x equals a third. Never. Because we know that a third cannot be represented exactly as a decimal number. No matter how many threes we add to the number, it will still not be exact.
But it is not uncommon that people make comparisons with an exact decimal number, similar to
If( x = 0.01 , … )
thinking that it is a valid comparison, although it leads to exactly the same problem as the previous comparison! This becomes obvious if you look at the hexadecimal representation of 0.01:
0.01 (decimal) = 0.028F5C28F5C28F…. (hex)
The sequence …28F5C… is repeated an infinite number of times, but since QlikView uses a finite number of binary digits (all according to the IEEE standard), QlikView will internally use a “rounded” number.
So what are the consequences? Well, QlikView will sometimes deliver the “wrong” number as result. Examples:
Ceil( 0.15, 0.01 ) will return 0.16
Floor( 0.34, 0.01 ) will return 0.33
0.175*1000 = 175 will return FALSE
Time( Floor( Time#( '04:00:00' ),1/24/60/60 )) will return 03:59:59What you see are not errors in QlikView. And they are not errors in IEEE 754. Rather, they represent errors in the expectation and usage of binary floating point numbers. Once you understand what binary floating point numbers really are, it makes perfect sense. It's simply that some values cannot be exactly represented as binary numbers, so you get rounding errors. There's no way around it.
Should you want to investigate this yourself, I suggest you start with the following script that generates 100 numbers and their rounded counterparts. In five cases the Ceil() function rounds "incorrectly" and generates a "Diff" different from zero:
Load
Num(Rounded,'(HEX) 0.000000000000000','.',' ') as RoundedHEX,
(Round(100*Rounded) - PartsPer100)/100 as Diff,
*;
Load
Ceil(PartsPer100/100, 0.01) as Rounded,
*;
Load
RecNo() as PartsPer100
Autogenerate 100 ;So, what should you do?
First of all, you should realize that the rounding errors are small and usually insignificant. In most cases they will not affect the result of the analysis.
Further, you could avoid rounding with Floor() and Ceil() to sub-integer fractions.
Also, you could convert the numbers to integers, because the errors will only appear if the numbers can have sub-integer components. For instance, if you know that you always deal with dollars and cents, you could convert the numbers to (integer) cents:
Round( 100*Amount ) as Cents
Or if you know that you never deal with time units smaller than seconds:
Round( 24*60*60*Time#( Time, 'hh:mm:ss' ) ) as Seconds
And finally, you should never use equality as a condition when comparing floats. Use greater than or less than. My professor isn’t here to flunk you, but rest assured: In his absence, QlikView will do it for him.
-
A NEW "NPRINTNG MASTER CONSOLLE
New Function of my own QLIK Framework...My new Dashboard to simultaneously explore all the information available ... Apps, Connections, Filters, Rules... Show MoreNew Function of my own QLIK Framework...
My new Dashboard to simultaneously explore all the information available ... Apps, Connections, Filters, Rules, Conditions, Reports, Users, Scheduling and more...
-
Asian Development Bank and Qlik Launch COVID-19 Challenge
Qlik's Change Our World Program has partnered with the ADB (Asian Development Bank) to launch a COVID-19 challenge available to the public!To learn mo... Show MoreQlik's Change Our World Program has partnered with the ADB (Asian Development Bank) to launch a COVID-19 challenge available to the public!
To learn more about the criteria and how to begin, visit COVID-19 challenge
This challenge is open to anyone, you do not have to be part of the Academic Program. However, if you are a educator or student then we recommend applying to the program for a year of Qlik Sense software and training!
For questions email changeourworld@qlik.com
-
Natural Language Processing (NLP)
Quickly learn how Qlik unlocks analytics for more types of users with Natural Language Processing. Natural Language processing is an analytics feature... Show MoreQuickly learn how Qlik unlocks analytics for more types of users with Natural Language Processing. Natural Language processing is an analytics feature available with our Insight Advisor – it is more than just a search box..watch the video to learn more. Comments, questions? Leave them below. I want to hear from you.
-
Qlik Sense at the North Pole
The holidays are approaching, and Santa is almost ready to deliver toys to children around the world again! But just how does Santa run such an enormo... Show MoreThe holidays are approaching, and Santa is almost ready to deliver toys to children around the world again! But just how does Santa run such an enormous enterprise and continue to scale to meet global demand each and every year? With the help of Qlik Sense, of course! From supply chain to operations to distribution, Santa uses Qlik Sense to enable all aspects of his organization to make data-driven decisions.
Since it’s that time of year, let’s look at how Qlik Sense is used on the shop floor in Santa’s Workshop to monitor and improve production. Qlik Sense is available to shop managers and teams on mobile devices throughout the shop floor, and real-time data and alerting enables timely action to any changes. Below are four real-world examples from Santa’s workshop this year.
Click to open the "Santa's Workshop" Qlik Sense app
All Wrapped Up
On September 26 the Jingle, Twinkle, Merry, and Peppermint Teams were trending on average 5% below target. Qlik Sense alerted management that the teams were not meeting production targets and that downstream bottleneck time for the three teams was more than 3x higher than average, so a manager went to investigate the packaging department. What they discovered was quite a scene! One of the newer elves, in the midst of trying to prove himself and working as fast as he possibly could, had gotten himself so tangled up in gift wrap and tape that the other packaging elves were having a frightfully difficult time getting him free of the mess. The manager quickly went and got Grandma Elf, who is particularly apt at solving such crises, and packaging was then resumed, relieving the downstream bottleneck for the Jingle, Twinkle, Merry, and Peppermint Teams, and bringing production back in line with targets.
Industrious Elves
On October 11, Jingle Team’s production dropped to more than 16% below target. When the manager received an alert from Qlik Sense and checked to identify a cause she discovered that personal break time for the team was 8x more than average for the day. She immediately went to talk to the team to discuss the finding, but they were not at their workstations or the candy bar break room. She eventually discovered the entire team outside engaged in an intense and prolonged snowball fight. While elves are generally an industrious bunch, they love a good snowball fight, and the Jingle Team had lost track of time amidst the fierce battle. After the manager jumped in to toss a few snowballs herself and show the elves who’s boss she got the team back to work and production back on track.
North Pole Blues
Then on November 19, Qlik Sense alerted that the production of both the Jingle Team and the Holly Team was more than 11% under target. Downtime caused by an upstream bottleneck was more than 5x average for both teams. Turns out that having your workshop in the North Pole presents some unique logistical challenges, and essential materials due to arrive that morning were held up in transit after Jack Frost decided it would be a good day for an impromptu artic blizzard. Luckily, the real-time alerting of Qlik Sense enabled the problem to be identified quickly, and production on the two lines was shifted to use available resources and quickly get production levels back up to capacity.
A Sticky Situation
On December 16, less than ten days out from Christmas Eve during the final push to reach production goals for the year, Qlik Sense alerted that the Marshmallow Team was operating at almost 12% under their daily target. Analyzing the data revealed that repair downtime was 5.5x longer than average, so a specialist repair team was sent to investigate. The repair team discovered cotton candy in the machine gears, causing increasingly frequent shutdowns, a sticky situation to say the least. The repair team got to work right away, licking the machine clean despite the health department protest, and the Marshmallow Team was back to full production just two days later.
-
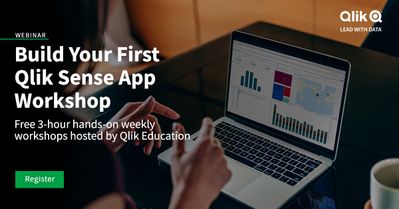
"Build Your First Qlik Sense App" Free Workshops continue in the new year!
Join us for the upcoming, hands-on workshops to learn how to build a Qlik Sense application and experience some of the functionality and add on produc... Show MoreJoin us for the upcoming, hands-on workshops to learn how to build a Qlik Sense application and experience some of the functionality and add on products that will increase data awareness and availability in your company.
You will also learn how to accelerate your ramp up and implementation of Qlik Sense through various Qlik training options...with a special offer at the end of the workshop. 3-hour sessions will be held weekly in multiple time zones.
Space is limited, so register today using below link to secure your spot!

-
The Qlik Academic Program celebrates record enrollment numbers in 2020
The Qlik Academic Program is celebrating its highest growth year ever! In 2020, the program has seen more than double growth in student membership num... Show MoreThe Qlik Academic Program is celebrating its highest growth year ever! In 2020, the program has seen more than double growth in student membership numbers over 2019. This is a significant achievement in just a 12-month period and is partly thanks to the record number of educator applicants that we have also received this year.
As for everyone, this year has been an uncertain one for the program and we were unsure how distance learning at universities would affect us. However, thanks to the fact that the free Qlik Sense analytics software that we offer is available in both cloud and desktop versions, and all our training resources and qualifications are available online, this enabled our members to continue using our resources even when teaching or learning from home.
I understand from many educators that I have spoken to, that the pivot to online has been challenging and in many instances has led to an increased workload. Fortunately, we have been able to continue to support in-class teaching by delivering guest lectures and workshops virtually and we have also provided pre-recorded guest lectures which have proven to be very popular. In addition, we saw a surge in attendance during our most recent academic program webinar in November with 870 registrants and 227 live attendees, making it one of the more popular webinars of 2020 across the whole of Qlik.
We are so thankful for the continued and growing partnerships that we have with universities and the increasing number of students who are improving their data literacy and future job prospects through the free resources that we offer.
If you would like to find out more about the program or to apply you can visit qlik.com/academicprogram
-
Pauline Guillet - Datathon Winner, C40 Cities
As the winner of the datathon, I wanted to share the ideas of the app and the information I learned. Hope you will enjoy it ! -
Community Redesign - Phase 1
Hello Members! Two years after the re-platforming and relaunch of our Community, which now serves more than 114,000+ members, we are rolling out so... Show MoreHello Members!
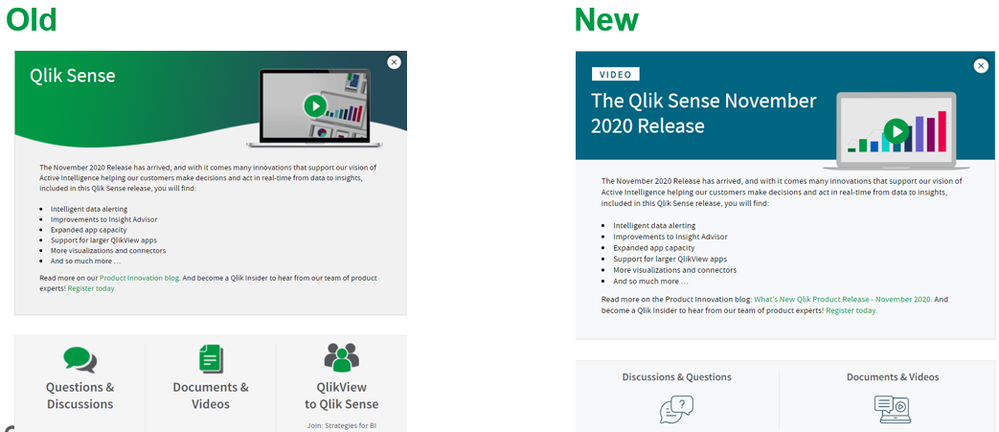
Two years after the re-platforming and relaunch of our Community, which now serves more than 114,000+ members, we are rolling out some design improvements. The changes will offer an updated look and feel and ultimately, once fully completed, an improved user experience. Today, we rolled out a first set of updates to the 'inside' of the community.
What changed:
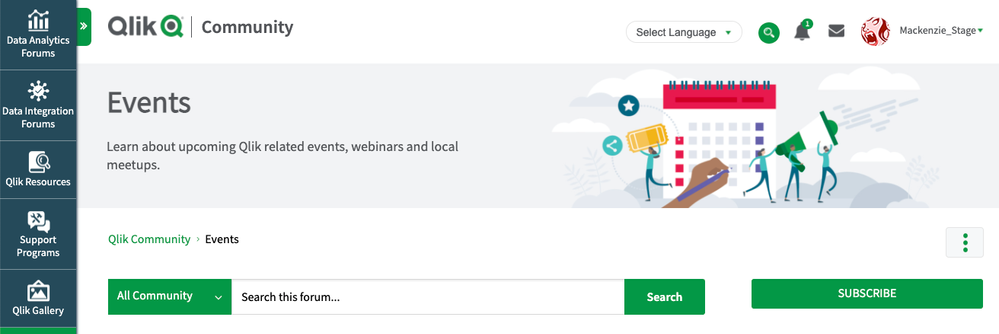
1. New Banner Images (site-wide)
2. New cards and action buttons - to category level pages ( aka 'landing pages')Backdrop:
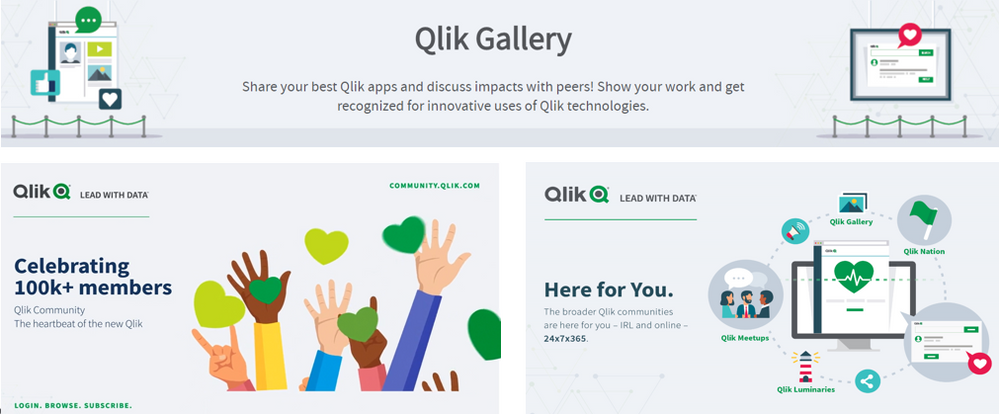
The design concept was initially born with the launch of our Qlik Gallery and was later incorporated into many of our social campaigns, such as these:If you browse across the community you will see banner images have been updated site-wide.
Some Examples:We also updated the cards and action buttons that sit on category level pages:
What is a category page:
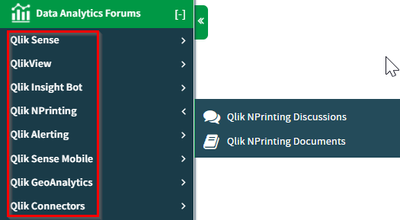
Categories are the highest-level nodes in our community and are a useful tool for organizing content. From a navigation perspective you can find them as this screenshot below demonstrates. You can subscribe to a category page and we encourage you to do so!What's next:
The next round of design updates are SO EXCITING - at least for this geek 🙂Coming to Qlik Community in January 2021:
- Redesigned Home Page
- Improved Navigation
- More modern use of icons site-wide
- Changes to colors, font - all Qlik brand-approved
Then there is one more really big surprise that I just know you will all LOVE !!! 😍
I have to leave just one surprise... !If all goes as planned we have a lot in store for you in 2021.
See you online -
Melissa
Director, Qlik Community