Unlock a world of possibilities! Login now and discover the exclusive benefits awaiting you.

Analytics & AI
Forums for Qlik Analytic solutions. Ask questions, join discussions, find solutions, and access documentation and resources.
Data Integration & Quality
Forums for Qlik Data Integration solutions. Ask questions, join discussions, find solutions, and access documentation and resources
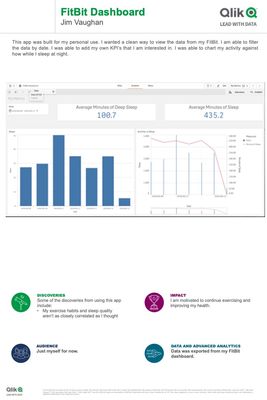
Explore Qlik Gallery
Qlik Gallery is meant to encourage Qlikkies everywhere to share their progress – from a first Qlik app – to a favorite Qlik app – and everything in-between.
Qlik Community
Get started on Qlik Community, find How-To documents, and join general non-product related discussions.
Qlik Resources
Direct links to other resources within the Qlik ecosystem. We suggest you bookmark this page.
Qlik Academic Program
Qlik gives qualified university students, educators, and researchers free Qlik software and resources to prepare students for the data-driven workplace.
Recent Blog Posts
-
Trellis Chart
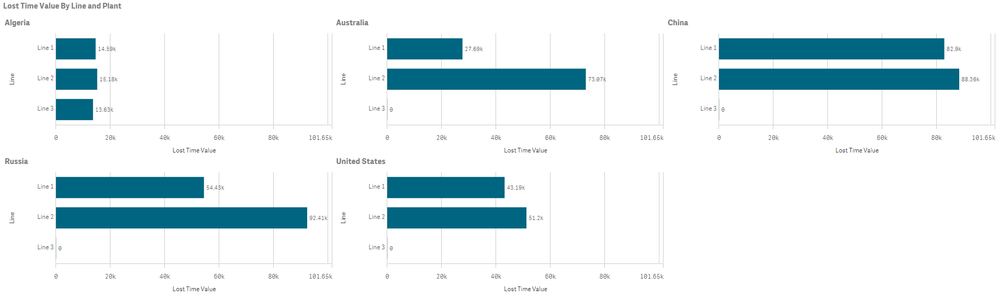
With the June 2019 release of Qlik Sense, the trellis chart is now a visualization we can add to our apps right out-of-the-box. With this release, the... Show MoreWith the June 2019 release of Qlik Sense, the trellis chart is now a visualization we can add to our apps right out-of-the-box. With this release, the Trellis container extension is part of the Qlik Visualization bundle allowing us to show a master visualization across various dimension values all at once. Here is an example of what a Trellis chart looks like:
In the Trellis chart above, Lost Time Value by Line for each Plant is being displayed. The master visualization is a bar chart with the dimension Line and the measure for Lost Time Value. When I add this master visualization to the Trellis container along with the Plant dimension, I can see the bar chart for all 5 plants. This allow me to compare the time lost value for each plant side by side. The Trellis chart is created by adding the Trellis container from the Qlik Visualization bundle to a sheet and adding a dimension and master visualization. One adjustment I had to make since I was using an expression for my measure was to add a label for the measure in the master visualization. This prevented the whole expression from being displayed as the label.
There are several Trellis options in the properties section that are quite helpful in customizing how you want the Trellis chart to look. In the chart above, I set number of columns property to 5 so that all charts could be displayed side by side. I also set the dimensions titles property to left side only. This shows the dimension label (Line 1, Line 2 and Line 3) on the left most chart only providing more space and removing redundant labels that are not necessary in this layout since the charts are side by side. Other title options included right side only, top only or bottom only. There is also the option to adjust the measure labels by setting the measures titles property but I opted to keep this set to chart default and show the label on each chart.
Here is another example of how the Trellis charts could be displayed:
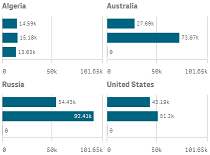
In this example, I set the number of columns property to 3 and I kept the dimensions titles and measure titles properties set to the default, chart default, so that the x and y axis labels appear on all the charts. With this layout, if I set the dimensions titles to left side only, the top left chart would be the only chart with a dimension label and I did not think it would be clear to the user that it applied to all the charts.
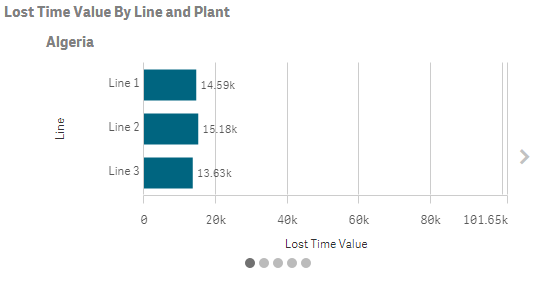
There are many other properties that can be set for the Trellis container such as slide mode. On mobile devices, slide mode is on and shows one Trellis chart at a time. The user can swipe to get to the next chart. Here is what the Trellis container with slide mode on looks like. Notice the arrow on the right that can be used to go to the next chart and the dots at the bottom to show that I am on the first of five charts.
Check out Qlik Help and the Trellis Container video to see all the ways the Trellis container can be customized. To learn more about the other new features in the Qlik Sense June 2019 release, check out the What’s New – Qlik Sense June 2019 app on Qlik’s Demo Site and the What’s New video. These resources also highlight the best practices you should consider when creating master visualizations that will be used in a Trellis container.
Thanks,
Jennell -
Accumulative Sums
We all use QlikCommunity when we need an answer for a QlikView question. We post a question and get an answer, usually in minutes, leveraging the expe... Show MoreWe all use QlikCommunity when we need an answer for a QlikView question. We post a question and get an answer, usually in minutes, leveraging the expertise of 91,000+ QlikView users! QlikCommunity is the most-visited and active user community in the BI industry.
I also use QlikCommunity. And sometimes not to get an answer for a question but to think about new ways of doing things by reading the answers on the existing posts. So I have been curious about the answers on calculating the accumulative sums in QlikView and did a search on QlikCommunity. There are many answers provided as expected. Here is one way of achieving it by using rangesum() and aggr() functions.
It is a very common requirement to display the accumulative sum of a chart metric. The easiest way of doing this is to use the accumulate setting under the expressions tab of chart property.
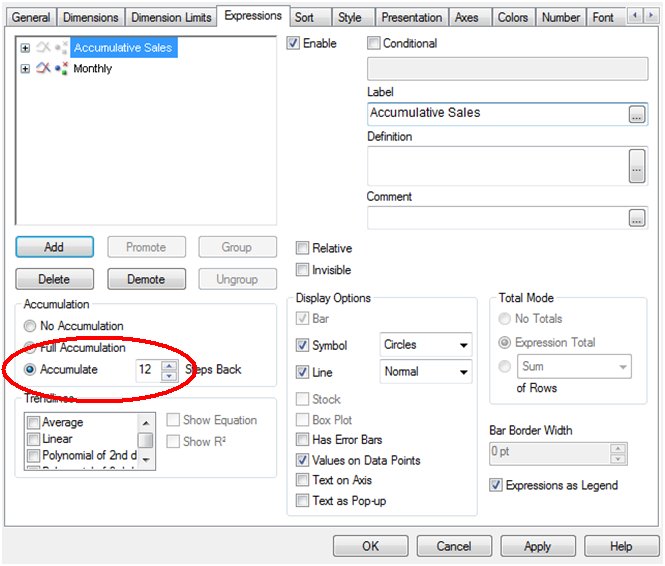
Figure 1. Accumulate option on chart property
With this setting, the values of the selected metric will be accumulated. But sometimes, the requirement is to have the first data point accumulated as well. For example, to show the accumulated sales for 12 months where the first month displayed should be the sum of the previous 12 months and the following months should accumulate on top of this value by adding one month at a time. One way of achieving this is to use the rangesum() and the aggr() functions together.
Let us first look at Rangesum(). It is a range function that returns the sum of a range of 1 to N arguments Together with the above() function, you can calculate the sum of the last 12 months;
rangesum( above( sum(Sales),0,12) )
This expression will return the sum of sales evaluated for each month as they appear on the 12 rows above the current row.
The next step is to combine RangeSum() with the aggr() function to aggregate the sum of sales for the 12 months at the month level.
sum( aggr( rangesum( above( sum(Sales),0,12) ),Month))
Using the Aggr() function, it is possible to calculate the accumulated sum for any other dimensions in addition to the time dimension. For example, the 12 months accumulated sum of sales by store can be calculated as;
sum( aggr( rangesum( above( sum(Sales),0,12) ),Month, Store))
Optionally you could also clear any selections on the month field as the calculation should reflect the accumulated sales for the previous 12 months, regardless of selections. This is achieved by using the set analysis “{$<Month>}”.
sum( aggr( rangesum( above( sum( {$<Month>} Sales),0,12) ),Month))
One important thing to notice with this solution is the sort order inside the aggr() function. If the sort order is not correct, the aggregated sum of the 12 months would not be correct. QlikView always sorts the groupings (in this case the groups defined by the second parameter of the aggr() function) according to the load order. If the data is sorted by date during the load, QlikView will use this order and the aggr() function will show the correct totals for the desired time frame.
In summary, the accumulation option on the expression tab is the simplest way of achieving accumulations, but the use of rangesum() and aggr() functions are alternative ways of accumulating the data in more complex situations.

-
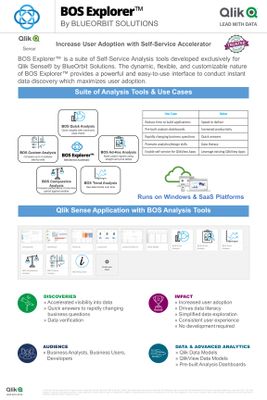
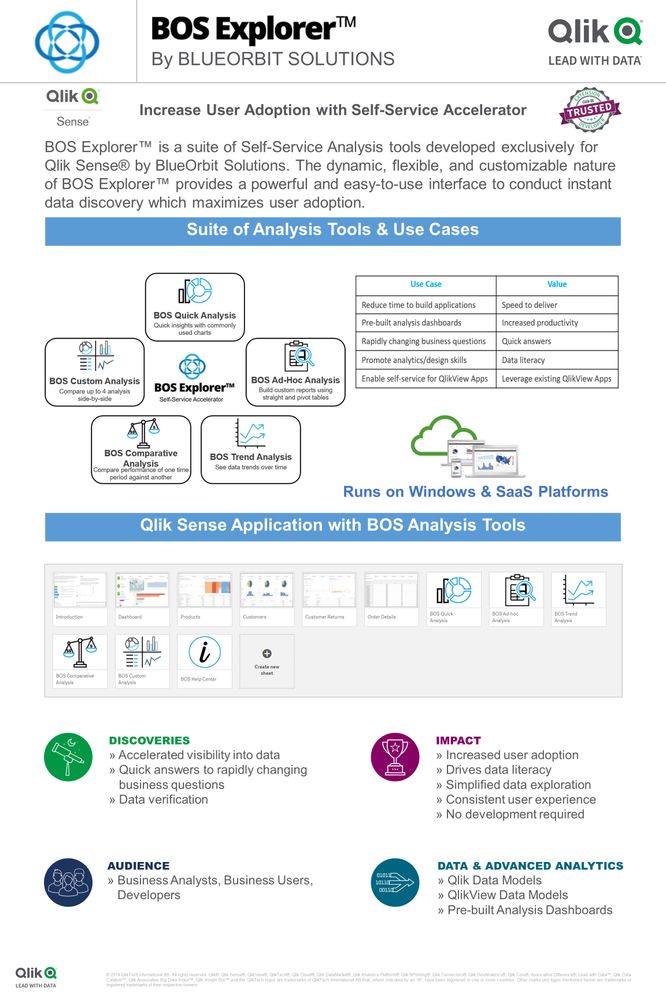
BOS Explorer™ - Self-Service Accelerator for Qlik Sense
To Experience BOS Explorer™ - Click Here Show More -
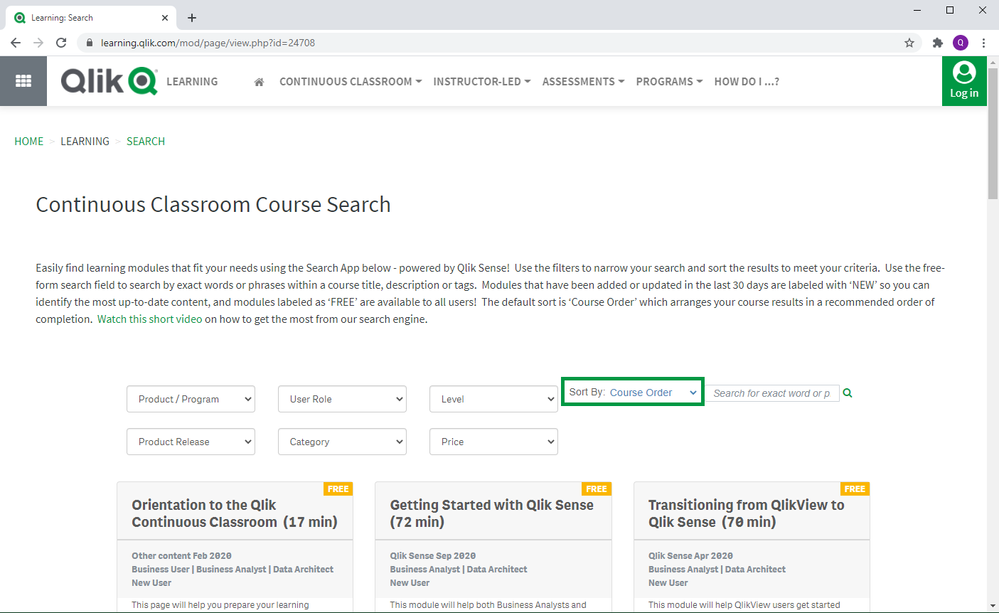
Updates to the Qlik Continuous Classroom Course Search
Here in the Qlik Education team, we are always working on improving your user experience within the Qlik Continuous Classroom. One of the most recent... Show MoreHere in the Qlik Education team, we are always working on improving your user experience within the Qlik Continuous Classroom. One of the most recent improvements we have made is to our Course Search functionality.
The Continuous Classroom Course Search is your one-stop shop for finding all Qlik Continuous Classroom self-paced learning. From this page, you can filter by Product, User Role, Level, Product Release, Category and Price. You can also use the Search field to find courses with specific words or phrases.
After making your selections, course results are now returned to you sorted by Course Order as the default setting, arranging courses in a recommended order of completion. So you can search for courses based on your interest or need using the filters and Search field, and get started learning immediately in the recommended order of learning by starting with the first course on the upper right of the results, then work your way through the list!
Not interested in seeing your course results in a recommended order of completion? You can also change the ‘Sort by’ option to Newest First, A to Z, Z to A or Free First.
We hope this improvement will positively impact your user experience! Happy Learning!
Questions about the Qlik Continuous Classroom? Email education@qlik.com.
-
The Qlik Insight Advisor - More than JUST ASKing questions!
Hey Guys - a few weeks ago I introduced the Qlik Cognitive Engine in the Design Blog, What is the Cognitive Engine? and how it is responsible fo... Show MoreHey Guys - a few weeks ago I introduced the Qlik Cognitive Engine in the Design Blog, What is the Cognitive Engine? and how it is responsible for providing an (AI) Augmented Intelligence driven experience. BUT...exactly what does that mean - "Augmented Intelligence driven experience"? Sounds like marketing-speak, right? Actually, it's not a play on words. These are powerful terms that represent machine learning AND human intuition. Simply stated - instead of just solely relying on pure machine automation, as you may find with typical Artificial Intelligence applications, Augmented Intelligence works with human interaction and perspective to solve complex business problems. And when combined with our proven, super-fast, patented Associative Indexing technology - you enable context-aware suggestions that help you ask those random questions or spot hidden insights while exploring data freely. So let me see - (Augmented Intelligence + Associative Indexing) .....hmmmm...I think I'll now call this AI² -
 - The Cognitive Engine is what powers our automated chart suggestions and our new Insight Advisor available in Qlik Sense. With the Insight Advisor you can search a governed library of familiar business terms that produce multiple insights for you to explore instead of a just a single presentation of data. The Insight Advisor allows you to do so much more than just ask data questions. It can be used as a way to jump start the creation of your analytics, or better yet, as you explore and make selections - new questions may be triggered and at that moment you can open the Insight Advisor and search while in the CONTEXT of your exploration using familiar business terms to find what you are looking for. Taking this one step further, the Cognitive Engine not only learns from the data, but your behavior as well, allowing you to teach the Cognitive Engine so it produced significantly relevant insights for you to explore. Want to learn more and see this in action? Check out this brief video and let us know what you think, we want to hear from you.
Regards,
Qlik
The Insight Advisor
NOTE: Can't see the video? YouTube blocked by your organization or region? No problem, just download the attached .mp4 file to watch on your computer or mobile device.

-
Monitor, Explore, Create - Get Notified - Simplistic Qlik Sense Analysis Flow - ...
Hey guys - a large percentage of my time is spent showcasing all the great features and capabilities that Qlik products have to offer. BUT usually, a ... Show MoreHey guys - a large percentage of my time is spent showcasing all the great features and capabilities that Qlik products have to offer. BUT usually, a small percentage shows how they all work or fit together. I feel that telling stories and showing a process from beginning to end, all while keeping it brief and simple is the best way to introduce a topic of interest. In this brief 2 min video, I take you from monitoring, to exploring, to the creation of an intelligent alert to get notified of changes in your data.
(Video transcript attached below)
Granted, some of these examples I use can be seen as an oversimplification in the grand scheme of things - but are they really an oversimplification? Just because the data is based on a collection of video games is it really different than that of stocks, or products for sale, or insurance portfolios, or pharmaceuticals, logistics, healthcare data etc. you get my point. Data is a combination of time, measures, locations, categories, expressions - basically the numerical components along with the who, what, when and where etc. and when made ready for analysis it can answer your questions that will help make informed decisions or identify problems to be addressed, or processes that should be repeated.
For this example and others I have created, it just so happens that this data speaks to me, it is interesting and it allows me to understand all the features, capabilities and possibilities with Qlik Sense to allow me to share them with you in an easy to explain fashion and perhaps in a manner that you can relate to. I recommend everyone use a dataset that they love and want to know more about when learning all the new features or functions that Qlik Sense has to offer.
Tell me what you think and if so - tell me what datasets you use and find interesting to help you understand Qlik Sense.
Features shown in this video:
- Chart Monitoring: https://youtu.be/MFXPZ_uffzs
https://help.qlik.com/en-US/cloud-services/Subsystems/Hub/Content/Sense_Hub/Hub/monitor-charts-hub.htm - Data Alerts: https://www.youtube.com/watch?v=V6szm8jjzuA
https://help.qlik.com/en-US/cloud-services/Subsystems/Hub/Content/Sense_Hub/Alerting/monitoring-changes-with-alerts.htm - MGO Image Grid:
https://developer.qlik.com/garden/56e8f64ee37930b98cf9dea4
- Chart Monitoring: https://youtu.be/MFXPZ_uffzs
-
A Time to Connect and Reflect
As we approach the end of 2020, there’s no doubt that this was an unusual year. But one aspect that did not change was the continued growing demand f... Show MoreAs we approach the end of 2020, there’s no doubt that this was an unusual year. But one aspect that did not change was the continued growing demand for more data. So, let’s reflect back from a data connectivity point-of-view on all of the data sources that we added or enhanced connectivity to in 2020 to expand Qlik’s overall analytics capabilities.
In 2020 these are just a few highlights of the "connections" we've made in SaaS:
- Apache Drill
- Apache Phoenix
- Apache Spark
- AWS DynamoDB
- AYLIEN News V2
- Azure Synapse
- Bitly
- Cassandra
- CouchBase
- Google Big Query Storage API including support for a customer-managed encryption key
- Google Cloud Storage
- Marketo
- Microsoft Dynamic CRM
- Microsoft OneDrive (read only)
- Microsoft Outlook 365
- Microsoft SharePoint 365
- MongoDB
- OData
- Qualtrics Experience Management (XM)
- SAP HANA
- Slack V2
We simplified the overall workflow from data to insights, specifically to support new users getting started as quickly and easily as possible. As an example, we improved the usability of data modeling in combination of user experience enhancements and inline guides.
Qlik DataTransfer is now available in both SaaS editions of Qlik Sense for secure access to on-premises data and local files, and more Connectors are now available in the Add-data screen to make it easier for users to access key data sources.
And, to end the year, we just released an updated Standalone Qlik Web Connectors package which contains many performance and functionality improvements. More details on this package release came be found here.
Finally, in the same spirit of connect and reflect, we enhanced the “Connect and Learn” resource channel to provide quick access to exciting product news, supporting demos and programs available to our users to improve the journey to insights and path to success. As we continue our rapid innovation in the cloud next year, SaaS users can use the Connect and Learn panel to stay informed about all of the latest product updates and enhancements.
We hope everyone has a safe and healthy holiday. Here’s hoping that a year from now, we will all be experiencing a more typical holiday season environment.
-
New Qlik Web Connectors Package - available now!
General improvements include sorting of connectors in alphabetical order, a ‘Copy to Clipboard’ button at the top of the script page, and connectors d... Show MoreGeneral improvements include sorting of connectors in alphabetical order, a ‘Copy to Clipboard’ button at the top of the script page, and connectors defined as disabled are now excluded from the list, and a lot more including:
- Azure Storage – added support for sub directories
- Facebook Insights – default values for start and end date parameters
- Google Analytics – improved behavior of max-results parameter
- Office 365 SharePoint – added 'Sub Site Path' as a parameter to the SiteUsers table
- Twitter – new strategy for converting the JSON API response to XML
- No connectors have beta status, but all are fully supported
The following connector APIs have been updated to provide improvements in various features as well as performance, and in most cases, there are changes in columns available:
- Facebooks Fan Pages
- Facebooks Insights
- FTP/SFTP
- Google Ad Manager
- Google AdSense
- Google Drive & Spreadsheets
- Mailbox IMAP
- Mailbox POP3
- SMTP
- Strava
- SugarCRM
You can find significant details called out in the release notes, and via links to particular API documentation on the Qlik Connectors Help.
Five connectors have also been replaced because the API to the sources have been updated, and the changes were so extensive that it wasn’t possible to modify the existing connectors. The affected connectors are:
- AYLIEN News
- Bitly
- OneDrive
- Slack
- Microsoft Dynamics CRM
We have already released a new version for each of these connectors with the suffix V2, see more details in this blog.
On the technical side, the Web Connectors now requires .NET Framework 4.7.2 (previously 4.5.2). Furthermore, the TLS version is no longer necessary to set in the code, and HSTS support has been added as an option (in deploy.config).
Finally, be aware that there are some extra things you need to do when upgrading to this version. See the upgrade section in the release notes for more details. Since there are some security improvements, you may also need to reauthenticate in the browser when using the new version for the first time.
The new release package and the release notes are available from the Qlik download site.
Enjoy!
-
-
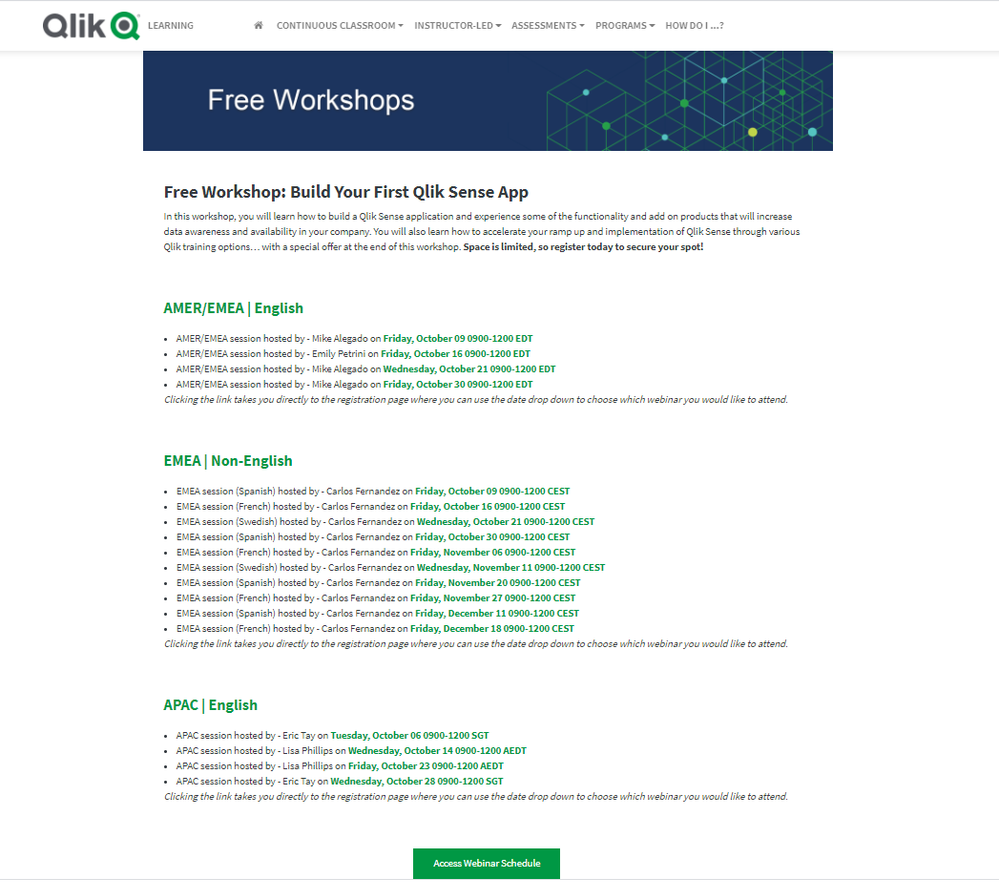
Free Workshop: Build Your First Qlik Sense App
Join us for the upcoming, hands-on workshops to learn how to build a Qlik Sense application and experience some of the functionality and add on produc... Show MoreJoin us for the upcoming, hands-on workshops to learn how to build a Qlik Sense application and experience some of the functionality and add on products that will increase data awareness and availability in your company.
You will also learn how to accelerate your ramp up and implementation of Qlik Sense through various Qlik training options...with a special offer at the end of the workshop. 3-hour sessions will be held weekly in multiple time zones.
Space is limited, so register today using below link to secure your spot!
Find a webinar that works for you and register today.

-
Be Data Brilliant with the Qlik Academic Program
In case you missed it, the #Qlik Academic Program together with #DataBrilliantUnplugged hosted a live session where external professors, students, and... Show MoreIn case you missed it, the #Qlik Academic Program together with #DataBrilliantUnplugged hosted a live session where external professors, students, and data enthusiasts got a chance to meet some of the Academic Program members to discuss careers in data!
The program is honored to have supported the professors curriculum and the students desire to build futures in the world of data analytics by providing software, training, and data literacy resources!
For more information about this session and to watch the video, visit Qlik's blog post
Professors and students are welcomed to apply today at qlik.com/academicprogram

-
Sharing Qlik Love for the Holidays (Part II)
Two additional Zoom backgrounds available below. -
Qlik Academic Program Webinar on 2nd December
The Qlik Academic Program team conducts webinars for the academic community on a regular basis. The purpose of these webinars is to introduce the prog... Show MoreThe Qlik Academic Program team conducts webinars for the academic community on a regular basis. The purpose of these webinars is to introduce the program to students and professors, talk about the resources available which includes online training, qualifications, certifications, the data analytics curriculum etc. and help them begin their learning journey. For the APAC region, I conducted a webinar on December 2nd 2020 in what was the fourth webinar this year
There were more than 450 registrations from the region for this webinar. During my interactions with students in the past, I was told that they are keen to understand from prospective employers about opportunities in data analytics. Bearing this in mind and to enlighten them, I invited one of Qlik's Partners and a Speaker in data analytics, Dr Vipul Vashisht who's the Co-Founder and CEO of Lagozon Technologies Pvt. Ltd. Lagozon is based in India with a presence in the US, UAE and Singapore and they offer solutions in retail, manufacturing, logistics and distribution, telecom and media and the BFSI industry
Vipul spoke about the opportunities in data analytics and how this is a key skill to be acquired by students. He also expressed his challenges in recruiting for his own company in analytics and how the Qlik Academic Program is helping bridge the skills gap in the industry. His talk was received very well by the audience.
Following his talk, I continued explaining the resources available under the academic program ending up with a product demo. It was a wonderful opportunity interacting with students once again and I hope they are able to take benefit of the resources offered by the Qlik Academic Program.
To learn more about the program, visit Qlik.com/academicprogram and if you have any questions, write to us on academicprogram@qlik.com
-
Qlik is raising the bar once again with the September 2020 Product Release!
Summary VideoFeature DemonstrationAugmented Intelligence:To begin, Insight Advisor Chat is our brand new conversational analytics experience, built in... Show MoreSummary Video
Feature Demonstration
Augmented Intelligence:
To begin, Insight Advisor Chat is our brand new conversational analytics experience, built into Qlik Sense and available through the Qlik Sense SaaS hub. It gives more people a faster and easier way to ask questions across all their apps, to make data-driven decisions. We also added a new business logic layer to customize and guide the behavior of Insight Advisor when generating insights and interacting conversationally with users. And we now offer advanced analytics calculation to complement our real-time integration capabilities, beginning in this release with K-means clustering.
Insight Advisor now enhances a full range of user experiences in Qlik Sense. With search-based visual analysis, conversational analytics, associative insights, accelerated creation and data preparation, and advanced analytics – delivering the most competitive set of augmented capabilities on the market today, helping our users maximize the potential. The full set of augmented features in this release are only available in SaaS but will soon be available in an upcoming release in client-managed (Windows).
SaaS Capacities and Hub Improvements:
Qlik Sense Enterprise SaaS is supporting limitless use cases to drive down the total cost of ownership for cloud migration. Here are some of the items we are most excited about:
- Doubled the standard max app size in memory (up to 5GB) in Qlik Sense Enterprise SaaS and have enabled unlimited data reloads and storage for all new and existing customers
- UI improvements for a more consistent and appealing experience
- Hub improvements: including system notifications by email, chart history, improved data management
- Qlik DataTransfer, our new utility to push on-premises data to the cloud
Visualization Improvements:
As with every release, we remain committed to delivering world-class visualization enhancements. With this release, you will find new features such as a new animator to show changing data over time, improved reference lines, and several other highly requested visualization improvements. You can find the best of our continued investment in visualization in our visualization showcase app.
- Other Chart improvements include:
- Number formatting of master measures
- Turn on and off borders in containers
- Custom sorting in Sankey Chart
- Frequency counts in the filter pane
- WMS (web map service) layer opacity
- Hover icons toggle
APIs to include support for Qlik built open-source libraries
Qlik continues to invest in its ‘API first’ strategy, and with that, we will provide support for an initial group of open source libraries including enigma.js and nebula.js. Support expansion will also include qlik-cli, which provides access to all public APIs through the command line, making it easier to script and automate new and old workflows. This list will continue to expand, and updates will be made available on Qlik.dev. Leverage our Qlik Community Forums for questions regarding open source libraries, and our team will provide guidance as needed.
Data Integration Improvements:
This release includes improvements to our Data Integration Platform, including the ability to publish directly to PowerBI from Qlik Catalog. We’re also continuing to raise the performance bar with Qlik Compose for Data Warehouses by leveraging the MPP architecture capabilities in Snowflake and Azure Synapse. This release both improves performance and reduces operational spend. Finally, we’ve added new audit capabilities for SOX compliance by logging and encrypting all modifications to the DW design or target data sets.
For more information, visit https://help.qlik.com/en-US/sense and register for the next Do More with Qlik webinar, as Mike Tarallo will go into detail on our Next Generation AI Enhancements!
-
Deliver More Insight with Qlik Sense Conversational Analytics
Natural Language Processing is one of the leading trends in BI today, supporting search-based interaction and fully conversational analytics. With con... Show MoreNatural Language Processing is one of the leading trends in BI today, supporting search-based interaction and fully conversational analytics. With conversational analytics, more people – especially less sophisticated users – can embrace analytics using natural language, giving them a faster and easier way to ask questions of data, gain insights, and make data-driven decisions.
“Data and analytics leaders need to examine the potential business impact of these trends* and adjust business models and operations accordingly, or risk losing competitive advantage to those who do,” said Rita Sallam, research vice president at Gartner. The Conversational AI market is predicted to grow from $4.2 billion in 2019 to $15.7 billion in 2024. And, by 2021, and the use of NLP and conversational analytics will increase the ability for new types of users to investigate and obtain business knowledge from 35% of representatives to over half.
As conversational analytics proliferate, more organizations can expand the footprint of their analytics platform, placing more data in the hands of users who demand a simplified experience from their analytics platform.
Conversational, Natural-Language Insights
Insight Advisor in Qlik Sense is your intelligent AI assistant, enhancing your ability to gain insights and drive business decisions across the analytics lifecycle. Both visual and associative analyses and insights are auto-generated by Insight Advisor. Insight Advisor also provides Natural Language Processing and Generation (NLP and NLG), supporting conversational analytics and search-based visual analysis in Qlik Sense. Machine learning provides more relevant insights over time, and a robust business logic layer enables customization of insight generation and natural language interaction. And of course, with the Qlik Associative Engine, you get unmatched context awareness and peripheral vision.
Insight Advisor provides you with end-to-end AI capabilities to drive business decisions
Insight Advisor Chat gives you a fully-conversational natural language experience in Qlik Sense. It features Natural Language Processing (NLP) that understands user intent, and Natural Language Generation (NLG) to deliver additional insight and perspective. NLP and conversational analytics are highly complementary with augmented analytics. Unlike standalone products, Qlik Sense allows you to ask questions in a conversational manner then dive directly into search-based visual analysis for deeper insight and exploration. Insight Advisor Chat is available directly from the hub, supporting search across Qlik Sense apps; you can ask questions without knowing where to look for data.
How QlikView customers can utilize Insight Advisor Chat
Getting started with Insight Advisor Chat is simple. It is part of Qlik Sense, so as a QlikView customer, you can easily convert your QlikView app over to Qlik Sense using the same data model. QlikView and Qlik Sense share the same data model and the Insight Advisor has the ability to consume Qlik Sense data models. In addition, the Insight Advisor does not require pre-built dashboards in an app, so you do not need to rebuild all your visualizations. You’ll be able to immediately begin using Insight Advisor Chat, which will accelerate development of your first Qlik Sense application.
So, as expectations for analytics evolves you can expand use of Qlik Sense to remain relevant and stay ahead of your competition by implementing new apps and new BI use cases. Qlik has worked hard to eliminate the common barriers to adopting Qlik Sense for QlikView customers. These include:
- Technical: We’ve worked diligently to add more robust visualization and application development functionality in Qlik Sense. We’ve made many improvements, including adding over 20 new visualization types and over 50 new visualization and dashboard features, along with greater flexibility around content distribution. This means as a QlikView customer you can feel confident that you’ll be able to create rich applications in Qlik Sense.
- Migration: You don’t need to migrate. You can continue using your existing QlikView apps as you modernize with Qlik Sense. But if you do choose to convert apps, the free Governance Dashboard helps you identify the QlikView apps that would easily migrate to Qlik Sense. Then, the QlikView Converter helps you easily convert QlikView apps to Qlik Sense, including migration of data models and expressions.
- Learning curve: Qlik Sense was specifically designed for ease of use and self-service. The QlikView to Qlik Sense Learning Path within Qlik Continuous Classroom provides many free self-paced Qlik Sense training courses. In addition, the Qlik services organization has several offerings to help your organization plan and execute your QlikView to Qlik Sense modernization.
- Cost: The Analytics Modernization Program gives Qlik Sense entitlement to your QlikView users for a modest uplift on your annual QlikView maintenance rate. Flexible deployment types are available.
The most economical way to modernize your analytics is through Qlik Sense Enterprise SaaS. The SaaS deployment gives you the benefits of infrastructure cost savings resulting from use of a Qlik-managed environment. You’ll experience a fast setup with no installation, short learning curve for users, automated version upgrades, and dramatically lower TCO. You can consume both QlikView and Qlik Sense side-by-side through the Qlik Sense Enterprise SaaS hub and utilize QlikView Publisher to automate QlikView document uploads.
For resources and discussion on QlikView to Qlik Sense, visit the community group. And, contact your Qlik account manager or partner for more information on the Analytics Modernization Program.
*NLP, augmented analytics, augmented data management, continuous intelligence, explainable artificial intelligence (AI), graph analytics, data fabric, commercial AI and machine learning, blockchain, and persistent memory servers
-
Using Nebula.js with Angular or Svelte
If you are new to this community and you are interested in putting together web pages that will serve as dashboards based on your Qlik Sense charts, t... Show MoreIf you are new to this community and you are interested in putting together web pages that will serve as dashboards based on your Qlik Sense charts, then let me start with a brief introduction.
If you are aware of the library and have read my previous post “Using Nebula.js with React.js or in Simple html pages”, then you can skip it and go straight to the framework of your choice.
Introduction
Nebula.js is an open source “collection of JavaScript libraries, visualizations, and CLIs that helps developers build and integrate visualizations on top of Qlik's Associative Engine”.
It connects to all of our available Qlik Sense products, including the Qlik hosted, Qlik Sense Business and Qlik Sense Enterprise for SaaS.
You can find documentation and how to get started here
https://qlik.dev/libraries-and-tools/nebulajs.
There are also some tutorials like
- https://qlik.dev/tutorials/build-a-helloworld-extension-using-nebulajs
- https://qlik.dev/tutorials/build-a-simple-mashup-using-nebulajs
- https://qlik.dev/tutorials/build-a-simple-web-app
Angular
Today I will show you a template that I put together that uses the Angular 10 framework and some of the available Picasso charts.
The template can be found here https://github.com/yianni-ververis/nebula-angular.
From bash, powershell or any other cli interface start by
- Downloading the repository
git clone git@github.com:yianni-ververis/nebula-angular.git- Add your Qlik Sense url, appId and/or the webIntegrationId if you are building against the Qlik Hosted, Qlik Sense Business and Qlik Sense Enterprise for SaaS, in the src/app/globals.ts
- Install the appropriate packages by running
npm install- Change the dimensions and measures in the charts. You can start by changing the dimension and measure fields in the Barchart at scr/app/barchart/barchart.component.ts, Lines 25 and 28. The ones in the template are from the Helpdesk app.
Svelte
Here, is a Svelte.js starter repo with of the available Nebula charts
The template can be found here https://github.com/yianni-ververis/nebula-svelte
From bash, powershell or any other cli interface start by
- Downloading the repository
git clone git@github.com:yianni-ververis/nebula-svelte.git- Add your Qlik Sense url, appId and/or the webIntegrationId if you are building against the Qlik Hosted, Qlik Sense Business and Qlik Sense Enterprise for SaaS, in the src/components/stores.js
- Install the appropriate packages by running
npm install- Change the dimensions and measures in the charts. You can start by changing the dimension and measure fields in the Barchart at scr/containers/BarChart.svelte, Lines 15 and 18. The ones in the template are from the Helpdesk app.
-
Driving Towards Active Intelligence with the November 2020 Qlik Product Release
Capitalizing on emerging business moments requires a state of continuous intelligence where technology and processes trigger immediate actions from ... Show MoreCapitalizing on emerging business moments requires a state of continuous intelligence where technology and processes trigger immediate actions from real-time, analytics-ready data – what we call “Active Intelligence”. People need relevant, personalized insights, delivered as data is changing. With data alerting in Qlik Sense, our customers can move from passive to active data consumption, going beyond the dashboard to take immediate action at the speed of data.
Data alerting is now included with Qlik Sense Enterprise SaaS subscriptions – fully integrated into the Qlik Sense experience, supporting both self-service and centrally managed alerts. Just right click on any chart to create a new alert. Alerts feature statistical evaluation of new data against thresholds, comparisons between measures, condition and/or logic, and the ability to trigger alerts based on individual dimension values. And of course, because of our unique Associative Engine, alerts are always in-context and users can immediately analyze further to determine what action is needed.
In addition to alerting, the November 2020 data analytics release includes several other exciting new capabilities, including:- Insight Advisor enhancements including improvements to business logic Insight Advisor enhancements including improvements to business logic and a new vocabulary options to enhance natural language queries
- Expanded App capacity for larger data sets
- Support for larger QlikView Apps and document chaining to support our analytics modernization program
- Insight Advisor Chat for Qlik Sense on Windows, available as a value-added capability
- And a host of new visualization and authoring capabilities, some of which are featured in the Qlik Sense Visualization Showcase to see them in action
- More Connectivity: with Google Cloud Storage, OData, and JDBC support for Couchbase, Cassandra, AWS DynamoDB, and SAP HANA
And it doesn’t stop there, as November 2020 also provides many new improvements to the Qlik Data Integration Platform. This release includes new endpoints, improved integrated workflows and performance, security enhancements, and new certifications to align with customer and industry demands. We are especially excited about the following new features:
- Data warehouse automation for Google Big Query
- Expansion of SAP integration options through new support for SAP Extractors as a new Source
- New high demand endpoints including Databricks Delta target, Cloudera Data Platform Private Cloud target, and Azure MySQL source
- Automated registration of Qlik Data Integration created data sets into Qlik Catalog
Longer Feature Demo
Don’t miss the next Qlik Insider, where some of our product experts will go into more detail on what is listed above and more. We will also provide detail on our latest acquisition of Blener.io and the importance of this addition to our technology portfolio. Register here
Read more about these enhancements on help.qlik.com
-
Final week to apply to become a Qlik Academic Program Professor Ambassador
This week is your last chance to apply to become a Qlik Academic Program Professor Ambassador for 2021. In case you haven’t heard, this is a brand-new... Show MoreThis week is your last chance to apply to become a Qlik Academic Program Professor Ambassador for 2021. In case you haven’t heard, this is a brand-new initiative where we will be celebrating our most active educator members! Our ambassadors will champion our vision to make more students data literate and to prepare them for the data-driven workplace.
If one or more of the below points describes you, then we encourage you to apply:
- Passionate about the Qlik Academic Program and the resources provided to students and educators
- Passionate about educating students to be prepared for the data-driven workforce and to secure jobs.
- An active promoter of the Qlik Academic Program to academic peers as well as students
- Willing to share your experience of the Qlik Academic Program at (virtual) events, in forums, on social media and in the press
- A contributor to blogs, forums, university publications, professional journals, papers, or other materials that promote the Qlik Academic Program
Please note, to be eligible for this program you must be a university educator and an existing member of the Qlik Academic Program.
As a Professor Ambassador you will receive a host of benefits including:
- Insight: Exclusive webinars with Qlik leaders, covering the latest trends in analytics and other industry topics
- Credibility: A digital badge to certify ambassador status and a featured online profile
- Exposure: Outreach opportunities to showcase your experience with the Qlik Academic Program via Qlik marketing channels or speaking engagements
- Perks: Discounts on Qlik events and other exclusive rewards
- Community: Connect with other professors across various fields and geographies
- Opportunity: Potential to advance your career including meeting university requirements for scholarly contribution beyond the classroom
We have received some great applications so far, and we are looking forward to selecting our inaugural class of 2021 very soon.
Click here for full program details and to apply.
Applications close 30 November 2020. Apply now!
-
Sharing Qlik Love for the Holidays (Part I)
How is it possible that we are entering the official "holiday season" in 2020? In so many ways, the year has seemed to drag on, hour-by-hour, as we mu... Show MoreHow is it possible that we are entering the official "holiday season" in 2020? In so many ways, the year has seemed to drag on, hour-by-hour, as we muddle through an often dark and stressful time. But in other ways, the year flew by in a sea of virtual meetings and an even further blurred lines of work and home life. We blinked and it was Thanksgiving in the US. We blinked again and it was December, and the beginning of Hanukkah and the shopping season. We exhaled and we were celebrating Kwanzaa.
So now, we invite you - our cherished Qlik community of users and technologists - to pause with us. Pause to celebrate the season of joy, giving, peace and all the other qualities of life we aspire to in ourselves and each other.
Please share in the season by downloading any or all of the Zoom backgrounds for Holiday 2020 and enjoying them on your own desktops. There are 5 to choose from: 3 here and 2 additional uploaded on Part II here.
And the warmest greetings of the season to you and your families from Team Qlik.