Unlock a world of possibilities! Login now and discover the exclusive benefits awaiting you.
- Qlik Community
- :
- All Forums
- :
- QlikView App Dev
- :
- Empty space in Line Chart
- Subscribe to RSS Feed
- Mark Topic as New
- Mark Topic as Read
- Float this Topic for Current User
- Bookmark
- Subscribe
- Mute
- Printer Friendly Page
- Mark as New
- Bookmark
- Subscribe
- Mute
- Subscribe to RSS Feed
- Permalink
- Report Inappropriate Content
Empty space in Line Chart
Hello everyone,
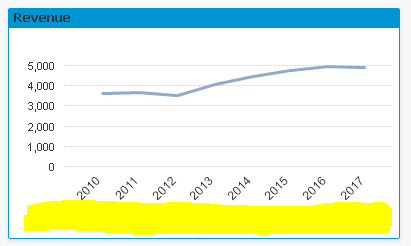
I´d like to know, how to delete the "empty" space below my line chart.
I attached a picture of the problem. I´d like the x-axis to end right at the bottom border of the chart. Thus I want to "delete" the yellow marked part or "zoom in" on the diagram.
Many thanks in advance.
Lina
- Mark as New
- Bookmark
- Subscribe
- Mute
- Subscribe to RSS Feed
- Permalink
- Report Inappropriate Content
Hi Lina,
Activate the chart and then hold down ctrl + shirt, that will allow you to adjust the position within the chart area
hope that helps
Joe
- Mark as New
- Bookmark
- Subscribe
- Mute
- Subscribe to RSS Feed
- Permalink
- Report Inappropriate Content
Hi Lina, click on graph and press CTRL+MAYS, there you can see marked in red the area of the graphic and check is there is something in bottom.
Also you can adjust the limits.
- Mark as New
- Bookmark
- Subscribe
- Mute
- Subscribe to RSS Feed
- Permalink
- Report Inappropriate Content
Hi Joe,
thanks for the quick response. With holding CTRL+SHIFT I can adapt the chart size.
What happens though, is that the chart is extended - but the axis stays the same. So I drag my chart "over" the axis and make it disappear.
Can I also move the axis somehow?
Best regards,
Lina
- Mark as New
- Bookmark
- Subscribe
- Mute
- Subscribe to RSS Feed
- Permalink
- Report Inappropriate Content
The axis should move along, if try to move the area up you can see the axis also goes up.
There is a limitation in diagonal or vertical axis legends, it takes more empty space, if you set the legend horizontally, you can get the axis down to the limit.
I don't know if it's possible to lower more the axis when it's diagonal or vertical